
water
Article
Reducing Flood Risk in Changing Environments:
Optimal Location and Sizing of Stormwater
Tanks Considering Climate Change
Juan Saldarriaga
1,
* , Camilo Salcedo
1
, Laura Solarte
2
, Laura Pulgarín
2
,
Maria Laura Rivera
2
, Mariana Camacho
2
, Pedro L. Iglesias-Rey
3
,
Francisco Javier Martínez-Solano
3
and Maria Cunha
4
1
Department of Civil and Environmental Engineering, Universidad de los Andes, Bogotá 111711, Colombia;
ca.salcedo959@uniandes.edu.co
2
Water Supply and Sewer Systems Research Center (CIACUA), Universidad de los Andes, Bogotá 111711,
Colombia; lm.solarte@uniandes.edu.co (L.S.); l.pulgarin1772@uniandes.edu.co (L.P.);
ml.rivera11@uniandes.edu.co (M.L.R.); md.camacho@uniandes.edu.co (M.C.)
3
Department of Hydraulic Engineering and Environment, Universitat Politècnica de Valencia, 46022 Valencia,
Spain; piglesia@upv.es (P.L.I.-R.); jmsolano@upv.es (F.J.M.-S.)
4
Department of Civil Engineering, University of Coimbra, INESC Coimbra, P-3030 788 Coimbra, Portugal;
mccunha@dec.uc.pt
*
Correspondence: jsaldarr@uniandes.edu.co; Tel.:
+57-1-339-49-49 (ext. 3282)
Received: 9 July 2020; Accepted: 1 September 2020; Published: 6 September 2020
Abstract:
In recent years, there has been an increase in the frequency of urban floods as a result of
three determinant factors: the reduction in systems’ capacity due to aging, a changing environment
that has resulted in alterations in the hydrological cycle, and the reduction of the permeability
of watersheds due to urban growth. Due to this, a question that every urban area must answer
is: Are we ready to face these new challenges? The renovation of all the pipes that compose the
drainage system is not a feasible solution, and, therefore, the use of new solutions is an increasing
trend, leading to a new operational paradigm where water is stored in the system and released at a
controlled rate. Hence, technologies, such as stormwater tanks, are being implemented in di
fferent
cities. This research sought to understand how Climate Change would a
ffect future precipitation,
and based on the results, applied two di
fferent approaches to determine the optimal location and
sizing of storage units, through the application of the Simulated Annealing and Pseudo-Genetic
Algorithms. In this process, a strong component of computational modeling was applied in order to
allow the optimization algorithms to e
fficiently reach near-optimal solutions. These approaches were
tested in two stormwater networks at Bogotá, Colombia, considering three di
fferent rainfall scenarios.
Keywords:
climate change; stormwater storage tanks; simulated annealing; pseudo-genetic algorithm;
SWMM; toolkit
1. Introduction
The concept of integrated urban drainage systems was developed as a modern solution for the
management and design of stormwater and wastewater systems in urban settlements. Traditionally,
urban drainage systems sought to evacuate peak flows as rapidly as possible; nowadays, these systems
pursue the attenuation of peak flow rates resulting from rainfall events. This transformation in the
design and management paradigm of drainage systems is a consequence of changing conditions
in the system. Climate Change is generating an increase in rainfall intensity, which, coupled with
high urbanization rates at modern cities and obsolete infrastructure, has led to increased peak flow
Water 2020, 12, 2491; doi:10.3390
/w12092491
www.mdpi.com
/journal/water

Water 2020, 12, 2491
2 of 24
rates [
1
]. As a result, the occurrence of flooding in urban areas has become more frequent, leading to
the appearance of public health problems, economic losses, among other undesirable consequences.
Thus, the adaptation of urban drainage systems to these new conditions is a challenge that modern
systems must address.
The increase in rainfall intensity due to Climate Change and the resulting negative e
ffect on
the operation e
fficiency of the urban drainage system for peak runoff water are stated in the Fourth
Assessment Report (AR4) of the Intergovernmental Panel on Climate Change. This document presents
an increase in the frequency of extreme rainfall events as a consequence of Climate Change, based on
climate model simulations with di
fferent future greenhouse gas emission scenarios. Moreover,
the report concluded that this trend will very likely to continue in the 21st century, described as more
than 90% likelihood [
2
].
In the literature, di
fferent methods have been proposed to consider the effects of Climate
Change in rainfall events. A general approach proposed by Padulano et al. [
3
] contemplates the
process of downscaling of global macroclimatic models. Then, the significance of Climate Change is
estimated statistically in current and future data. Finally, an ensemble model is used to build novel
intensity-duration-frequency curves, and their e
ffects on the early warning system thresholds for the
area of interest are evaluated [
3
]. Therein, Zeroual et al. [
4
] proposed another approach that consisted
of the analysis of future changes over a period of time, based on the Representative Concentration
Pathways. Subsequently, a statistical analysis of the evolution of climate zones extent is performed.
At last, the climate model considering the special variations of Climate Change is adjusted [
4
]. In order
to integrate these components and adapt them to the conditions in the study area, the methodology
discussed below was implemented.
Climate Change has become an important driving force in the development of urban drainage
systems due to the e
ffect it has on the occurrence of urban rainfall extreme events [
5
], which lead
to the increase of flood risk by almost 30 times [
6
]. Several Global Climate Models (GCMs) have
been used to determine the e
ffects of Climate Change on a global scale, while a prediction of the
e
ffects of these climatic variations on a local scale can be accomplished based upon the application
of downscaling techniques to GCM results. The downscaling of GCM is required to obtain a higher
temporal and spatial resolution for local studies [
1
], and it relies on the use of Weather Generators,
which produce synthetic time series of weather data of unlimited length for a location based on
the statistical characteristics of observed weather at a location [
7
]. Considering these new climatic
parameters, the e
ffect of climate change in both global and local weather patterns should be considered
in the design and optimization of urban drainage infrastructure [
5
].
These new conditions need to be considered as the peak flow reduction mechanisms will be
designed on a risk basis, requiring the prediction of a water surface elevation with a given probability.
The probability is directly related to the causative rainfall, specifically in extreme events. Then, the inlet
flow to the drainage system will experience significant extreme events, which will compromise the
operation of the system [
3
,
8
]. An important point to note is the di
fference between the return period of
the rain and the concentration-time. As the peak reduction mechanisms are installed, the return period
of the rain does not change. On the other hand, the concentration-time, in which the maximum level
occurs in each duct, increases. Therefore, the return period (failure probability) of the flood increases.
In other words, there is a lower probability or risk due to the e
ffect of rain on the system.
To address these new challenges, Sustainable Urban Drainage Systems (SUDS) were born as a
solution to enhance the management of integrated urban systems. Several studies have analyzed
di
fferent measures to reduce and prevent urban flooding, leading to a classification into costly and
e
ffective structural measures and less expensive and less effective non-structural alternatives [
9
].
These approaches include structural interventions to either new or existing infrastructure, which are
used either before the water enters the drainage system, such as green roofs, permeable pavements,
and swales, or after this occurs, such as stormwater tanks.

Water 2020, 12, 2491
3 of 24
There are various peak flow reduction practices in urban systems, some of which involve smart
gullies that take stormwater inflow from the ground to the pipeline. The gullies are controlled in
real-time and, therefore, capable of predicting the weather conditions [
10
]. Besides, a scheme for
Successive Low-Impact Development Rainwater Systems (SLIDRS) in residential areas has been
proposed with the objective of decreasing peak flows and total runo
ff volume [
11
]. This Green
Infrastructure provides alternatives to control the peak flows in urban drainage systems.
Some studies have addressed the optimal location of Green Infrastructure units for runo
ff reduction,
also considering pollution reduction due to these systems [
12
]. To evaluate the performance of di
fferent
SUDS, it is necessary to use models that consider the system holistically, simulating di
fferent hydrologic
scenarios, as well as its hydraulic behavior once the rainfall has become runo
ff. Hence, software,
such as the Storm Water Management Model (SWMM) [
13
], has been widely used to accomplish this
objective due to its integration between discrete variables and non-linear functions [
14
].
In early approaches, the sizing methods for storage units are based on simplified methodologies
due to the high e
fforts required by simulations in terms of time and computational capacities. Some of
these methods include the estimation for the capacity of stormwater tanks based on historical rainfall
events, leading to some functions to generate a new statistical distribution to estimate the capacity
of Water Treatment Plants and the retention volume for a certain level of risk. Moreover, most of
the previous research about the use of storage units have sought to maximize the quality of the
water delivered to the river, rather than the control of potential overflows consequence of excessive
rainfall [
15
]. However, nowadays, the availability of computers with high-performance characteristics
allows for the appearance of several techniques, such as those described in this study, even leading to
the possibility to expand the solution universe by applying multi-objective optimization approaches to
reduce the flood damage costs while minimizing the investment costs [
8
].
Some approaches have used a genetic algorithm to search for the optimal solution among the
pool, considering superpipe-based detention tanks as detention systems [
16
]. Besides that, the optimal
design of detention tanks under the constraints of local flooding control criteria is also implemented,
with the purpose of developing an e
fficient and robust method and framework for the design of the
detention tank network. These methodologies are coupled with a hydraulic model in order to minimize
both the flooding risks and the engineering cost [
17
]. In order to integrate all these methodologies and
adapt them to an e
fficient process that adjusts to the conditions in the study area, the methodology
discussed below was implemented.
Given these conditions, optimization problems related to the management of urban drainage
systems cannot be solved using exact methods, and it is necessary to apply heuristic methodologies to
reach near-optimal solutions. Among these approaches, several heuristics have been tested. Simulated
Annealing has been applied for the optimal location and sizing of stormwater tanks by calling upon a
dynamic rainfall-runo
ff simulator for the complete evaluation of each solution [
14
]. A Pseudo-Genetic
Algorithm (PGA) has been also applied as an optimization engine for the reduction of flooding of a
small section of the drainage network of the city of Bogota, in Colombia, seeking to identify low-cost
solutions that satisfy the system requirements [
18
]. This increase in flooding is shown in Figure
1
.
The heuristics have been applied using an SWMM toolkit, developed in the scope of this research,
and used to increase the flexibility and computational e
fficiency of SWMM. This toolkit allows the
direct modification of a network model during simulation without accessing the input file [
19
].
Water 2020, 12, 2491
4 of 24
Water 2020, 12, x FOR PEER REVIEW
4 of 24
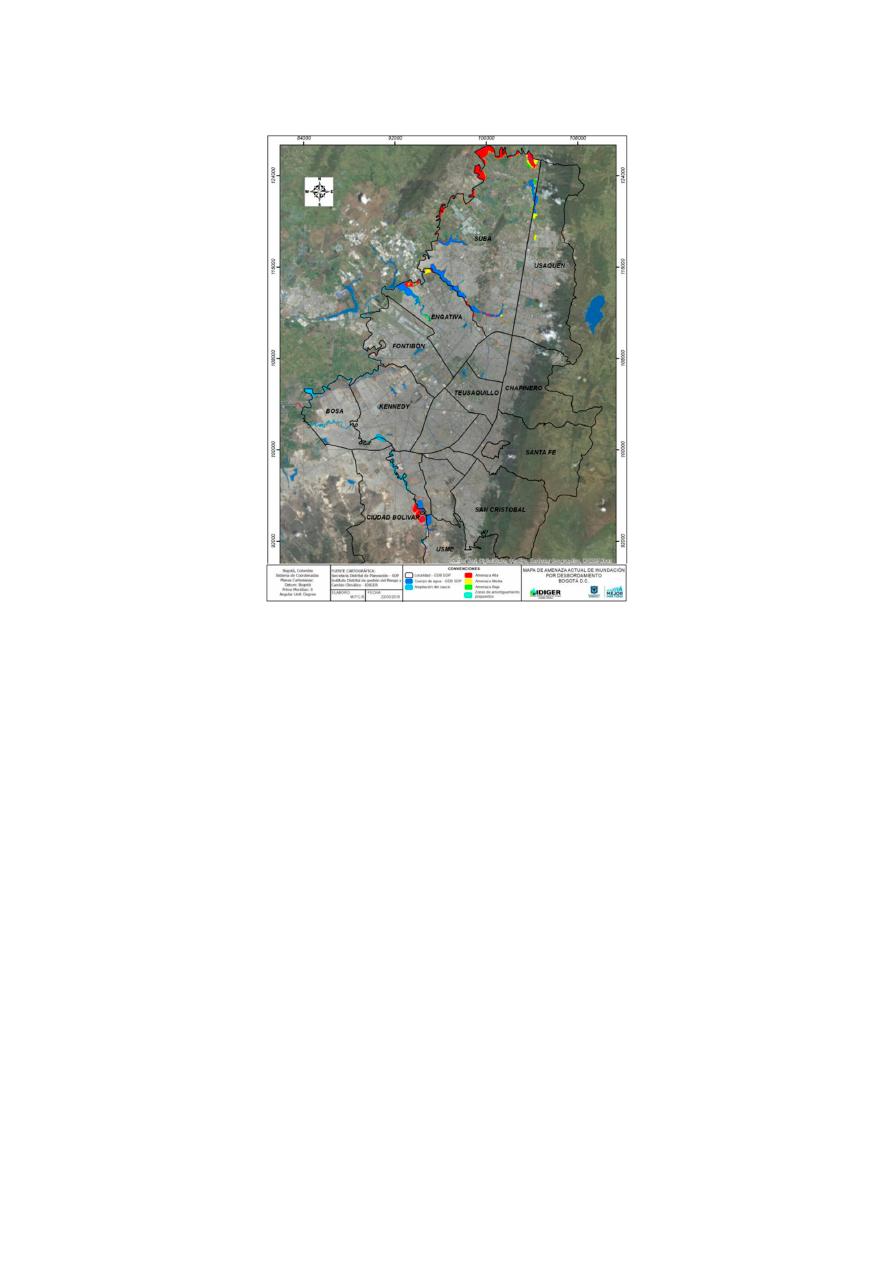
Figure 1. Flood threat from the perspective of Climate Change, prospective scenario [20].
The operation of urban drainage systems can be enhanced by the implementation of Real-Time
Control (RTC) techniques, including improvements in the sizing of the storage units. These
techniques consist of the application of a set of rules that can determine which action will be taken as
a response to the current conditions of a system [21]. Hence, the use of RTC in Urban Drainage
Systems is focused on the prevention of urban floods, the reduction of flood volumes and frequency
without requiring additional infrastructure, the reduction of the contamination of receiving bodies,
and the minimization of operational costs [21]. Predictive control strategies, such as Model Predictive
Control, Evolutionary Games, and Differential Games, have been widely used for the management
of drainage networks [16]. Moreover, different approaches and techniques can be used to describe,
simulate, and control water flows within urban water systems [22].
Real-Time Control systems have several risks that must be considered in their implementation.
These include power failures, errors in data processing scheduling, communication failures between
components, and consistency between state variables, among others [23] Despite that all these
vulnerabilities must be considered and evaluated when implementing these types of systems, this
remains as a recommendation but has not been discussed further in the scope of this paper.
This paper presented the main findings of the project Urban Drainage and Climate Change: Towards
the Stormwater Systems of the Future, seeking to identify adaptive strategies for urban stormwater
systems under Climate Change scenarios. Moreover, this paper sought to consolidate the
methodologies developed within the different areas involved in the research project, presenting the
results reached when the whole methodology was applied in two case studies, developed based on
real networks with potential flooding issues. As a result, two methodologies for sizing stormwater
tanks were compared, presenting two different approaches to prepare urban drainage systems to face
Climate Change effects in the long term. Furthermore, an SWMM toolkit (Martinez et al. [19], Bogota,
Colombia; Valencia, Spain) was developed as a computational interface between the optimizer and
the hydraulic simulation of the drainage networks. Another important research product from the
project was the development of two computational tools known as OptSU and OptiTank.
Figure 1.
Flood threat from the perspective of Climate Change, prospective scenario [
20
].
The operation of urban drainage systems can be enhanced by the implementation of Real-Time
Control (RTC) techniques, including improvements in the sizing of the storage units. These techniques
consist of the application of a set of rules that can determine which action will be taken as a response
to the current conditions of a system [
21
]. Hence, the use of RTC in Urban Drainage Systems is focused
on the prevention of urban floods, the reduction of flood volumes and frequency without requiring
additional infrastructure, the reduction of the contamination of receiving bodies, and the minimization
of operational costs [
21
]. Predictive control strategies, such as Model Predictive Control, Evolutionary
Games, and Di
fferential Games, have been widely used for the management of drainage networks [
16
].
Moreover, di
fferent approaches and techniques can be used to describe, simulate, and control water
flows within urban water systems [
22
].
Real-Time Control systems have several risks that must be considered in their implementation.
These include power failures, errors in data processing scheduling, communication failures between
components, and consistency between state variables, among others [
23
] Despite that all these
vulnerabilities must be considered and evaluated when implementing these types of systems,
this remains as a recommendation but has not been discussed further in the scope of this paper.
This paper presented the main findings of the project Urban Drainage and Climate Change: Towards
the Stormwater Systems of the Future, seeking to identify adaptive strategies for urban stormwater systems
under Climate Change scenarios. Moreover, this paper sought to consolidate the methodologies
developed within the di
fferent areas involved in the research project, presenting the results reached
when the whole methodology was applied in two case studies, developed based on real networks with
potential flooding issues. As a result, two methodologies for sizing stormwater tanks were compared,
presenting two di
fferent approaches to prepare urban drainage systems to face Climate Change effects
in the long term. Furthermore, an SWMM toolkit (Martinez et al. [
19
], Bogota, Colombia; Valencia,
Spain) was developed as a computational interface between the optimizer and the hydraulic simulation
Water 2020, 12, 2491
5 of 24
of the drainage networks. Another important research product from the project was the development
of two computational tools known as OptSU and OptiTank.
The methodology presented by this paper can be summarized as follows: First, GCMs were used
to determine the global e
ffects of Climate Change, and then a downscaling technique was applied
to establish the local e
ffects in the study area, located in Bogota, Colombia. Precipitation scenarios
with and without Climate Change were developed to identify the e
ffects of this phenomenon on this
research’s analysis, with their respective comparisons. Secondly, the use of stormwater tanks was
selected as an accurate technique for peak flow reduction in this urban watershed. Consequently,
two di
fferent approaches to determine the optimal location and size of the storage units were tested,
considering several rainfall scenarios in the study area. In addition, methodologies were applied to
reduce computational times when applying these techniques to large and complex networks. Finally,
some approaches to the feasibility of implementing Real-Time Control were discussed; however,
the results of these techniques were not discussed in this paper.
2. Methodology
Existing drainage systems, originally designed with proper conditions, are not well prepared to face
new challenges, such as Climate Change, increasing urbanization processes at cities, and out-of-capacity
systems. This results in an increase in the occurrence of urban floods. However, a new paradigm in the
operation of drainage systems has appeared in order to prepare urban settlements to address these
new conditions.
Given this situation, in the scope of this research, several knowledge areas interacted to provide
new solutions to reduce urban flooding. First, a Climate Change strategy was proposed to understand
how this phenomenon will a
ffect variables, such as precipitation and temperature, and based on this,
predict their future behavior. Once the main input of stormwater systems, the rainfall, was determined,
two di
fferent approaches were used to determine the optimal sizing and location of storage units
in order to reduce peak flows. To develop these optimization methodologies, strong computational
modeling was required to guarantee the e
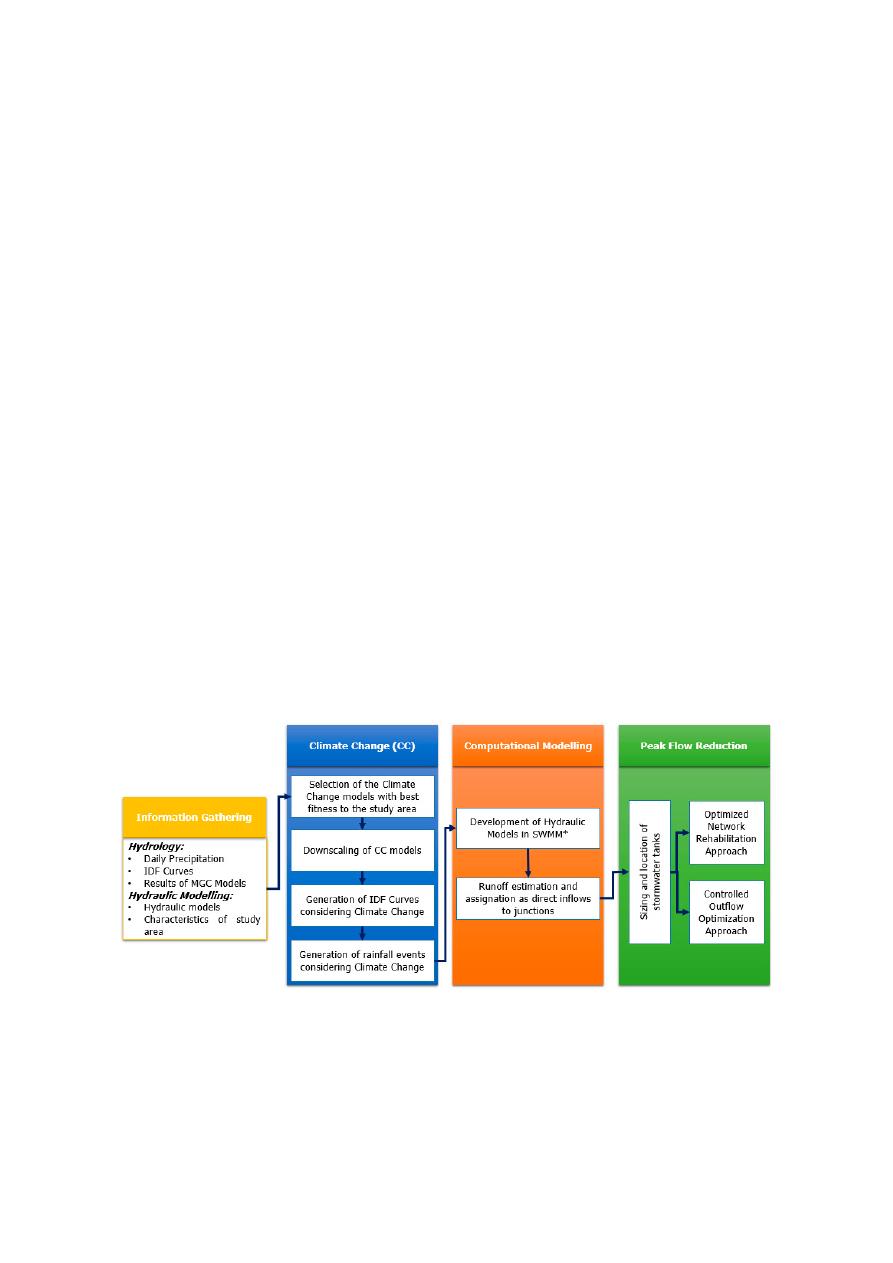
fficiency of the used algorithms. The integrated methodology
is shown in Figure
2
, incorporating all the approaches developed in the research project.
Water 2020, 12, x FOR PEER REVIEW
5 of 24
The methodology presented by this paper can be summarized as follows: First, GCMs were used
to determine the global effects of Climate Change, and then a downscaling technique was applied to
establish the local effects in the study area, located in Bogota, Colombia. Precipitation scenarios with
and without Climate Change were developed to identify the effects of this phenomenon on this
research’s analysis, with their respective comparisons. Secondly, the use of stormwater tanks was
selected as an accurate technique for peak flow reduction in this urban watershed. Consequently, two
different approaches to determine the optimal location and size of the storage units were tested,
considering several rainfall scenarios in the study area. In addition, methodologies were applied to
reduce computational times when applying these techniques to large and complex networks. Finally,
some approaches to the feasibility of implementing Real-Time Control were discussed; however, the
results of these techniques were not discussed in this paper.
2. Methodology
Existing drainage systems, originally designed with proper conditions, are not well prepared to
face new challenges, such as Climate Change, increasing urbanization processes at cities, and out-of-
capacity systems. This results in an increase in the occurrence of urban floods. However, a new
paradigm in the operation of drainage systems has appeared in order to prepare urban settlements
to address these new conditions.
Given this situation, in the scope of this research, several knowledge areas interacted to provide
new solutions to reduce urban flooding. First, a Climate Change strategy was proposed to understand
how this phenomenon will affect variables, such as precipitation and temperature, and based on this,
predict their future behavior. Once the main input of stormwater systems, the rainfall, was
determined, two different approaches were used to determine the optimal sizing and location of
storage units in order to reduce peak flows. To develop these optimization methodologies, strong
computational modeling was required to guarantee the efficiency of the used algorithms. The
integrated methodology is shown in Figure 2, incorporating all the approaches developed in the
research project.
Figure 2. General description of the methodology proposed for the optimal sizing and location of
stormwater tanks considering Climate Change.
2.1. Climate Change
Climate Change is defined as the persistent alteration of the climatological conditions in an area,
which are identified by the change in mean values or the variability of the climate during a
considerable period [7]. The effects of Climate Change on the spatial and temporal distribution of
rainfall events must be understood in order to determine the runoff that drainage systems must
evacuate during their operation. Thus, a general methodology was proposed to obtain modified
Intensity-Duration-Frequency (IDF) curves that consider Climate Change.
Figure 2.
General description of the methodology proposed for the optimal sizing and location of
stormwater tanks considering Climate Change.
2.1. Climate Change
Climate Change is defined as the persistent alteration of the climatological conditions in an
area, which are identified by the change in mean values or the variability of the climate during a
considerable period [
7
]. The e
ffects of Climate Change on the spatial and temporal distribution of
rainfall events must be understood in order to determine the runo
ff that drainage systems must
Water 2020, 12, 2491
6 of 24
evacuate during their operation. Thus, a general methodology was proposed to obtain modified
Intensity-Duration-Frequency (IDF) curves that consider Climate Change.
Firstly, the main information inputs for the proposed approach were three: Historic daily rainfall
records, the IDF curves for the study area, and the results obtained from GCMs. The information
provided by GCMs was based upon the 4 scenarios determined by the Intergovernmental Panel on
Climate Change (IPCC) in their fifth report, which depend on the increase of the radiative forcing in a
time horizon until the year 2100. These scenarios were based on four Representative Concentration
Pathways (RCP) that describe 21st-century possible settings that consider anthropogenic Greenhouse
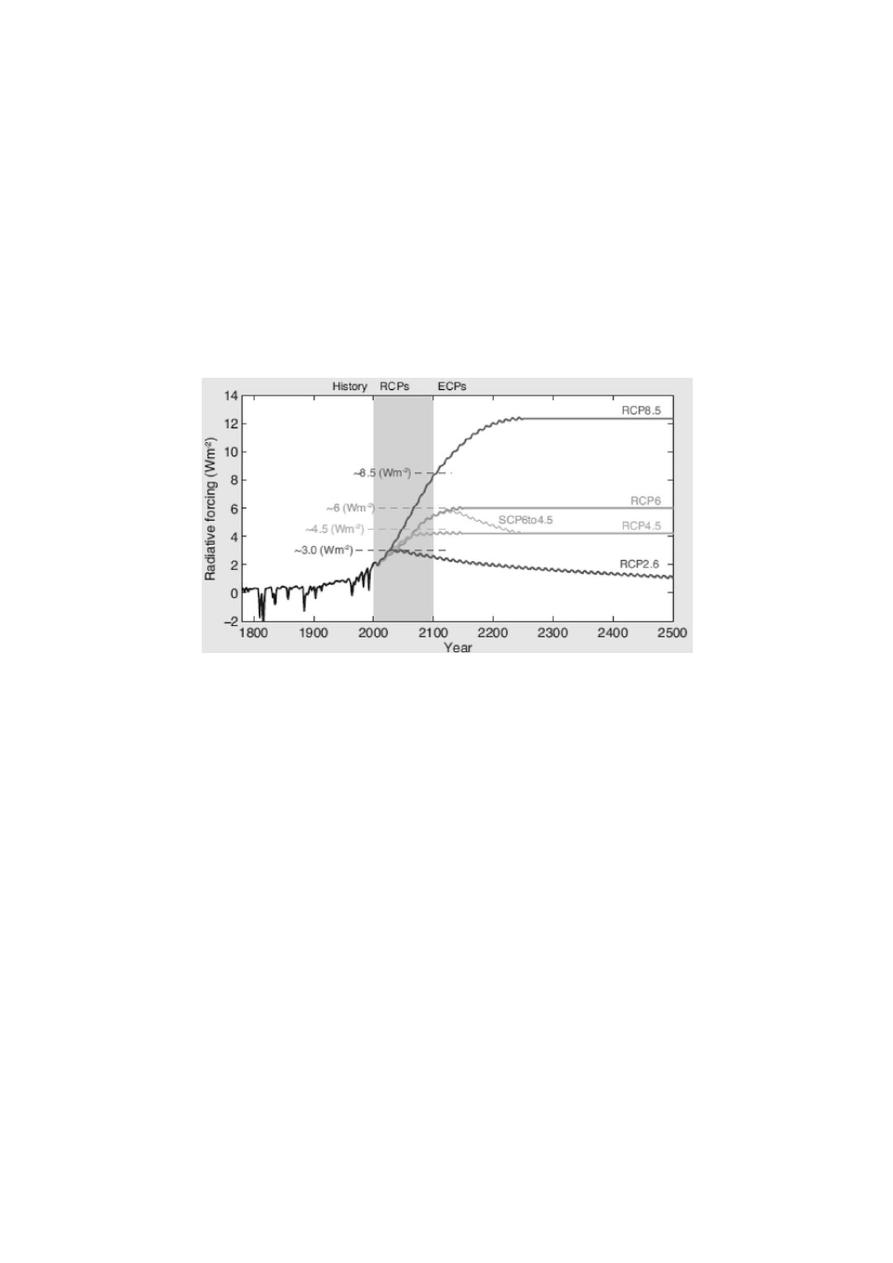
Gases (GHG) emissions, air pollutant emissions, and changes in land use. As shown in Figure
3
,
the four scenarios were RCP 2.6, which considers a rigorous mitigation scenario, RCP 4.5 and RCP 6.0,
which are intermediate scenarios, and RCP 8.5 that represents a scenario with very high emissions [
24
].
Water 2020, 12, x FOR PEER REVIEW
6 of 24
Firstly, the main information inputs for the proposed approach were three: Historic daily rainfall
records, the IDF curves for the study area, and the results obtained from GCMs. The information
provided by GCMs was based upon the 4 scenarios determined by the Intergovernmental Panel on
Climate Change (IPCC) in their fifth report, which depend on the increase of the radiative forcing in
a time horizon until the year 2100. These scenarios were based on four Representative Concentration
Pathways (RCP) that describe 21st-century possible settings that consider anthropogenic Greenhouse
Gases (GHG) emissions, air pollutant emissions, and changes in land use. As shown in Figure 3, the four
scenarios were RCP 2.6, which considers a rigorous mitigation scenario, RCP 4.5 and RCP 6.0, which are
intermediate scenarios, and RCP 8.5 that represents a scenario with very high emissions [24].
Figure 3. Representative Concentration Pathways (RCP) proposed for the 21st century based on
Greenhouse Gas (GHG) emissions [18].
For the scope of this research, scenarios RCP 4.5 and RCP 8.5 were chosen to assess the Climate
Change effects on variables, such as temperature and rainfall. Scenario RCP2.6 was not considered in
the current selection because the mitigation effort implied by this RCP is unfeasible under the current
circumstances, as it needs a sustained global CO
2
mitigation rate of around 3% per year, not a likely
prospect, at least in the near future. In summary, it was considered as a non-realistic scenario for
Climate Change. Furthermore, scenarios RCP 4.5 and RCP 6.0 presented similar results for the study
period; hence, RCP 6.0 was not considered either.
In order to obtain the IDF curves under the selected Climate Change scenarios, the daily
precipitation results were extracted from 21 Global Climate Models for the period between 1986 and
2005. This large amount of models was applied to determine which ones best reproduce the climatic
conditions in Colombia and subsequently construct the 24-h IDF curves. To accomplish this objective,
the 21 GCMs were assessed through an initial fitness evaluation using a correlation coefficient,
comparing the precipitation of each GCM and the precipitation observed in three rainfall stations
located near the study cases. The latter was done in order to determine which of the models best
represents the historical series of precipitation in the analyzed area. The rainfall stations were selected
based on their location, seeking to collect representative information on the climatic conditions of the
studied networks.
Every GCM represents the physical, chemical, and biological processes that occur on the planet
in a different way. Thus, a validation process should be done in order to select the models that best
represent the conditions of a study area [25]. Hence, the procedure performed for the validation of
the GCMs in this research obtained efficient results, considering the available information and the
climate patterns present in the study area. The monthly and quarterly correlation coefficients between
the three rainfall stations and the historical data from each model are shown in Table 1.
In this table, the models that best represent the historical information provided by each station
are highlighted. From this, it was possible to identify the models that more accurately represented a
Figure 3.
Representative Concentration Pathways (RCP) proposed for the 21st century based on
Greenhouse Gas (GHG) emissions [
18
].
For the scope of this research, scenarios RCP 4.5 and RCP 8.5 were chosen to assess the Climate
Change e
ffects on variables, such as temperature and rainfall. Scenario RCP2.6 was not considered in
the current selection because the mitigation e
ffort implied by this RCP is unfeasible under the current
circumstances, as it needs a sustained global CO
2
mitigation rate of around 3% per year, not a likely
prospect, at least in the near future. In summary, it was considered as a non-realistic scenario for
Climate Change. Furthermore, scenarios RCP 4.5 and RCP 6.0 presented similar results for the study
period; hence, RCP 6.0 was not considered either.
In order to obtain the IDF curves under the selected Climate Change scenarios, the daily
precipitation results were extracted from 21 Global Climate Models for the period between 1986
and 2005. This large amount of models was applied to determine which ones best reproduce the
climatic conditions in Colombia and subsequently construct the 24-h IDF curves. To accomplish
this objective, the 21 GCMs were assessed through an initial fitness evaluation using a correlation
coe
fficient, comparing the precipitation of each GCM and the precipitation observed in three rainfall
stations located near the study cases. The latter was done in order to determine which of the models
best represents the historical series of precipitation in the analyzed area. The rainfall stations were
selected based on their location, seeking to collect representative information on the climatic conditions
of the studied networks.
Every GCM represents the physical, chemical, and biological processes that occur on the planet
in a di
fferent way. Thus, a validation process should be done in order to select the models that best
represent the conditions of a study area [
25
]. Hence, the procedure performed for the validation of the
GCMs in this research obtained e
fficient results, considering the available information and the climate

Water 2020, 12, 2491
7 of 24
patterns present in the study area. The monthly and quarterly correlation coe
fficients between the
three rainfall stations and the historical data from each model are shown in Table
1
.
In this table, the models that best represent the historical information provided by each station
are highlighted. From this, it was possible to identify the models that more accurately represented a
certain station, and moreover, which of them presented a better performance altogether. As a result,
eleven models were selected to move forward in this analysis for the study area.
Table 1.
Monthly and quarterly correlation coe
fficients for the 21 Global Climate Models for the period
between 1986 and 2005 [
25
].
GCMs
Monthly Correlation Coe
fficients
Quarterly Correlation Coe
fficients
Station 1
Station 2
Station 3
Average
Station 1
Station 2
Station 3
Average
01_inmcm4
0.4791
0.5873
0.5836
0.5686
0.8245
0.8764
0.8342
0.8512
02_bcc-csm1-1
0.5199
0.6437
0.6516
0.6253
0.8448
0.8949
0.8691
0.8753
03_NorESM1-M
0.5413
0.6820
0.6868
0.6581
0.8340
0.8859
0.8604
0.8657
04_MRl-CGM3
0.5295
0.6826
0.6408
0.6397
0.8292
0.8805
0.8443
0.8573
05_MPl-ESM-MR
0.5663
0.6910
0.6871
0.6700
0.8571
0.9049
0.8770
0.8856
06_MPl-ESM-LR
0.5458
0.6476
0.6606
0.6382
0.8392
0.8902
0.8638
0.8702
07_MIROC5
0.6246
0.7884
0.7355
0.7419
0.8738
0.9180
0.8824
0.8976
08_MIROC-ESM
0.6128
0.7499
0.7146
0.7167
0.8805
0.9238
0.8878
0.9043
09_MIROC-ESM-CHEM
0.5911
0.7404
0.6966
0.6963
0.8823
0.9254
0.8885
0.9057
10_IPSL-CM5A-MR
0.4493
0.5802
0.6000
0.5579
1.3214
0.8735
0.8446
0.8527
11_IPSL-CM5A-LR
0.4814
0.6200
0.6081
0.5861
0.8577
0.9067
0.8568
0.8809
12_GFDL-ESM2M
0.5510
0.7107
0.6748
0.6645
0.8677
0.9135
0.8778
0.8931
13_GFDL-ESM2G
0.5047
0.6811
0.6162
0.6191
0.8224
0.8764
0.8257
0.8485
14_GFDL-CM3
0.5721
0.7130
0.7033
0.6818
0.8511
0.8990
0.8697
0.8797
15_CanESM2
0.5397
0.6797
0.6761
0.6497
0.8661
0.9122
0.8768
0.8918
16_CSIRO-Mk3-6-0
0.6968
0.7951
0.8084
0.7885
0.9055
0.9408
0.9256
0.9304
17_CNRM-CM5
0.5989
0.7349
0.7341
0.7088
0.8749
0.9173
0.8966
0.9026
18_CESM1-BGC
0.5231
0.6758
0.6656
0.6392
0.8387
0.8877
0.8624
0.8691
19_CCSM4
0.5334
0.6667
0.6757
0.6427
0.8400
0.8882
0.8684
0.8715
20_BNU-ESM
0.5715
0.6727
0.6930
0.6637
0.8609
0.9064
0.8823
0.8895
21_ACCESS1-0
0.5837
0.7166
0.7055
0.6879
0.8737
0.9182
0.8820
0.8981
As it was previously mentioned, after this initial fitness assessment, 11 models were selected
and then adjusted using a General Extreme Value (GEV) distribution, as shown in Equation (1),
where x stands for the daily precipitation considering fixed values of F(x) related to a return period.
Furthermore, k describes the form of the distribution, and
α is defined as shown in Equation (2).
F
(
x
) =
exp
−
"
j
k
(
x −
µ
)
α
#
1
k
(1)
α
=
k
λ
2
Γ
(
1
+
k
)(
1 − 2
−k
)
(2)
µ
=
λ
1
+
α
[
Γ
(
1
+
k
)
− 1
]
k
(3)
Γ
=
λ
1
λ
2
(4)
Meanwhile, the remaining parameters of GEV distribution can be estimated by using the first two
moments of an L-moments approach, as described in Equations (6) and (7), where M
i jk
corresponds to
the Probability Weighted Moments (PWM), defined as shown in Equation (5).
M
i jk
=
E
h
x
i
F
j
(
1 − F
)
k
i
(5)
λ
1
=
M
100
(6)

Water 2020, 12, 2491
8 of 24
λ
2
=
2M
110
− M
100
(7)
In order to determine the parameters of this equation, considering a historical time series for an
GCM, an L-moment approximation was used [
26
]. In this case, a daily precipitation value was obtained
using the historical data series for every GCM, considering return periods of 3, 5, 10, 25, and 50 years.
Once the parameters were estimated, the inverse form of the GEV was used for the determination
of the quantile of a specific return period, as shown in Equation (8), where
µ, α, and k are the GEV
parameters, and R
p
represents the return period for which the quantile is calculated.
x
T
=
µ
+
α
k
1 − ln
1 −
1
R
p
!
k
(8)
Once the IDF curve was built for every GCM using the later equation, it was compared with
the corresponding curve built using rainfall historical data. For this comparison, the Mean Squared
Error (MSE) was used, and based on these results, 6 models were selected, given their accurate
representation of the historical climate in Colombia, specifically for small return periods. These models
were MPI-ESM-MR [
27
], MIROC5 [
28
], GFDL-ESM2M [
29
], CSIRO-Mk3-6-0 [
30
], CNRM-CM5 [
31
]
and ACCESS1-0 [
32
].
Results from these models were extracted for a historical period (1986–2005) and a future modeling
period (2015–2039). The obtained daily series of precipitation flux (kg
/m
2
-s) were converted to
daily precipitation series (mm
/day). These results were used to calculate monthly change factors for
average precipitation, length of dry periods, and length of wet periods. These factors, as well as the
historical rainfall data, were used by LARS-WG (Long Ashton Research Station Weather Generator),
which calculated the histograms for the observed precipitation series and applied the necessary
corrections according to the change factors. From this information, a new series of daily precipitation
was created, which included the e
ffects associated with downscaling and could, therefore, be used for
the generation of future IDF curves.
The downscaling process allows the inclusion of land cover heterogeneity, topographical features,
and local feedback mechanisms in simulations. Moreover, it increases the resolution of the climate
information available for more detailed analysis. This allows the switch from Global Climate Models
to a climate analysis more focused in the study area. To accomplish this objective, there are di
fferent
methodologies, such as conditional probability-based, empirical transfer functions, and resampling
methods [
3
].
Once the future rainfall series on every meteorological station were determined, they were
interpolated using the inverse distances on the study areas. These series were adjusted to the GEV
function, shown in Equation (1). The parameters of this function were calibrated with the L-momentum
method and, once obtained, were used in the inverse form of the GEV function in Equation (8).
Rainfall intensity was determined considering a return period of 10 years and durations below
24 h, according to Colombian design guidelines [
33
]. In this context, two di
fferent approaches to assess
the e
ffects of Climate Change over the rainfall were used to incorporate the uncertainty related to the
estimation of precipitation events with short durations, like the ones studied in this research. Hence,
the approaches below were used to estimate IDF curves, which incorporate Climate Change.
First, the approach proposed by Pulgarin [
34
], described by Equation (9), was used to determine
the intensity of events with short durations based on daily precipitation data available for Colombia [
25
].
In this expression, I
24h
is the mean daily rainfall intensity (mm
/h), and T is the analyzed return period.
In addition, t is the duration of the analyzed event, and I
60
is the intensity for a rainfall event with a
duration of less than one hour.
I
T
t
=
([
0.88I
24h
− 0.004
] + [
0.12I
24h
0.5772
− ln
[
− ln
(
1 −
(
1
T
))]])
×
(
t
1440
)
−0.829
i f t ≥ 60
I
60
×
0.54t
0.25
0.50
i f t
< 60
(9)

Water 2020, 12, 2491
9 of 24
The second approach, described in Equation (10), was proposed by CIACUA (Water Supply and
Sewer Systems Research Center, in Spanish Centro de Investigaciones en Acueductos y Alcantarillados)
to determine the intensity of precipitation with short duration [
18
]. In this expression,
α, B, and n are
parameters that are calibrated using real IDF curves for each study area; thus, they indirectly consider
the return period.
I
t
I
T
=
α
t
T
+
B
n
(10)
Finally, the instantaneous intensity method was used for the determination of precipitation
hyetograph for a specific event. Therefore, this information was key to the development of the other
research areas of the project.
2.2. Techniques for Peak Flow Reduction in Urban Drainage Systems
Peak flow reduction in urban drainage systems can be accomplished through the installation
of di
fferent structural solutions, such as stormwater tanks, green roofs, and infiltration swales,
among others. However, this study was focused on the use of storage units due to their e
ffectivity in
the reduction of urban flooding in comparison with the other techniques.
Hence, the section below describes two di
fferent approaches to determine the optimal location
and sizing of these stormwater tanks, modeled at this stage of the research as underground
rectangular-shaped structures, with vertical-isolated walls that do not allow infiltration to occur [
15
].
The first methodology consisted of a holistic approach, where the flood reduction was considered
within a rehabilitation process of drainage networks. On the other hand, the second methodology
consisted of an approach that considered the outlet structures of the tanks as part of the decision model.
These approaches led to the development of the computational software OptiTank and OptSU in
the scope of the research project Urban Drainage and Climate Change: Towards the Stormwater Systems
of the Future at the Polytechnic University of Valencia and the University of Coimbra, respectively.
The latter was based on a Pseudo-Genetic Algorithm (PGA) and Simulated Annealing, correspondingly,
implementing the methodologies described below.
2.2.1. Optimized Network Rehabilitation Approach
There are several methodologies to approach the location and sizing of storm tanks in an
optimized network rehabilitation process that has been proposed by several authors in recent years.
First, a multi-objective optimization algorithm based on the NSGA-II (Non-dominated Sorting Genetic
Algorithm II) is used for the rehabilitation of urban drainage networks through the substitution
of pipes and the installation of storage tanks [
8
]. In addition, a cost-optimization method and
a pseudo-genetic heuristic algorithm could be used to tackle the issue e
fficiently [
15
]. Moreover,
copula-based multi-objective optimization models provide a range of cost-e
ffective rehabilitation
possibilities, leading to an improvement in the overflow issues in the network [
35
]. All of them
represent valuable alternatives to address the problem described, and, therefore, they were part of the
process of development of the first approach proposed in the analysis.
The first approach considered in this research for the reduction of peak flows sought to determine
the optimal number, size, and location of stormwater tanks required to control urban flooding, without
determining the size of the outlet of the structure. Although this approach considered the rehabilitation
of the whole drainage network, including pipes’ renovation, in this research, the scope was limited
to the use of retention tanks to reduce urban flooding. Thus, the decision variables considered by
this model were the storage volume at each node and the total number of tanks implemented in the
drainage network [
18
].
Hence, this approach was accomplished through an optimization model based on the minimization
of the objective function shown in Equation (11), which involves capital costs of storage tanks,
the renovation of pipes, and some penalties if water levels in conduits are exceeded [
19
].

Water 2020, 12, 2491
10 of 24
min
λ
1
N
X
i=1
C
(
V
I
(
i
)) +
λ
2
N
0
X
i=1
C
(
V
DR
(
i
)) +
λ
3
M
X
i=1
C
(
D
N
(
i
))
L
i
+
λ
4
M
X
i=1
C
(
V
max
(
i
))
(11)
In the equation above, the first term is related to the costs of the flooding volume at the i-th
node C
(
V
I
(
i
))
, described by Equation (12). In this expression, K
I
is a coe
fficient for determining the
allowable flooding in the system: Using a low K
I
, the occurrence of more floods is allowed. In addition,
the flooding costs are represented by a fourth-order polynomial, depending on the maximum level of
water reached by the flooding event y
i
, and parameters A, B, C, and D are calibrated for the study area.
N is the total number of nodes in the system.
C
(
V
I
(
i
)) =
K
I
N
X
i=1
V
I(i)
=
K
I
N
X
i=1
Ay
4
i
+
By
3
i
+
Cy
2
i
+
Dy
i
(12)
The second term considers the capital costs associated with the construction or the expansion of
the volume of the storage unit located at the i-th node C
(
V
DR
(
i
))
, whether the tank was new or existed
before the analysis. This term is described by Equation (13), where V
i
represents the volume of the ith
stormwater tank, while
τ
A
,
τ
B
, and
τ
C
are coe
fficients adjusted to the characteristics of the study area.
C
(
V
DR
(
i
)) =
τ
A
+
τ
B
V
τ
C
i
(13)
The third term represents the renovation costs C
(
D
N
(
i
))
for the M pipes, where L
i
stands for the
length of the ith pipe, and the fourth term considers the maximum volume of water contained inside
the M pipes of the system. The last term can be considered as a penalty function if the capacity of the
pipes C
(
V
max
(
i
))
is limited. As previously described, in this research, the last two terms were ignored,
given that the research was focused only on the use of stormwater tanks rather than also using pipes to
storage water.
Besides, this objective function includes four weight parameters
λ
i
, which are used to represent
the preferences of the decision-maker regarding the importance of the terms in the equation, varying
between 0 and 1. Moreover, these parameters can be used to either include or ignore any of the terms,
depending on the purpose of the research [
19
]. In this case, the weight parameters corresponding to
the last two terms of the equation would be 0, in order to not consider them in the analysis.
The solution method for this approach was based on a Pseudo-Genetic Algorithm (PGA) and
was characterized by the coding of chromosomes through integer coding, meaning that each decision
variable is represented by only one gene [
36
]. This variation allows special characteristics to the
definition of mutation and crossover operations. Hence, a computer program known as OptiTank was
developed, using Visual Studio, and connected to the SWMM solver through the SWMM toolkit [
14
],
facilitating the hydraulic assessment of the di
fferent solutions tested by the algorithm.
To validate this approach, it is necessary to simulate the drainage networks considering di
fferent
scenarios in order to establish the sensitivity of each input parameter that will be used in the solution
of the PGA. Thereby, a set of parameters that are more sensitive in the determination of the location
and sizing of the storage units in the network could be determined [
37
].
2.2.2. Controlled Outflow Optimization Approach
Multiple optimization models have been proposed for planning and integrating the location and
sizing of storage units within the sewer drainage system, considering the sewer system’s hydraulic
behavior. An approach using Particle Swarm Optimization has provided the management of combined
sewer overflow spills in the location and sizing of the storage tanks process [
38
]. Alternatively, the use
of Genetic Algorithms to address this problem has also been presented as a feasible alternative [
16
].
Other modern heuristics applied to determine the optimal location and sizing of storage facilities have
been developed as decision models at a watershed-level, embedding river basin-related problems

Water 2020, 12, 2491
11 of 24
into commercial basin simulation models [
39
]. Based on the previously presented studies, the second
methodology described below was proposed.
The second approach analyzed in this research sought to determine the optimal location and sizing
of stormwater storage tanks, including their outflow control elements, within a drainage network to
reduce flooding by cutting peak flows [
40
].
Therefore, this approach was considered as a controlled outflow optimization approach, which was
characterized by the hydraulic control that the outlet structure of the stormwater tanks executes over
the flow. In other words, in this optimization model, the diameter of the outlet orifice of the storage
unit was considered as a decision variable, besides the storage volume for each potential stormwater
tank. The potential locations of the structures were determined as a result of an initial assessment of the
floods that occurred in the study area, combined with other factors, such as space availability and land
use. Subsequently, this decision model is considered a set of hydraulic, legislative, and operational
constraints that should be met to determine the feasibility of a solution.
The decision model described above can be formulated as follows [
40
]: The objective function,
shown in Equation (14), was oriented to the minimization of the volumes of water related to urban
flooding and the storage tanks for peak flow reduction. In this equation, N
u
is the set of possible nodes
becoming storage units, N is the set of all nodes, V
j
is the storage volume of the stormwater tank at the
node j, V
i
Surch
is the local surcharged volume of water at node i, and
θ is a weight factor.
min
X
j∈N
u
V
j
+
θ
X
i∈N
V
Surch
i
(14)
In the objective function described above, the volume of every tank was assessed depending on
the inlet and outlet flow to the storage unit. If the inlet flow was higher than the outlet, the water
would be stored in the unit. Thus, this volume was defined as the required storage volume at each
node resulting from a mass balance, as shown in Equation (15), assessed by SWMM. In this expression,
Q
in f
j
and Q
out
j
are defined as the inlet and outlet flow, correspondingly to the stormwater tank located
at junction j.
V
j
=
f
Q
in f
j
, Q
out
j
, j ∈ N
u
(15)
The constraints of the proposed optimization model for the optimal location and sizing of the
storage units with controlled outflow, considering the capacity of the tanks, among other factors,
are explained below. The first group of constraints establishes the limits of flooding, in terms of the
allowed volumes of water that can occur at the study area (Equation (16)) and at each node (Equation
(17)). In this case, V
Surch
i
is the local flooding volume at node i, while V
Surch
max
stands for the allowable
flooding, which can be defined by decision-makers.
X
i∈N
V
Surch
i
Q
in f
j
,
φ
j
≤ V
Surch
max
, j ∈ N
u
(16)
V
Surch
i
Q
in f
j
,
φ
j
≤ V
Surch
max,i
, i ∈ N, j ∈ N
u
(17)
In regards to the general model for this optimization problem, its constraints are described by
Equations (18) and (25). Equation (18) sets the maximum number of storage units (NSU) that can be
implemented in the drainage network, where y
j
represents a binary variable, indicating whether if
there is a stormwater tank at node j (1) or not (0). Meanwhile, Equations (19) and (20) establish the
maximum (V
max, j
) and minimum (V
min, j
) volumes of the stormwater tanks at node j, and Equations
(21) and (22) specifies the maximum (
φ
max,j
) and minimum (
φ
min,j
) diameters of the outlet orifices.
X
jN
u
y
j
≤ NSU
(18)

Water 2020, 12, 2491
12 of 24
V
j
≥ V
min, j
·y
j
, j ∈ N
u
(19)
V
j
≤ V
max, j
·y
j
, j ∈ N
u
(20)
φ
j
≥
φ
min,j
·y
j
, j ∈ N
u
(21)
φ
j
≤
φ
max,j
·y
j
, j ∈ N
u
(22)
The outflow of the network can be defined by a maximum value (Q
Out
max
), as shown in Equation
(23). Finally, the constraints, shown in Equations (24) and (25), establish the domain of the decision
variables involved in the optimization model.
Q
out
≤ Q
Out
max
·y
j
, j ∈ N
u
(23)
y
j
∈ {0, 1}, j ∈ N
u
(24)
V
Surch
i
≥ 0, i ∈ N
(25)
The solution method used for the addressed optimization problem was the Simulated Annealing
Algorithm, which emulates the annealing process in metallurgical processes, considering the heating
and, subsequently, the slow cooling of a piece of metal in a controlled way to enhance its structural
properties [
40
,
41
]. In this approach, a computer program known as OptSU was developed using Visual
Basic, and it was connected to SWMM hydraulic solver using the SWMM toolkit. This connection
allowed the assessment of the di
fferent solutions generated by the algorithm, which were implemented
due to its accessibility to the network data.
2.3. Computational Modeling
2.3.1. SWMM Toolkit
SWMM is a dynamic model for hydraulic and hydrological simulation developed by the United
States Environmental Protection Agency (USEPA). Due to the capabilities of this model in the simulation
of stormwater and wastewater drainage systems, it was selected as the hydraulic engine for this study.
However, in the scope of optimization, an e
fficient interaction was required between an optimizer
and the specialized software, i.e., SWMM, to perform several executions of the models in a reduced
amount of time.
Given the scope of this research project, the need for a link between the optimization techniques
and the hydraulic software was clearly identified, leading to the development of the SWMM toolkit.
A similar approach has been widely used in the optimization of water distribution systems, where the
software EPANET is used to simulate these systems [
42
]. In this case, USEPA provides an EPANET
toolkit with similar functions to set parameters in the network, as well as getting results by calling them
from routines written in languages like Visual Basic or MATLAB, without using the EPANET’s user
interface. Moreover, several authors have modified the EPANET’s toolkit to incorporate functions that
were not previously included, as well as modified the software itself internally to fit it into their specific
needs [
19
]. In regards to drainage systems, Del Giudice and Padulano developed an application to
calibrate and perform a sensitivity analysis of the hydrologic and hydraulic parameters typical in
drainage systems. In their approach, they combined SWMM with the optimizer GANetXL, connecting
them through the SWMM dynamic library (swmm5.dll) [
43
].
Hence, in the case of SWMM, USEPA provided a set of 9 functions that allow the execution of a
simulation from an external application, where the topology and other characteristics of the study
networks were previously defined. In this framework, these tools were adapted and extended to a total
of 22 functions, resulting in a Dynamic Link Library (DLL) of functions called the SWMM toolkit [
14
].
The functions developed in the SWMM toolkit included the Get Functions, for retrieving information
from the project or the results, and the Set Functions, which includes all the modification functions.
Water 2020, 12, 2491
13 of 24
As a result, the developed toolkit allowed the execution of simulations without interacting
with the user’s interface, the modification of some topological and hydraulic properties within the
network, and the management of results, in a reduced amount of time. Thus, the main benefit of this
toolkit was related to the e
fficient execution of optimization techniques, such as heuristic algorithms,
because it allows the direct connection between the optimizer and the hydraulic simulator [
14
].
Hence, it was widely used in OptSU and OptiTank, which were the resulting software of this project,
as previously mentioned.
The development of this tool represented one of the most important and innovative products
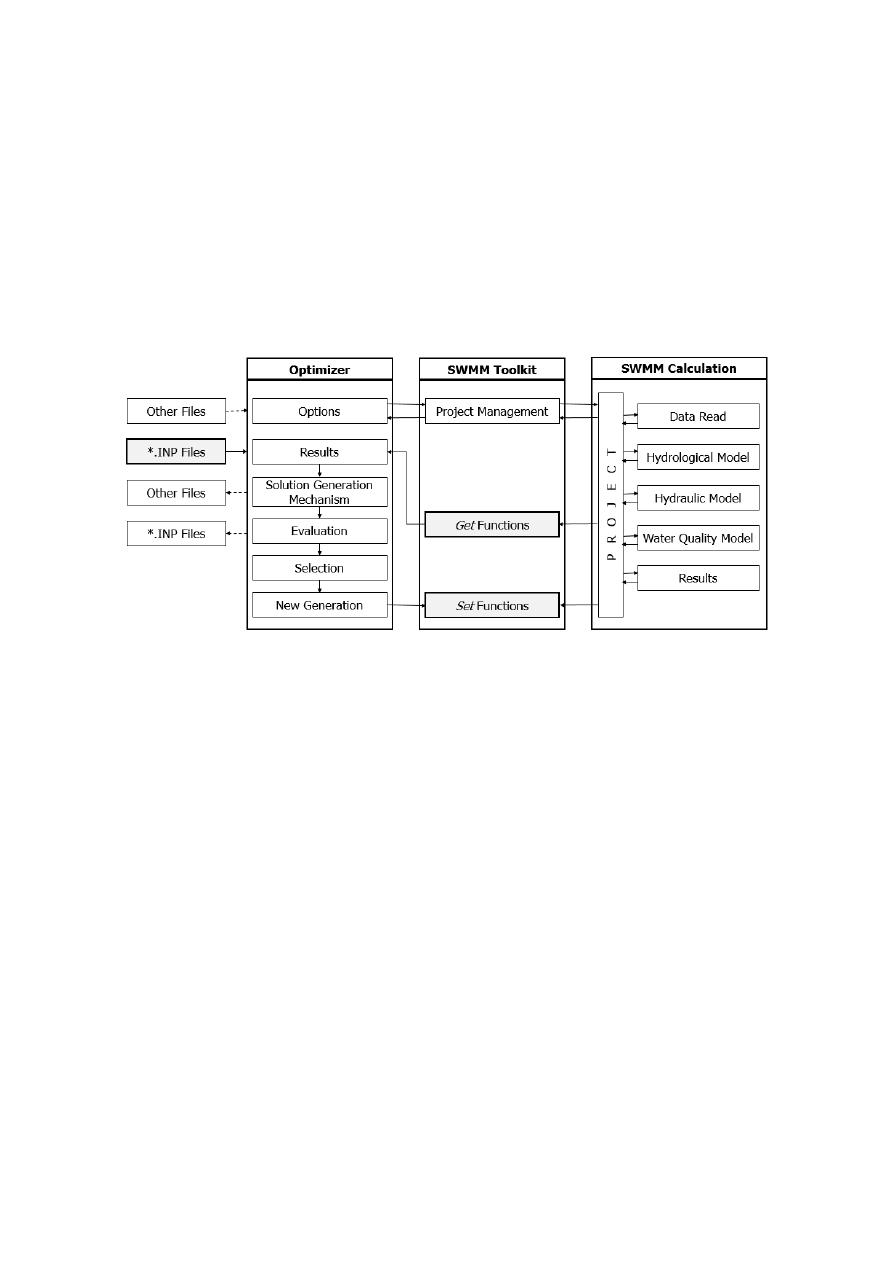
resulting from this research project at its early stage. The interface between the SWMM toolkit and an
optimizer is shown in Figure
4
.
Water 2020, 12, x FOR PEER REVIEW
13 of 24
Hence, it was widely used in OptSU and OptiTank, which were the resulting software of this project,
as previously mentioned.
The development of this tool represented one of the most important and innovative products
resulting from this research project at its early stage. The interface between the SWMM toolkit and
an optimizer is shown in Figure 4.
Figure 4. Interface scheme between an optimizer and SWMM toolkit [44]. In the figure, *.INP should
be replaces by the name of the input file.
Finally, based on the communication between any programming language and the SWMM
calculation engine through the toolkit, a wide range of applications can be performed related to the
analysis of drainage systems. Some examples of these applications are the optimal sizing of the
system itself, the assessment of operational modifications, such as the stormwater tanks, referred
during this research, the implementation of Real-Time Control activities, among others.
2.3.2. Reduction of Simulation Times for Optimization Purposes
The solutions reached for peak flow reduction in drainage systems must be efficient in terms of
their quality as well as the computational time they require based on the complexity of the proposed
optimization algorithms and the size of the drainage networks. Therefore, a reduction of the
simulation times was an important aspect to consider during this research.
In an attempt to reduce the computational efforts of the hydraulic simulations, two approaches
were implemented and tested using three theoretical networks prior to applying them in the case
studies presented in this paper. These approaches consisted of [44]:
1.
Development and use of a new toolkit: In this approach, the SWMM toolkit developed under the
scope of this research was used in the hydraulic execution of the network without using the
software’s graphical user interface. As a result, a significant reduction of computational times was
accomplished during the optimization phase.
2.
Rainfall-runoff model: The execution of the runoff model in every simulation could represent long
computational times. Therefore, the proposed approach consisted of replacing this process by a
direct inflow at each junction, representing the runoff flows as a time series. As a result, the runoff
model was executed just one time during an optimization procedure, leading to reduced
computational times of the entire optimization procedure.
Based on the results of the tests performed in the theoretical networks, available in [19], the
feasibility of performing a considerable time reduction by applying the latter techniques was
confirmed. Hence, before the application of the proposed optimization procedures to the case studies
described below, the rainfall-runoff model was executed once, and then it was replaced by direct
inflows at each junction. In regards to the SWMM toolkit, it was used as a central element in the
Figure 4.
Interface scheme between an optimizer and SWMM toolkit [
44
]. In the figure, *.INP should
be replaces by the name of the input file.
Finally, based on the communication between any programming language and the SWMM
calculation engine through the toolkit, a wide range of applications can be performed related to the
analysis of drainage systems. Some examples of these applications are the optimal sizing of the system
itself, the assessment of operational modifications, such as the stormwater tanks, referred during this
research, the implementation of Real-Time Control activities, among others.
2.3.2. Reduction of Simulation Times for Optimization Purposes
The solutions reached for peak flow reduction in drainage systems must be e
fficient in terms of
their quality as well as the computational time they require based on the complexity of the proposed
optimization algorithms and the size of the drainage networks. Therefore, a reduction of the simulation
times was an important aspect to consider during this research.
In an attempt to reduce the computational e
fforts of the hydraulic simulations, two approaches
were implemented and tested using three theoretical networks prior to applying them in the case
studies presented in this paper. These approaches consisted of [
44
]:
1.
Development and use of a new toolkit: In this approach, the SWMM toolkit developed under
the scope of this research was used in the hydraulic execution of the network without using the
software’s graphical user interface. As a result, a significant reduction of computational times
was accomplished during the optimization phase.
2.
Rainfall-runo
ff model: The execution of the runoff model in every simulation could represent
long computational times. Therefore, the proposed approach consisted of replacing this process
by a direct inflow at each junction, representing the runo
ff flows as a time series. As a result,

Water 2020, 12, 2491
14 of 24
the runo
ff model was executed just one time during an optimization procedure, leading to reduced
computational times of the entire optimization procedure.
Based on the results of the tests performed in the theoretical networks, available in [
19
],
the feasibility of performing a considerable time reduction by applying the latter techniques was
confirmed. Hence, before the application of the proposed optimization procedures to the case studies
described below, the rainfall-runo
ff model was executed once, and then it was replaced by direct
inflows at each junction. In regards to the SWMM toolkit, it was used as a central element in the
development of OptSU and OptiTank, given the connection it o
ffers between the optimizers and the
hydraulic simulation software. These two approaches were implemented simultaneously in the case
studies presented in this paper.
3. Case Studies
Two di
fferent stormwater drainage networks were used to test the methodologies described above
for the reduction of peak flows using storage units. For the generation of inflows, the rainfall-runo
ff
model proposed by the Soil Conservation Service was used, based on the curve number method.
The application of this model relied on the fact that the available information was adequate for
its implementation. This model was included in the implemented SWMM toolkit [
20
]. Besides,
two di
fferent rainfall scenarios were tested as the hydrological input for each network: The first one
considering the actual hyetographs used by the water utility in Bogota, Colombia, and the second one
modifying them by considering Climate Change e
ffects.
The developed OptSU and OptiTank were used for the optimal sizing of the stormwater tanks.
Hence, given that they rely on volume calculations, the parameters
τ
A
,
τ
B
, and
τ
C
were assigned
the values of 16,923, 318.4, and 0.5, respectively, through Equation (12). Regarding the Simulated
Annealing used in OptSU, a set of parameters calibrated at Coimbra University was used, which were
assigned the values as follows: α
= 0.2, λ = 30, γ = 0.8, and σ = 15 [
40
]. The aforementioned parameters
were established as constants in both study cases, and the other parameters mentioned throughout the
study were calibrated during the analysis.
In this case, water distribution and sewerage systems in the city have been managed by the public
company Water Supply and Sewerage Utility of Bogota (Empresa de Acueducto y Alcantarillado de
Bogota—EAB) for more than 130 years. Based on their experience, some of the floods shown below
were identified as areas of interest in the system. However, this information was provided by the
public company and was not extracted from any particular model.
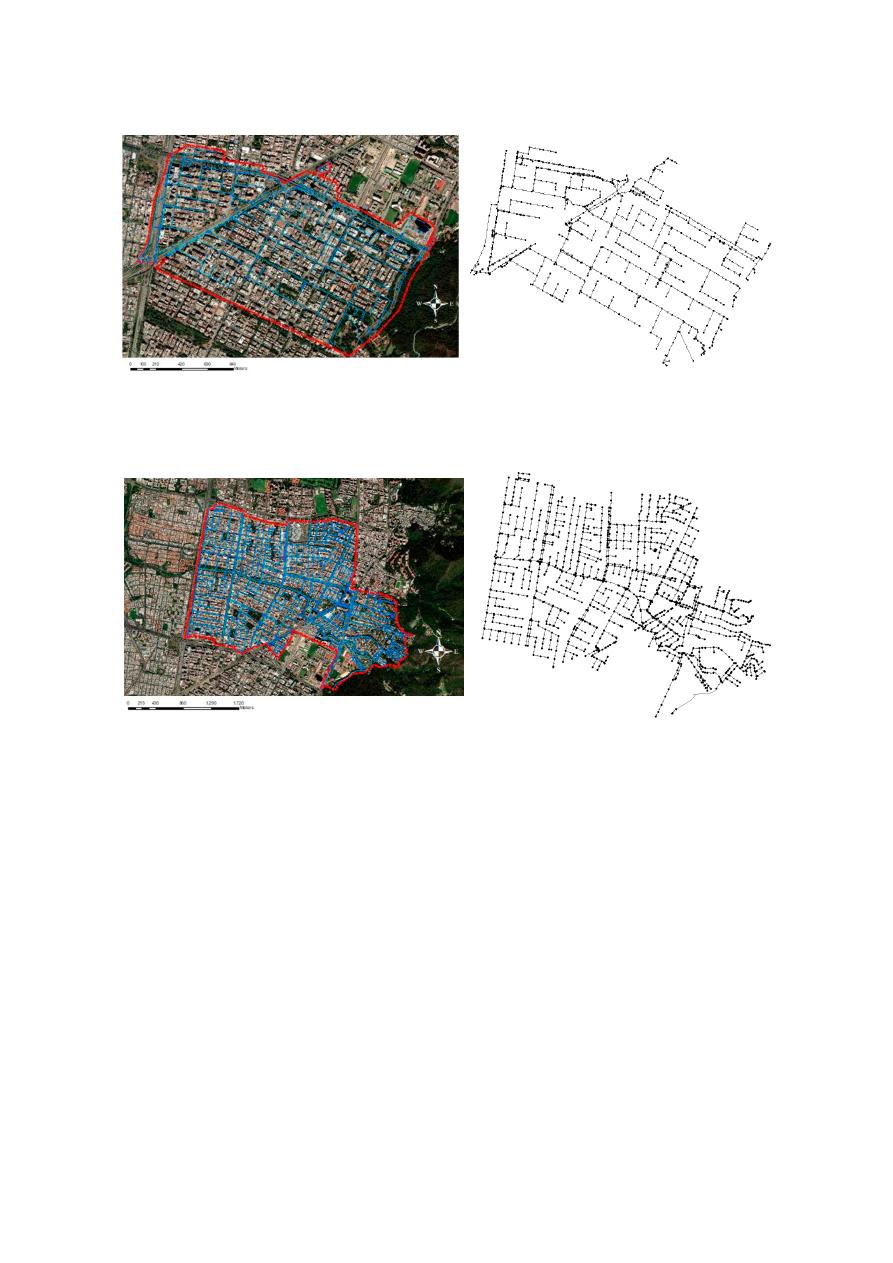
3.1. Southern Chicó Network
The first network is part of Bogota’s (Colombia) full stormwater network, located in the northern
part of the city, and managed by EAB Water Utility. It is composed of 509 nodes, 510 conduits (including
pipes and open channels), and one outfall. The ground elevation of the network ranges between
2548.51 and 2588.29 m above sea level. The general layout of the network and the SWMM model are
shown in Figure
5
.
The second network is also part of Bogota’s (Colombia) full stormwater network and is located
adjacent to the Southern Chicó network. It is composed of 1292 nodes, 1293 conduits (including pipes
and open channels), and one outfall. The general layout of the network and the SWMM model are
shown in Figure
6
.
Water 2020, 12, 2491
15 of 24
Water 2020, 12, x FOR PEER REVIEW
14 of 24
development of OptSU and OptiTank, given the connection it offers between the optimizers and the
hydraulic simulation software. These two approaches were implemented simultaneously in the case
studies presented in this paper.
3. Case Studies
Two different stormwater drainage networks were used to test the methodologies described
above for the reduction of peak flows using storage units. For the generation of inflows, the rainfall-
runoff model proposed by the Soil Conservation Service was used, based on the curve number
method. The application of this model relied on the fact that the available information was adequate
for its implementation. This model was included in the implemented SWMM toolkit [20]. Besides,
two different rainfall scenarios were tested as the hydrological input for each network: The first one
considering the actual hyetographs used by the water utility in Bogota, Colombia, and the second
one modifying them by considering Climate Change effects.
The developed OptSU and OptiTank were used for the optimal sizing of the stormwater tanks.
Hence, given that they rely on volume calculations, the parameters 𝜏 , 𝜏 , and 𝜏 were assigned the
values of 16,923, 318.4, and 0.5, respectively, through Equation (12). Regarding the Simulated
Annealing used in OptSU, a set of parameters calibrated at Coimbra University was used, which were
assigned the values as follows: α = 0.2, λ = 30, γ = 0.8, and σ = 15 [40]. The aforementioned parameters
were established as constants in both study cases, and the other parameters mentioned throughout
the study were calibrated during the analysis.
In this case, water distribution and sewerage systems in the city have been managed by the
public company Water Supply and Sewerage Utility of Bogota (Empresa de Acueducto y
Alcantarillado de Bogota—EAB) for more than 130 years. Based on their experience, some of the
floods shown below were identified as areas of interest in the system. However, this information was
provided by the public company and was not extracted from any particular model.
3.1. Southern Chicó Network
The first network is part of Bogota’s (Colombia) full stormwater network, located in the northern
part of the city, and managed by EAB Water Utility. It is composed of 509 nodes, 510 conduits
(including pipes and open channels), and one outfall. The ground elevation of the network ranges
between 2548.51 and 2588.29 m above sea level. The general layout of the network and the SWMM
model are shown in Figure 5.
(a) (b)
Figure 5. (a) Location of Southern Chicó Network. (b) Storm Water Management Model (SWMM) for
Southern Chicó Network.3.2. Northern Chicó Network.
Figure 5.
(a) Location of Southern Chicó Network. (b) Storm Water Management Model (SWMM) for
Southern Chicó Network.3.2. Northern Chicó Network.
Water 2020, 12, x FOR PEER REVIEW
15 of 24
The second network is also part of Bogota’s (Colombia) full stormwater network and is located
adjacent to the Southern Chicó network. It is composed of 1292 nodes, 1293 conduits (including pipes
and open channels), and one outfall. The general layout of the network and the SWMM model are
shown in Figure 6.
(a) (b)
Figure 6. (a) Location of Northern Chicó Network. (b) SWMM for Northern Chicó Network.
3.2. Rainfall Scenarios for Case Studies
Based on three meteorological stations located near the area of study, the different hyetographs
used in this research were determined. First, the historical precipitation series of these three stations
were obtained, as well as the IDF curves that the local water utility has determined for this location.
Once the GCM validation process was carried out, it was established that the model that best
described the rainfall in the study area was CSIRO-MK3-6-0. After the corresponding projections and
downscaling processes were executed, synthetic IDF curves were used to determine the three rainfall
scenarios shown below: Current rainfall scenario provided by the water utility, a Climate Change
scenario determined using the equation proposed by Pulgarin [34] (Equation (3)), and an additional
Climate Change scenario considering the equation proposed by CIACUA [45] (Equation (4)).
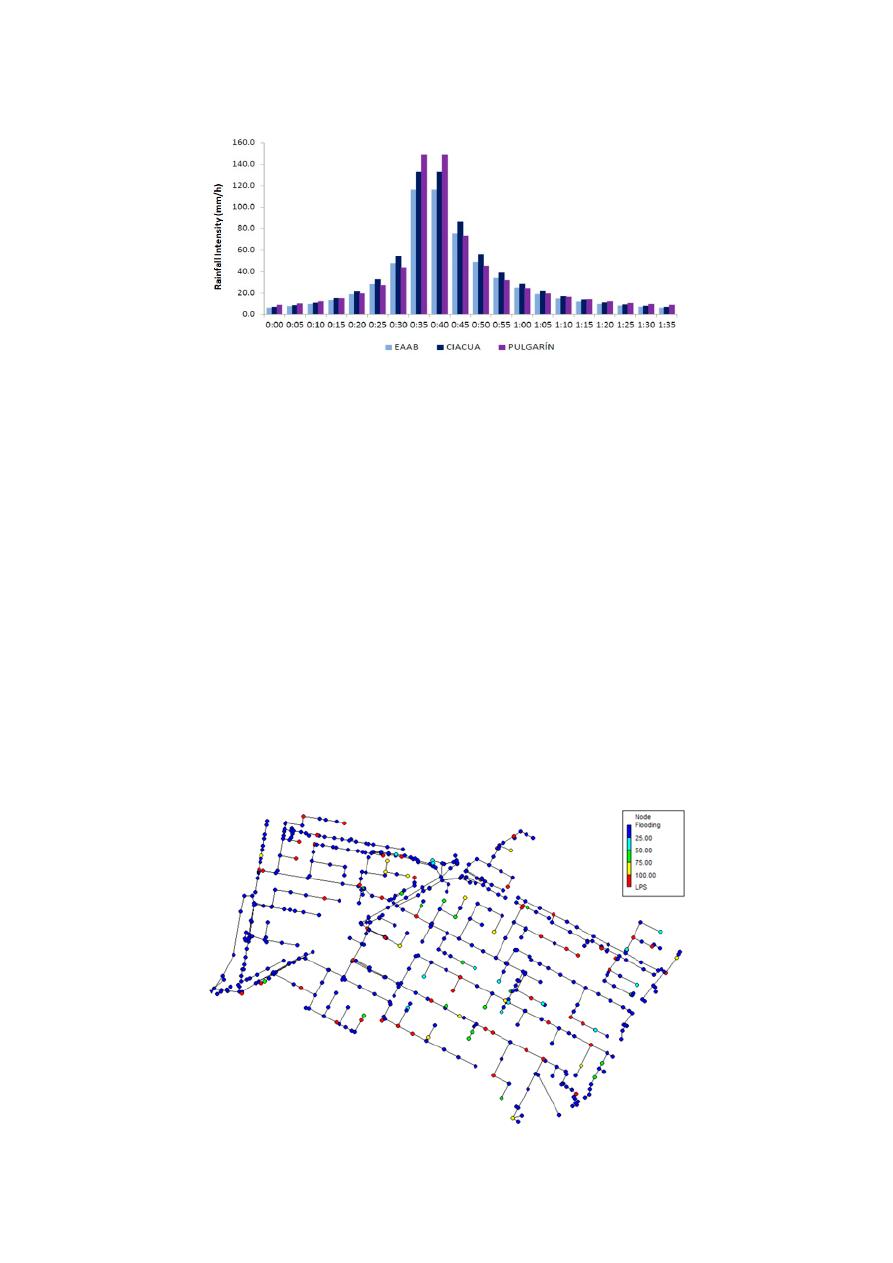
A typical hyetograph is shown in Figure 7, considering the three scenarios described above. For
the modeling of the spatial distribution of rainfall along the catchments, five different hyetographs
were used in the Southern Chicó network, and eight for Northern Chicó Network. In all the obtained
hyetographs, a tendency was identified. The equation proposed by Pulgarin [34] tends to have higher
rainfall intensities within the three scenarios considered.
Time (Minutes)
Figure 6.
(a) Location of Northern Chicó Network. (b) SWMM for Northern Chicó Network.
3.2. Rainfall Scenarios for Case Studies
Based on three meteorological stations located near the area of study, the di
fferent hyetographs
used in this research were determined. First, the historical precipitation series of these three stations
were obtained, as well as the IDF curves that the local water utility has determined for this location.
Once the GCM validation process was carried out, it was established that the model that best described
the rainfall in the study area was CSIRO-MK3-6-0. After the corresponding projections and downscaling
processes were executed, synthetic IDF curves were used to determine the three rainfall scenarios
shown below: Current rainfall scenario provided by the water utility, a Climate Change scenario
determined using the equation proposed by Pulgarin [
34
] (Equation (3)), and an additional Climate
Change scenario considering the equation proposed by CIACUA [
45
] (Equation (4)).
A typical hyetograph is shown in Figure
7
, considering the three scenarios described above.
For the modeling of the spatial distribution of rainfall along the catchments, five di
fferent hyetographs
were used in the Southern Chicó network, and eight for Northern Chicó Network. In all the obtained
hyetographs, a tendency was identified. The equation proposed by Pulgarin [
34
] tends to have higher
rainfall intensities within the three scenarios considered.
Water 2020, 12, 2491
16 of 24
Water 2020, 12, x FOR PEER REVIEW
15 of 24
The second network is also part of Bogota’s (Colombia) full stormwater network and is located
adjacent to the Southern Chicó network. It is composed of 1292 nodes, 1293 conduits (including pipes
and open channels), and one outfall. The general layout of the network and the SWMM model are
shown in Figure 6.
(a) (b)
Figure 6. (a) Location of Northern Chicó Network. (b) SWMM for Northern Chicó Network.
3.2. Rainfall Scenarios for Case Studies
Based on three meteorological stations located near the area of study, the different hyetographs
used in this research were determined. First, the historical precipitation series of these three stations
were obtained, as well as the IDF curves that the local water utility has determined for this location.
Once the GCM validation process was carried out, it was established that the model that best
described the rainfall in the study area was CSIRO-MK3-6-0. After the corresponding projections and
downscaling processes were executed, synthetic IDF curves were used to determine the three rainfall
scenarios shown below: Current rainfall scenario provided by the water utility, a Climate Change
scenario determined using the equation proposed by Pulgarin [34] (Equation (3)), and an additional
Climate Change scenario considering the equation proposed by CIACUA [45] (Equation (4)).
A typical hyetograph is shown in Figure 7, considering the three scenarios described above. For
the modeling of the spatial distribution of rainfall along the catchments, five different hyetographs
were used in the Southern Chicó network, and eight for Northern Chicó Network. In all the obtained
hyetographs, a tendency was identified. The equation proposed by Pulgarin [34] tends to have higher
rainfall intensities within the three scenarios considered.
Time (Minutes)
Figure 7.
Synthetic hyetographs, considering three rainfall scenarios: Current rainfall scenario, Climate
Change by Pulgarin equation, and Climate Change by CIACUA equation.
4. Results and Discussion
4.1. Southern Chicó Network
4.1.1. Initial Assessment of the Network
An initial assessment of the hydraulic state of the Southern Chicó Network was performed prior
to the application of the optimization procedures to obtain a wider perspective on whether flooding
occurs, identify the potential sites for the location of stormwater tanks, among other considerations.
This initial assessment was performed considering a Climate Change scenario, where flooding is
most likely to occur, resulting in a flooding volume of 42,247 m
3
for the analyzed event. In this case,
the CIACUA approach was used, despite the fact that both approaches reach a similar configuration
for flooding events. The floods were identified as problem points with the assistance of Bogotá’s Water
Utility, Empresa de Acueducto y Alcantarillado de Bogota—EAB, i.e., this information was provided
by the public company and was not extracted from any particular model.
As a result, the areas of the study network that are most likely to surcharge are shown in Figure
8
,
where nodes in red presented the highest flooding volumes at the most critical time after the rainfall
occurred, followed by nodes in yellow, green, and cyan.
Water 2020, 12, x FOR PEER REVIEW
16 of 24
Figure 7. Synthetic hyetographs, considering three rainfall scenarios: Current rainfall scenario,
Climate Change by Pulgarin equation, and Climate Change by CIACUA equation.
4. Results and Discussion
4.1. Southern Chicó Network
4.1.1. Initial Assessment of the Network
An initial assessment of the hydraulic state of the Southern Chicó Network was performed prior
to the application of the optimization procedures to obtain a wider perspective on whether flooding
occurs, identify the potential sites for the location of stormwater tanks, among other considerations.
This initial assessment was performed considering a Climate Change scenario, where flooding
is most likely to occur, resulting in a flooding volume of 42,247 m
3
for the analyzed event. In this case,
the CIACUA approach was used, despite the fact that both approaches reach a similar configuration
for flooding events. The floods were identified as problem points with the assistance of Bogotá’s
Water Utility, Empresa de Acueducto y Alcantarillado de Bogota—EAB, i.e., this information was
provided by the public company and was not extracted from any particular model.
As a result, the areas of the study network that are most likely to surcharge are shown in Figure
8, where nodes in red presented the highest flooding volumes at the most critical time after the rainfall
occurred, followed by nodes in yellow, green, and cyan.
Figure 8. Results for the initial assessment of the Southern Chicó Network.
Afterward, a detailed inspection of the watershed was performed in order to identify all the
potential locations where a stormwater tank could be installed. Hence, 65 potential locations were
selected based on criteria, such as space availability, land use, and the feasibility of building a storage
unit.
4.1.2. OptSU
OptSu was applied to the Southern Chicó Network, considering only potential nodes, which
correspond to the sites of the network where higher floods occur according to the previous hydraulic
assessment, and considering space availability in the network. For the use of this approach, it is
required that the offsets between the pipe and the invert elevation of the nodes are greater than 0.
Regarding the analyzed rainfall for the testing of this methodology, two different approaches to
Climate Change were tested: Pulgarin and CIACUA. Finally, a set of calibrated parameters at
Figure 8.
Results for the initial assessment of the Southern Chicó Network.
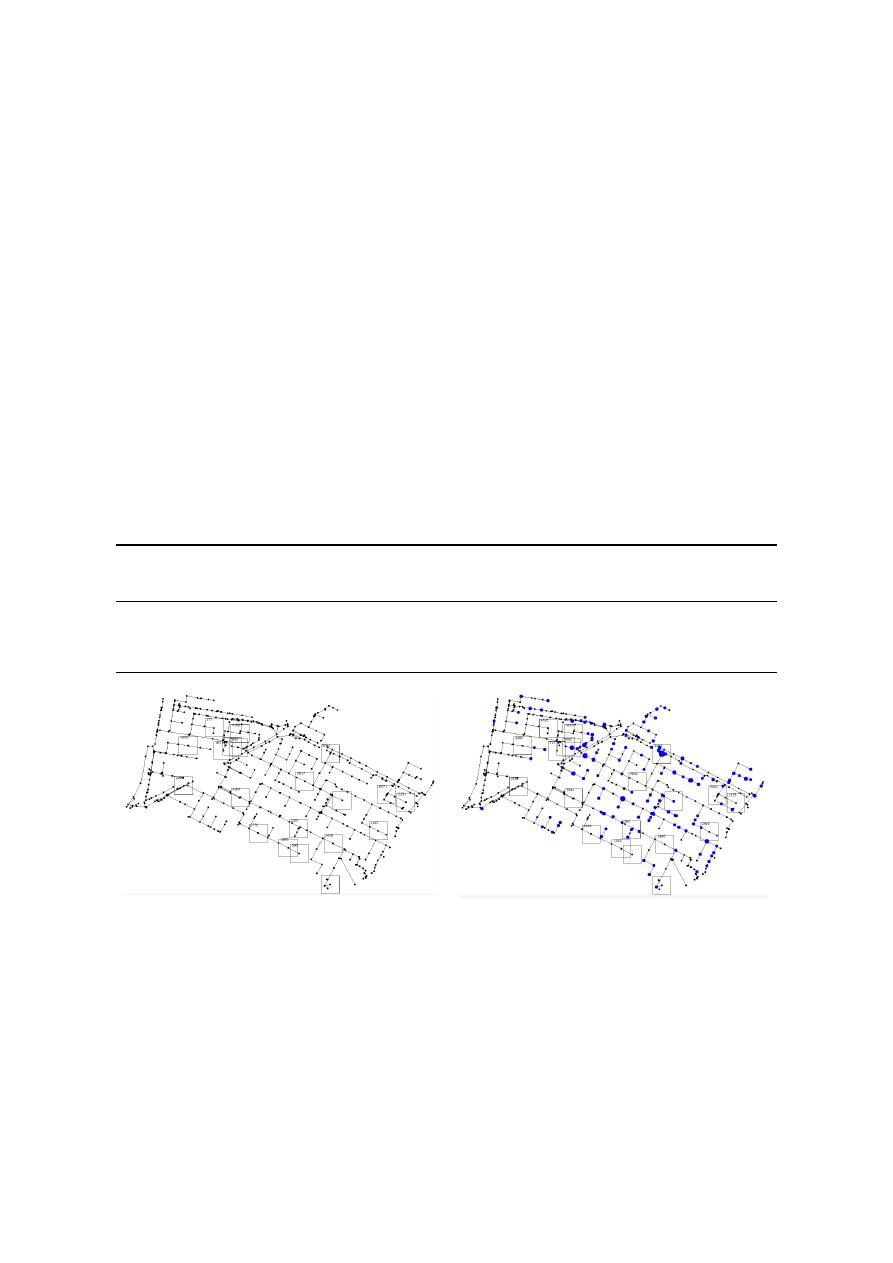
Water 2020, 12, 2491
17 of 24
Afterward, a detailed inspection of the watershed was performed in order to identify all the
potential locations where a stormwater tank could be installed. Hence, 65 potential locations were
selected based on criteria, such as space availability, land use, and the feasibility of building a
storage unit.
4.1.2. OptSU
OptSu was applied to the Southern Chicó Network, considering only potential nodes,
which correspond to the sites of the network where higher floods occur according to the previous
hydraulic assessment, and considering space availability in the network. For the use of this approach,
it is required that the o
ffsets between the pipe and the invert elevation of the nodes are greater than 0.
Regarding the analyzed rainfall for the testing of this methodology, two di
fferent approaches to
Climate Change were tested: Pulgarin and CIACUA. Finally, a set of calibrated parameters at Coimbra
University (α
= 0.2, λ = 30, γ = 0.8, and σ = 15) was used for the Simulated Annealing Algorithm [
28
].
During this research, the sensitivity of these parameters was not assessed as values calibrated in
previous works were used. The obtained results are shown in Table
2
, while the locations and sizing of
the storage units are shown in Figure
9
. For the estimation of the total costs of the stormwater tanks,
as well as the flooding costs, Equations (12) and (13) were used, given that the objective function of
OptSU is focused on volumes.
Table 2.
Results for the Southern Chicó Network using OptSU under Climate Change scenarios.
Scenario
Flood
Volume
(m
3
)
Number of
Changed
Nodes
Storage Units
Volume (m
3
)
Final
Flooding
Volume (m
3
)
Reduction
(%)
Cost
(Millions
of
€)
Climate Change
(CIACUA)
42,247
17
66,053
13,432
68.2
1.413
Climate Change
(Pulgarin)
42,568
16
63,925
15,342
63.2
1.609
Water 2020, 12, x FOR PEER REVIEW
17 of 24
Coimbra University (α = 0.2, λ = 30, γ = 0.8, and σ = 15) was used for the Simulated Annealing
Algorithm [28]. During this research, the sensitivity of these parameters was not assessed as values
calibrated in previous works were used. The obtained results are shown in Table 2, while the locations
and sizing of the storage units are shown in Figure 9. For the estimation of the total costs of the
stormwater tanks, as well as the flooding costs, Equations (12) and (13) were used, given that the
objective function of OptSU is focused on volumes.
Table 2. Results for the Southern Chicó Network using OptSU under Climate Change scenarios.
Scenario
Flood
Volume
(m
3
)
Number of
Changed
Nodes
Storage
Units
Volume (m
3
)
Final
Flooding
Volume (m
3
)
Reduction
(%)
Cost
(Millions
of
€)
Climate
Change
(CIACUA)
42,247 17 66,053 13,432 68.2 1.413
Climate
Change
(Pulgarin)
42,568 16 63,925 15,342 63.2 1.609
(a)
(b)
Figure 9. Results for the stormwater tank locations using OptSU. The black points are nodes of the
system and the blue points represent floods. (a) Results considering the CIACUA approach for
Climate Change. (b) Results considering the Pulgarín approach for Climate Change.
The results obtained using the OptSU methodology in the Southern Chicó Network showed a
good performance regarding flooding reduction, which varied between 63.9% and 68.2% depending
on the rainfall scenario. It can also be seen that the number of storage units that should be
implemented in the system ranged between 16 and 17, which represented an investment between
1,412,894 and 1,608,948 euros.
The Pulgarín approach to Climate Change resulted in intensities approximately 10% higher than
the CIACUA approach. Although the spatial distribution of the rainfall was the same for both of the
approaches, it can be seen that when OptSU was used with the CIACUA approach, the reduction was
higher than in the other scenario. Regarding the computational times associated with the execution
of this methodology, it took approximately 22 days, which denoted an elevated computational cost.
4.1.3. OptiTank
As with the OptSu approach, the OptiTank was applied to the Southern Chicó Network,
considering only 65 potential nodes based on an initial hydraulic assessment and space availability.
In this methodology, three different rainfall scenarios were tested: One scenario considered the actual
hyetographs for the study area, and the others considered Climate Change using the approaches of
CIACUA and Pulgarin.
Figure 9.
Results for the stormwater tank locations using OptSU. The black points are nodes of the
system and the blue points represent floods. (a) Results considering the CIACUA approach for Climate
Change. (b) Results considering the Pulgarín approach for Climate Change.
The results obtained using the OptSU methodology in the Southern Chicó Network showed a
good performance regarding flooding reduction, which varied between 63.9% and 68.2% depending on
the rainfall scenario. It can also be seen that the number of storage units that should be implemented
in the system ranged between 16 and 17, which represented an investment between 1,412,894 and
1,608,948 euros.
The Pulgarín approach to Climate Change resulted in intensities approximately 10% higher than
the CIACUA approach. Although the spatial distribution of the rainfall was the same for both of the

Water 2020, 12, 2491
18 of 24
approaches, it can be seen that when OptSU was used with the CIACUA approach, the reduction was
higher than in the other scenario. Regarding the computational times associated with the execution of
this methodology, it took approximately 22 days, which denoted an elevated computational cost.
4.1.3. OptiTank
As with the OptSu approach, the OptiTank was applied to the Southern Chicó Network, considering
only 65 potential nodes based on an initial hydraulic assessment and space availability. In this
methodology, three di
fferent rainfall scenarios were tested: One scenario considered the actual
hyetographs for the study area, and the others considered Climate Change using the approaches of
CIACUA and Pulgarin.
In this case, the parameters used for the Pseudo-Genetic Algorithm were a population of 100
individuals, a mutation probability of 0.015, and a crossover probability of 0.5. For the stopping criteria of
the algorithm, a value of 50 subsequent generations without changes was established. These parameters
were set based on previous work with the algorithm. In this scenario, the implementation of storage
units was the only option considered for the rehabilitation of the network, and other alternatives, such
as the renovation of pipes and the storage of water inside them, were not considered. The obtained
results are shown in Table
3
.
Table 3.
Results for the Southern Chicó Network using OptiTank under di
fferent rainfall scenarios.
Scenario
Flood
Volume
(m
3
)
Number of
Changed
Nodes
Storage Units
Volume (m
3
)
Final
Flooding
Volume (m
3
)
Reduction
(%)
Cost
(Millions
of
€)
Current Rainfall
(Water Utility)
30,298
25
29,295
9059
70.1
4.314
Climate Change
(CIACUA)
37,767
27
38,134
11,348
70.0
5.262
Climate Change
(Pulgarín)
38,062
39
41,079
7897
79.2
6.844
The results obtained using the OptiTank methodology in the Southern Chicó Network showed a
good performance in the reduction of the flooding volumes that ranged between 70.0% and 79.2%.
In this situation, it can be seen that even when the Pulgarín approach to Climate Change resulted in a
flood volume that was approximately 26% higher than the current situation, the total storage volume
required under this changing climatic condition was almost 40% higher than the one required if the
network was rehabilitated under the current situation. Therefore, as a result of the implementation
of the previously mentioned storage volume, the final flooding volume under the Climate Change
scenario would be more e
ffective in flood reduction than the implementation of the solution considering
the current solution. Regarding the computational cost of these solutions, it approximately took an
average of 5 days to reach a near-optimal solution.
Comparing the results of OptSu and OptiTank, the benefits obtained from using an
outflow-controlled optimization were evident. OptSU could reach a similar percentage of reduction
in flooding volumes by implementing half of the storage units required in the OptiTank solution,
which consequently represented economic savings in the investment of approximately 76.5%. Despite
this advantage, OptiTank required 25% of the computational costs of OptSU, establishing a clear
trade-o
ff between the computational time it took to obtain a near-optimal solution and the objective
functions that are being pursued by the rehabilitation of the network. Finally, the variations in the
results reached by each algorithm were expected because they consider di
fferent approaches to meet a
single objective. Therefore, the analysis considered both algorithms in order to make the results more
reliable, presenting two alternatives to address the same problem.
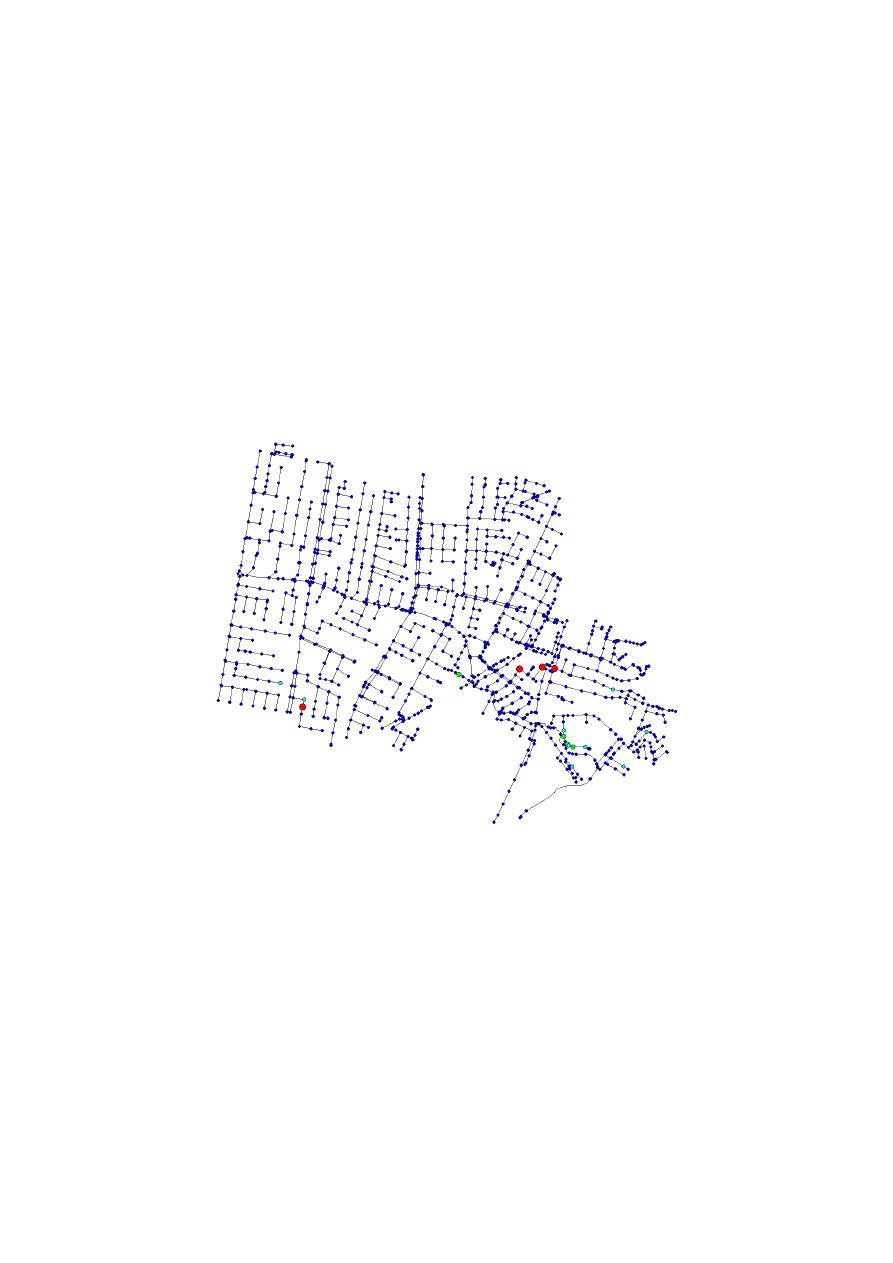
Water 2020, 12, 2491
19 of 24
4.2. Northern Chicó Network
4.2.1. Initial Assessment of the Network
An initial assessment of the hydraulic state of the Northern Chicó Network was performed prior
to the application of the optimization procedures to obtain a wider perspective on whether flooding
occurs, identify the potential sites for the location of stormwater tanks, among other considerations.
This initial assessment was performed considering a Climate Change scenario, where flooding is
most likely to occur, resulting in a flooding volume of 5187.45 m
3
for the analyzed event. In this case,
the CIACUA approach was used, despite the fact that both approaches reach a similar configuration
for flooding events. Based on this, combined with the size of the network, only OptiTank was tested
for this case of study.
As a result, the areas of the study network that were most likely to surcharge are shown in
Figure
10
, where nodes in red presented the highest flooding volumes at the most critical time after the
rainfall occurred, followed by nodes in yellow, green, and cyan.
Water 2020, 12, x FOR PEER REVIEW
19 of 24
configuration for flooding events. Based on this, combined with the size of the network, only
OptiTank was tested for this case of study.
As a result, the areas of the study network that were most likely to surcharge are shown in Figure
10, where nodes in red presented the highest flooding volumes at the most critical time after the
rainfall occurred, followed by nodes in yellow, green, and cyan.
Figure 10. Results for the initial assessment of the Northern Chicó Network.
Afterward, a detailed inspection of the watershed was performed in order to identify all the
potential locations where a stormwater tank could be installed. Hence, 53 potential locations were
selected based on criteria, such as space availability, land use, and the feasibility of building a storage
unit.
4.2.2. OptiTank
OptiTank was applied to the Northern Chicó Network, considering only potential nodes based
on an initial hydraulic assessment and the best potential locations for the tanks, including parking
lots, parks, and institutional buildings. In this methodology, two different rainfall scenarios were
tested: One scenario considered the actual hyetographs for the study area and the other considering
Climate Change effects. In the case of Climate Change, the approach of CIACUA was used, given the
similarity with Pulgarin and the elevated computational cost due to the size of the network. The
obtained results are shown in Table 4, while the locations and sizing of the storage units are shown
in Figure 11.
Table 4. Results for the Northern Chicó Network using OptiTank under different rainfall scenarios.
Scenario
Flood
Volume
(m
3
)
Changed
Nodes
Storage
Units
Volume (m
3
)
Final
Flooding
Volume (m
3
)
Reduction
(%)
Flooding
Cost
(Millions
€)
Total Cost
(Millions
€)
Current
Rainfall
(Water
Utility)
313.39 12 307.78 195.00 37.8 0.195 2.141
Climate
Change
5187.45 53 12,894.41 3388.48 34.68 3.388 5.821
Figure 10.
Results for the initial assessment of the Northern Chicó Network.
Afterward, a detailed inspection of the watershed was performed in order to identify all the
potential locations where a stormwater tank could be installed. Hence, 53 potential locations were
selected based on criteria, such as space availability, land use, and the feasibility of building a
storage unit.
4.2.2. OptiTank
OptiTank was applied to the Northern Chicó Network, considering only potential nodes based on
an initial hydraulic assessment and the best potential locations for the tanks, including parking lots,
parks, and institutional buildings. In this methodology, two di
fferent rainfall scenarios were tested:
One scenario considered the actual hyetographs for the study area and the other considering Climate
Change e
ffects. In the case of Climate Change, the approach of CIACUA was used, given the similarity
with Pulgarin and the elevated computational cost due to the size of the network. The obtained results
are shown in Table
4
, while the locations and sizing of the storage units are shown in Figure
11
.
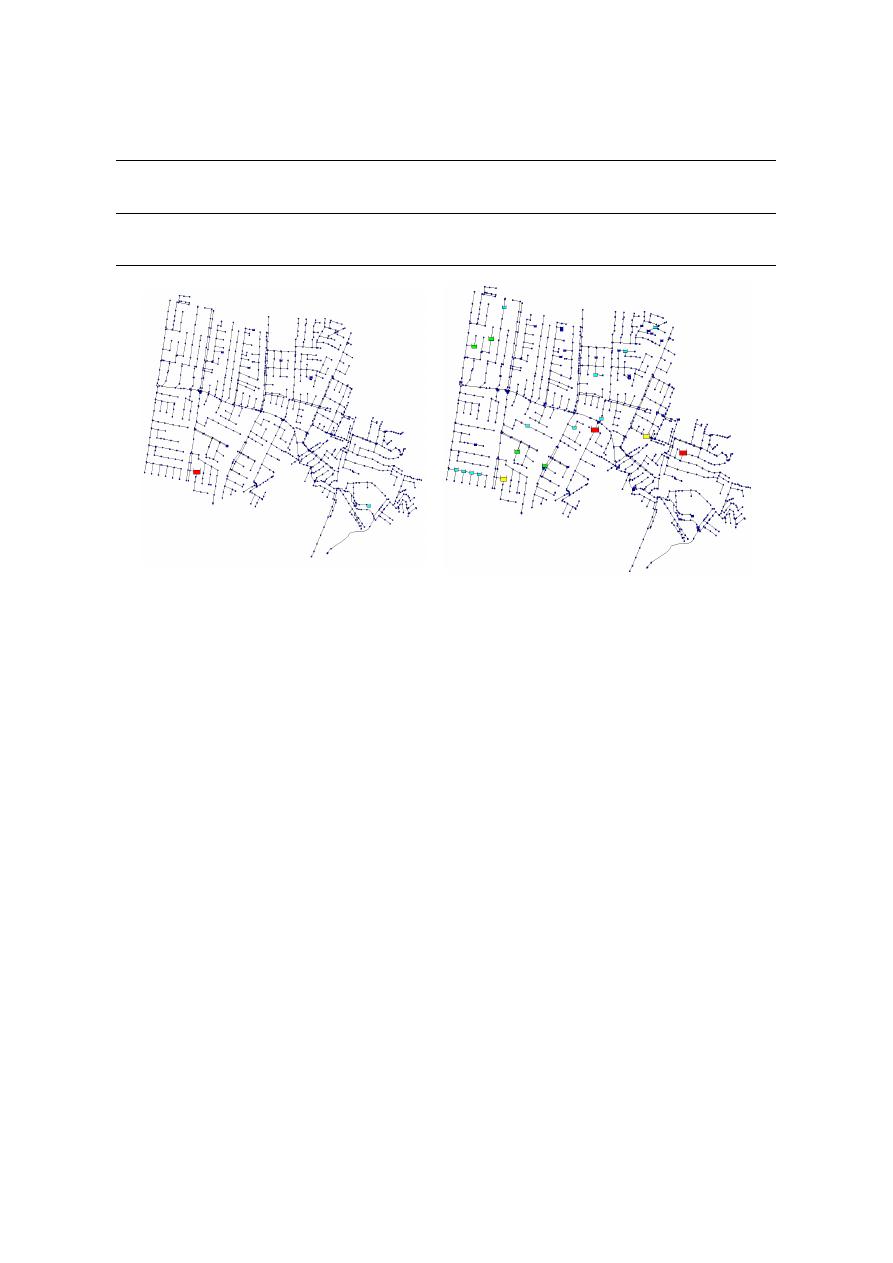
Water 2020, 12, 2491
20 of 24
Table 4.
Results for the Northern Chicó Network using OptiTank under di
fferent rainfall scenarios.
Scenario
Flood
Volume
(m
3
)
Changed
Nodes
Storage Units
Volume (m
3
)
Final
Flooding
Volume (m
3
)
Reduction
(%)
Flooding
Cost
(Millions
€)
Total Cost
(Millions
€)
Current Rainfall
(Water Utility)
313.39
12
307.78
195.00
37.8
0.195
2.141
Climate Change
5187.45
53
12,894.41
3388.48
34.68
3.388
5.821
Water 2020, 12, x FOR PEER REVIEW
20 of 24
(a)
(b)
Figure 11. Results for the stormwater tank locations using OptiTank. The colors represent the size of
the stormwater tank where red is the largest followed by yellow, green and cyan. (a) Results
considering the current rainfall scenario. (b) Results considering the Climate Change effects on
rainfall.
The application of the OptiTank methodology for the Northern Chicó network resulted in
reductions lower than those reached for the Southern Chicó network. In this case, the flooding
reduction was 37.8% in the current rainfall scenario and 34.68% in the Climate Change scenario. In
addition, in the current rainfall scenario, the flood volume was approximately 314 m
3
, while under
the Climate Change scenario, it rose to 5187.45 m
3
. This difference in volumes can be explained by
the existence of an open channel that is located in the middle of the network, which may give an
additional mitigation capacity to the system.
Regarding the number of implemented storage units under the Climate Change Scenario, it can
be inferred that most of the tanks required to reduce the flooding are small, but in order to accomplish
a significant reduction, they have a considerable size. Moreover, given that the potential locations for
storage units are mainly parks and parking lots, it is expected that the available space for
implementing the tanks will be reduced. As a consequence, only a limited number of stormwater
tanks of limited size can be installed in the network, having, as a result, a low reduction of peak flows.
A secondary consequence of the latter is the damage costs that the remaining flooding will cause
in the network, which, in this solution, is approximately € 3,388,483.70 of the total cost of the solution
achieved under the Climate Change scenario.
Finally, this solution was reached in an average computational time of 10 h, which demonstrates
an advantage in the computational efforts of this approach to reach a near-optimal solution. Besides,
another important factor to consider is the weights given to the flooding volumes, which will have a
direct impact on the final solutions reached by the algorithm. In this case, given that the small
volumes of flooding were allowed at the junctions, the reductions reached by the algorithm were
near 35%. However, if it is desired to reach higher reductions on flooding volumes, a higher weight
should be assigned to the component of flood volumes in order to be more severe on the reached
solutions.
5. Conclusions
Several conditions represent new challenges to urban drainage systems, and one of the most
important ones is the effect of Climate Change on variables, such as precipitation and temperature.
Due to this, it is expected that extreme events will become increasingly stronger; these must be
Figure 11.
Results for the stormwater tank locations using OptiTank. The colors represent the size of the
stormwater tank where red is the largest followed by yellow, green and cyan. (a) Results considering
the current rainfall scenario. (b) Results considering the Climate Change e
ffects on rainfall.
The application of the OptiTank methodology for the Northern Chicó network resulted in
reductions lower than those reached for the Southern Chicó network. In this case, the flooding
reduction was 37.8% in the current rainfall scenario and 34.68% in the Climate Change scenario.
In addition, in the current rainfall scenario, the flood volume was approximately 314 m
3
, while under
the Climate Change scenario, it rose to 5187.45 m
3
. This di
fference in volumes can be explained by the
existence of an open channel that is located in the middle of the network, which may give an additional
mitigation capacity to the system.
Regarding the number of implemented storage units under the Climate Change Scenario, it can
be inferred that most of the tanks required to reduce the flooding are small, but in order to accomplish
a significant reduction, they have a considerable size. Moreover, given that the potential locations for
storage units are mainly parks and parking lots, it is expected that the available space for implementing
the tanks will be reduced. As a consequence, only a limited number of stormwater tanks of limited
size can be installed in the network, having, as a result, a low reduction of peak flows.
A secondary consequence of the latter is the damage costs that the remaining flooding will cause
in the network, which, in this solution, is approximately
€ 3,388,483.70 of the total cost of the solution
achieved under the Climate Change scenario.
Finally, this solution was reached in an average computational time of 10 h, which demonstrates
an advantage in the computational e
fforts of this approach to reach a near-optimal solution. Besides,
another important factor to consider is the weights given to the flooding volumes, which will have a
direct impact on the final solutions reached by the algorithm. In this case, given that the small volumes
of flooding were allowed at the junctions, the reductions reached by the algorithm were near 35%.
However, if it is desired to reach higher reductions on flooding volumes, a higher weight should be
assigned to the component of flood volumes in order to be more severe on the reached solutions.

Water 2020, 12, 2491
21 of 24
5. Conclusions
Several conditions represent new challenges to urban drainage systems, and one of the most
important ones is the e
ffect of Climate Change on variables, such as precipitation and temperature.
Due to this, it is expected that extreme events will become increasingly stronger; these must be handled
by unprepared stormwater systems, leading to networks with high vulnerability to urban floods.
Regarding Climate Change, a methodology was proposed for the development of synthetic
precipitation events that considered these challenging conditions. Based on historical data series for
precipitation, a validation model was carried out to determine which of the GCMs better represented
the climate in the study area. For this validation process, a downscaling procedure was applied,
concluding that the most suitable model for the study area, located in Bogotá, Colombia, was the
CSIRO-MK3-6-0. Finally, two di
fferent equations were applied for the development of the projected
time series that considered Climate Change. Among these, the Pulgarin equation showed higher
values for predicted precipitation.
Once the e
ffects of Climate Change were assessed, two optimization approaches were tested using
two case studies located at Bogotá, Colombia: The Northern and Southern Chicó networks. The first
approach, OptiTank, considered a holistic rehabilitation process, including both the locating and sizing
of stormwater tanks and the renovation of pipes using a Pseudo-Genetic Algorithm. The second
approach, OptSU, considered an outflow-controlled optimization, besides the location and sizing of
storage units, using a Simulated Annealing Algorithm [
41
]. The implementation of these optimization
techniques was feasible due to a robust computational modeling process, which led to the creation of
an SWMM toolkit in the scope of this research, and some techniques to e
fficiently develop hydraulic
models suitable for optimization processes.
After the two networks were tested under di
fferent rainfall scenarios, it was concluded that there
was a trade-o
ff between the total installation costs and the flooding reduction against the computational
e
ffort required to reach a near-optimal solution. Based on this, it was observed that OptSU reached
lower installation costs than OptiTank by the determination of an optimal outflow structure, but it
required a great computational e
ffort to reach the solution. In addition, by comparing the results
obtained for the two case studies, it was concluded that the selection of potential nodes depending on
the available space, such as parking lots, parks, and some institutional buildings (land use), resulted in
the feasible solutions. However, given the limited space for the storage units, this could result in a
lower flooding reduction.
Finally, this research validated that the use of storage units for peak flow reduction in urban
catchments could be a highly e
fficient solution to prepare current drainage systems for future
challenges, such as Climate Change. In addition, it showed the feasibility of considering these
operational modifications to drainage networks rather than replacing the whole pipe infrastructure;
moreover, if some techniques for RTC can be implemented during the decision-making process.
For future work, it is recommended to test di
fferent drainage networks using different parameters
for the optimization procedures, considering techniques to reduce the computational e
fforts required
by the proposed methodologies, additionally, to integrate these optimization procedures with RTC to
enhance the location and sizing of the storage units, as well as its operation.
Author Contributions:
All authors contributed extensively to the work presented in this paper. P.L.I.-R. and
F.J.M.-S. contributed to the development of the SWMM toolkit, as well as the development of OptiTank. M.C. (Maria
Cunha) contributed to the development of OptSU. L.S. and L.P. contributed to the construction of the hydraulic
models and the application of OptSU and OptiTank to reach the results. C.S., M.L.R., and M.C. (Mariana Camacho)
participated in the writing process of the paper, including the state of art and description of the methodologies.
J.S. directed the project and participated in the writing of the paper and in the process of review. All authors
contributed to the revision of the manuscript. All authors have read and agreed to the published version of
the manuscript.
Funding:
This research was funded by MEXICHEM-PAVCO and COLCIENCIAS, grant number 565263339028
Acknowledgments:
The authors would like to thank Mexichem, Colombia, and COLCIENCIAS for supporting
this research through the project “Urban Drainage and Climate Change: Towards the Stormwater Systems of the

Water 2020, 12, 2491
22 of 24
Future. Phase I and II”, without which the present study could not have been completed. In addition, special
thanks to the University of Coimbra, the Polytechnic University of Valencia, the University of Buenos Aires and
Carlos Ocampo (Polytechnic University of Cataluña) for their participation in this research. Besides, the authors
acknowledge the public company Water Supply and Sewerage Utility of Bogotá (Empresa de Acueducto de Bogotá
—EAB) for their assistance with the Models for Southern and Northern Chicó Networks, without which would
have been impossible to complete these studies. We are also thankful for all the comments that greatly improved
the manuscript.
Conflicts of Interest:
The authors declare no conflict of interest.
References
1.
Willems, P.; Arnbjerg-Nielsen, K.; Olsson, J.; Nguyen, V.T.V. Climate change impact assessment on urban
rainfall extremes and urban drainage: Methods and shortcomings. Atmos. Res. 2012, 103, 106–118. [
CrossRef
]
2.
Solomon, S.; Manning, M.; Marquis, M.; Qin, D. Climate Change 2007—The Physical Science Basis: Working
Group I Contribution to the Fourth Assessment Report of the IPCC; Cambridge University Press: Cambridge, UK,
2007.
3.
Padulano, R.; Reder, A.; Rianna, G. An ensemble approach for the analysis of extreme rainfall under climate
change in Naples (Italy). Hydrol. Process 2019, 33, 2020–2036. [
CrossRef
]
4.
Zeroual, A.; Assani, A.A.; Meddi, M.; Alkama, R. Assessment of climate change in Algeria from 1951 to 2098
using the Köppen–Geiger climate classification scheme. Clim. Dyn 2019, 52, 227–243. [
CrossRef
]
5.
Arnbjerg-Nielsen, K.; Willems, P.; Olsson, J.; Beecham, S.; Pathirana, A.; Bülow Gregersen, I.; Madsen, H.;
Nguyen, V.T.V. Impacts of climate change on rainfall extremes and urban drainage systems: A review. Water
Sci. Technol. 2013, 68, 16–28. [
CrossRef
] [
PubMed
]
6.
Ashley, R.M.; Balmfort, D.J.; Saul, A.J.; Blanskby, J.D. Flooding in the future - Predicting climate change,
risks and responses in urban areas. Water Sci. Technol. 2005, 52, 265–273. [
CrossRef
] [
PubMed
]
7.
IPCC. IPCC, 2014: Summary for Policymakers; Cambridge University Press: Cambridge, UK; New York, NY,
USA, 2014; ISBN 9780874216561.
8.
Ngamalieu-Nengoue, U.A.; Martínez-Solano, F.J.; Iglesias-Rey, P.L.; Mora-Meliá, D. Multi-objective
optimization for urban drainage or sewer networks rehabilitation through pipes substitution and storage
tanks installation. Water (Switzerland) 2019, 11, 935. [
CrossRef
]
9.
Lee, E.H.; Kim, J.H. Design and operation of decentralized reservoirs in urban drainage systems. Water
(Switzerland) 2017, 9, 246. [
CrossRef
]
10.
Kändler, N.; Annus, I.; Vassiljev, A.; Puust, R. Peak flow reduction from small catchments using smart inlets.
Urban Water J. 2019. [
CrossRef
]
11.
Miao, Z.T.; Han, M.; Hashemi, S. The e
ffect of successive low-impact development rainwater systems on
peak flow reduction in residential areas of Shizhuang, China. Environ. Earth Sci. 2019, 78. [
CrossRef
]
12.
Martínez, C.; Sanchez, A.; Galindo, R.; Mulugeta, A.; Vojinovic, Z.; Galvis, A. Configuring green infrastructure
for urban runo
ff and pollutant reduction using an optimal number of units. Water (Switzerland) 2018, 10,
1528. [
CrossRef
]
13.
Rossman, L.A. STORM WATER MANAGEMENT MODEL USER’S MANUAL Version 5.1; US. Environmental
Protection Agency: Washington, DC, USA, 2015.
14.
Cunha, M.C.; Zeferino, J.A.; Simões, N.E.; Santos, G.L.; Saldarriaga, J.G. A decision support model for the
optimal siting and sizing of storage units in stormwater drainage systems. Int. J. Sustain. Dev. Plan. 2017, 12,
122–132. [
CrossRef
]
15.
Ngamalieu-Nengoue, U.A.; Iglesias-Rey, P.L.; Martínez-Solano, F.J.; Mora-Meliá, D.; Valderrama, J.G.S.
Urban drainage network rehabilitation considering storm tank installation and pipe substitution. Water
(Switzerland) 2019, 11, 515. [
CrossRef
]
16.
Cimorelli, L.; Morlando, F.; Cozzolino, L.; Covelli, C.; Della Morte, R.; Pianese, D. Optimal positioning and
sizing of detention tanks within urban drainage networks. J. Irrig. Drain. Eng. 2016, 142. [
CrossRef
]
17.
Duan, H.F.; Li, F.; Yan, H. Multi-Objective Optimal Design of Detention Tanks in the Urban Stormwater
Drainage System: LID Implementation and Analysis. Water Resour. Manag. 2016, 30, 4635–4648. [
CrossRef
]
18.
Iglesias-Rey, P.L.; Martínez-Solano, F.J.; Saldarriaga, J.G.; Navarro-Planas, V.R. Pseudo-genetic Model
Optimization for Rehabilitation of Urban Storm-water Drainage Networks. Procedia Eng. 2017, 186, 617–625.
[
CrossRef
]

Water 2020, 12, 2491
23 of 24
19.
Martínez-Solano, F.J.; Iglesias-Rey, P.L.; Saldarriaga, J.G.; Vallejo, D. Creation of an SWMM toolkit for its
application in urban drainage networks optimization. Water (Switzerland) 2016, 8, 259. [
CrossRef
]
20.
IDIGER. Project Update Risk Management Component for the Regular Review and Update of the Land-Use Plan;
Alcaldia Mayor de Bogota D.C.: Bogotá, Colombia, 2018.
21.
Schütze, M.; Campisano, A. Real-time control of urban water systems. In Proceedings of the International
Conference on Pumps, Electromechanical Devices and Systems Applied to Urban Water Management PEDS,
Valencia, Spain, 22–25 April 2003.
22.
García, L.; Barreiro-Gomez, J.; Escobar, E.; Téllez, D.; Quijano, N.; Ocampo-Martinez, C. Modeling and
real-time control of urban drainage systems: A review. Adv. Water Resour. 2015, 85, 120–132. [
CrossRef
]
23.
Wittenmark, B.; Nilsson, J.; Torngren, M. Timing problems in real-time control systems. In Proceedings of
the American Control Conference, Seattle, WA, USA, 21–23 June 1995.
24.
IPCC. Climate Change 2014: Synthesis Report. Contribution of Working Groups I, II and III to the Fifth Assessment
Report of the Intergovernmental Panel on Climate Change; Core Writing Team, Pachauri, R.K., Meyer, L.A., Eds.;
IPCC: Geneva, Switzerland, 2014.
25.
Saldarriaga, J.G.; Camilloni, I.; Páez, N.; Bohórquez, J.; Pulgarín, L. Validación De Modelos Climáticos
Globales Para La Determinación De Eventos Extremos De Precipitación en Colombia. In Proceedings of the
XXVII CONGRESO LATINOAMERICANO DE HIDRÁULICA, Lima, Peru, 26–30 September 2016.
26.
Cuadrat, J.M.; Vicente, S.M.; Saz, M.A. La Información Climática como Herramienta de Gestión Ambiental;
Universidad de Zaragoza: Albarracín, Spain, 2002.
27.
Stevens, B.; Giorgetta, M.; Esch, M.; Mauritsen, T.; Crueger, T.; Rast, S.; Salzmann, M.; Schmidt, H.; Bader, J.;
Block, K.; et al. Atmospheric component of the MPI-M earth system model: ECHAM6. J. Adv. Model. Earth
Syst. 2013, 5, 146–172. [
CrossRef
]
28.
Magi, B.I. Global lightning parameterization from CMIP5 climate model output. J. Atmos. Ocean. Technol.
2015
, 32, 434–452. [
CrossRef
]
29.
Dunne, J.P.; John, J.G.; Adcroft, A.J.; Gri
ffies, S.M.; Hallberg, R.W.; Shevliakova, E.; Stouffer, R.J.; Cooke, W.;
Dunne, K.A.; Harrison, M.J.; et al. GFDL’s ESM2 global coupled climate-carbon earth system models. Part I:
Physical formulation and baseline simulation characteristics. J. Clim. 2012, 25, 6646–6665. [
CrossRef
]
30.
Collier, M.A.; Je
ffrey, S.J.; Rotstayn, L.D.; Wong, K.K.H.; Dravitzki, S.M.; Moeseneder, C.; Hamalainen, C.;
Syktus, J.I.; Suppiah, R.; Antony, J.; et al. The CSIRO-Mk3.6.0 Atmosphere-Ocean GCM: Participation
in CMIP5 and data publication. In Proceedings of the MODSIM 2011—19th International Congress on
Modelling and Simulation—Sustaining Our Future: Understanding and Living with Uncertainty, Peth,
Australia, 12–16 December 2011.
31.
Voldoire, A.; Sanchez-Gomez, E.; Salas y Mélia, D.; Decharme, B.; Cassou, C.; Sénési, S.; Valcke, S.; Beau, I.;
Alias, A.; Chevallier, M.; et al. The CNRM-CM5.1 global climate model: Description and basic evaluation.
Clim. Dyn. 2013, 40, 2091–2121. [
CrossRef
]
32.
Ackerley, D.; Dommenget, D. Atmosphere-only GCM (ACCESS1.0) simulations with prescribed land surface
temperatures. Geosci. Model Dev. 2016, 9, 2077–2098. [
CrossRef
]
33.
Ministerio de Vivienda Ciudad y Territorio. Reglamento Técnico del Sector de Agua Potable y Saneamiento
Básico: TÍTULO B. In Reglamento Técnico del Sector de Agua Potable y Saneamiento Básico; Viceministerio de
Agua y Saneamiento Básico: Bogotá, Colombia, 2010; ISBN 9789588491516.
34.
Pulgarin, E.; Póveda, G. Estimación de curvas IDF basadas en las propiedades de escala de la lluvia.
In Proceedings of the XVIII Seminario Nacional de Hidráulica e Hidrología, Bogotá, Colombia, 1 April 2008.
35.
Yazdi, J.; Lee, E.H.; Kim, J.H. Stochastic multiobjective optimization model for urban drainage network
rehabilitation. J. Water Resour. Plan. Manag. 2015, 141. [
CrossRef
]
36.
Martínez-Solano, F.; Iglesias-Rey, P.L.; Mora Meliá, D.; Ribelles-Aguilar, J.V. Combining Skeletonization,
Setpoint Curves, and Heuristic Algorithms to Define District Metering Areas in the Battle of Water Networks
District Metering Areas. J. Water Resour. Plan. Manag. 2018. [
CrossRef
]
37.
Saldarriaga, J.; Bustos, K. Test of a methodology for storm tank location in sectors of Bogotá and Medellín
cities. In Proceedings of the XV Seminario Iberoamericano de Redes de Agua y Drenaje, SEREA2017, Bogotá,
Colombia, 27–30 November 2017.
38.
Baek, H.; Ryu, J.; Oh, J.; Kim, T.H. Optimal design of multi-storage network for combined sewer overflow
management using a diversity-guided, cyclic-networking particle swarm optimizer—A case study in the
Gunja subcatchment area, Korea. Expert Syst. Appl. 2015, 42, 6966–6975. [
CrossRef
]

Water 2020, 12, 2491
24 of 24
39.
McEnery, J.A.; Morris, C.D. Muskingum optimisation used for evaluation of regionalised stormwater
detention. J. Flood Risk Manag. 2012, 5, 49–61. [
CrossRef
]
40.
Cunha, M.C.; Zeferino, J.A.; Simões, N.E.; Saldarriaga, J.G. Optimal location and sizing of storage units in a
drainage system. Environ. Model. Softw. 2016. [
CrossRef
]
41.
Kirkpatrick, S.; Gelatt, C.D.; Vecchi, M.P. Optimization by simulated annealing. Science 1983, 220, 671–680.
[
CrossRef
]
42.
Rossman, L.A. Epanet 2 User ’s Manual; U.S. Environmental Protection Agency: Cincinnati, OH, USA, 2000.
43.
Del Giudice, G.; Padulano, R. Sensitivity Analysis and Calibration of a Rainfall-runo
ff Model with the
Combined Use of EPA-SWMM and Genetic Algorithm. Acta Geophys. 2016, 64, 1755–1778. [
CrossRef
]
44.
Martínez-Solano, F.J.; Iglesias-Rey, P.L.; Saldarriaga, J.; Mora-Meliá, D. Reducing computation time by direct
modification of SWMM parameters through a Toolkit. In Proceedings of the XV Seminario Iberoamericano
de Redes de Agua y Drenaje, SEREA2017, Bogota, Colombia, 27–30 November 2017.
45.
Saldarriaga, J.G.; Camilloni, I.; Páez, N.; Bohórquez, J.; Pulgarín, L. Evaluación de una Metodología para la
Determinación de Eventos Futuros de Precipitación Extremos Bajo Cambio Climático. In Proceedings of the
XXVII CONGRESO LATINOAMERICANO DE HIDRÁULICA, Lima, Peru, 26–30 September 2016.
© 2020 by the authors. Licensee MDPI, Basel, Switzerland. This article is an open access
article distributed under the terms and conditions of the Creative Commons Attribution
(CC BY) license (http:
//creativecommons.org/licenses/by/4.0/).
