
DEPARTMENT OF CIVIL AND ENVIRONMENTAL ENGINEERIGN
FACULTY OF ENGINEERING
Master’s Thesis
January 2025
1
Microplastics in Pipelines: Water Hammer Effects
and Identification Protocol Validation.
Simon Cardona Orozco, Juan Saldarriaga
2
& Jaime Plazas-Tuttle
1
Departament of Civil and Environmental Engineering, Universidad de los Andes, Bogotá, Colombia
CIACUA. Water and Sewerage Research Center (Centro de Investigación en Acueductos y Alcantarillados)
1
Advisor
2
Coadvisor
Abstract
The presence of microplastics in drinking water has become a pressing environmental and health concern, with growing
evidence of their pervasive impact on ecosystems and human health. This study focuses on the development and validation of
a prototype designed to simulate microplastic generation within drinking water distribution pipelines. By employing Raman
spectroscopy and advanced sample preparation techniques, we established a preliminary methodology for identifying and
quantifying microplastics in laboratory-controlled conditions. Preliminary findings indicate that polymer degradation,
exacerbated by phenomena such as water hammer, contributes significantly to microplastic release in polyvinyl chloride (PVC),
Chlorinated Polyvinyl Chloride (C-PVC) , Polypropelene (PP) and polyethylene (PE) pipes. Our results underline the critical
need for improved pipeline materials and design standards to mitigate microplastic contamination. Furthermore, this research
contributes to the sixth Sustainable Development Goal (SDG) by proposing a framework for assessing the impact of polymer
aging on water quality, thereby fostering advancements in sustainable water distribution systems.
Keywords: Microplastics, Water Hammer, Plastic degradation, Microplastic Identification Protocol, Raman Spectroscopy,
Plastic pipes.
1. Introduction
1.1. Introduction
Water quality remains a global concern, with microplastics emerging as a growing risk, particularly due to their ingestion
through drinking water. Microplastics, tiny plastic particles, have gained scientific attention since 2004, when Richard
Thompson first identified them in marine environments (Thompson et al., 2004). With polymers like PVC and PE commonly
used in water distribution systems, concerns have arisen about their potential to release microplastics under certain conditions,
especially given the aging and degradation of these materials.
Microplastics are classified as primary (intentionally manufactured, e.g., in cosmetics) or secondary (resulting from the
breakdown of larger plastic items). Their morphology varies: fibers, fragments, films, and pellets; and their identification is
possible through color, shape, and material composition. Common polymers found include LDPE, HDPE, polypropylene,
polystyrene, PVC, and nylon (Sillanpää et al., 2022).
Recent studies have shown that PVC and PE pipes, despite their durability, can degrade over time due to mechanical,
chemical, and biological factors, contributing to microplastic release. Tools like the carbonyl index have been used to quantify
the aging process and the resulting increase in microplastic shedding, especially in PE (Świetlik & Magnucka, 2025).
Based on the information presented, a methodology is proposed to systematically evaluate the conditions under which
microplastics may be generated. Accordingly, the primary contribution of this report lies in the development of an integrated
experimental and analytical protocol designed to assess microplastic generation induced by transient hydraulic phenomena,
specifically water hammer, in drinking water distribution pipes manufactured from PVC, C-PVC, HDPE, and PP.

Microplastics in Pipelines: Water Hammer Effects and Identification Protocol Validation
Cardona, S. & Plazas-Tuttle, J.
2
The proposed protocol is structured to ensure reproducibility and consistency, thereby enabling the generation of comparable
and robust datasets. This framework provides a methodological basis for future studies aimed at evaluating the influence of
hydraulic conditions (flow, pressure) and pipe properties as size and material on microplastic generation.
1.2 Presence of Microplastics y drinkable water distribution networks
Research indicates that current water treatment technologies are only capable of removing approximately 50% of
microplastics, allowing the remainder to enter and persist within drinking water distribution networks (Dalmau-Soler et al.,
2021) (Li et al., 2021). Within these systems, microplastics are frequently found embedded in pipe scales (mineral deposits
primarily composed of calcium and magnesium) and in biofilms. These accumulations typically form in zones with reduced
flow velocity, such as downstream segments or areas affected by clogging (Yang et al., 2023).
Studies have shown that pipe scales, particularly those located at the bottom of pipes due to sedimentation, can serve as
reservoirs for microplastics. Furthermore, pH testing has revealed a correlation between the presence of microplastics and
elevated concentrations of Ca²⁺ and Mg²⁺ ions. Microplastics also tend to bind with biofilms, especially in long sections of the
pipeline where both materials settle, thereby creating favorable conditions for persistent contamination (Chu et al., 2022).
1.3 Microplastics generation by hydraulic phenomena.
The control of water quality after treatment plants is often overlooked in studies on microplastic detection, as it is considered
less critical than in other water bodies (Hariri Asli et al., 2024). However, materials within water distribution networks can still
contaminate the water. In particular, PVC and PE pipes may degrade due to hydraulic phenomena such as water hammer. The
stress caused by the sudden closure of a valve can exceed the mechanical resistance of the pipe material (Wu et al., 2023).
Therefore, a procedure was carried out to support the hypothesis that water hammer can generate microplastics originating from
the pipe material.
1.4 Impacts of Microplastics on Human Health and the Environment
The danger of microplastics lies in their ability to penetrate and spread throughout the human body. It has been shown that
a typical adult may ingest or inhale approximately 40,000 microplastic particles annually (Yang et al., 2022). Due to their small
size and physical-chemical properties, microplastics are capable of traveling through various tissues, and have been detected in
the blood, as well as in vital organs such as the brain, liver, heart, and lungs. While the full extent of the health impacts remains
unclear, multiple studies have identified potential pathologies associated with microplastic exposure (Nawab et al., 2024). For
instance, heart diseases have been linked to microplastic presence, suggesting a possible causal relationship. Furthermore,
evidence indicates that microplastics circulating in the bloodstream may disrupt the endocrine system, altering hormonal
functions (Cong et al., 2024).
The primary routes of microplastic entry into the human body are inhalation and ingestion (Yang et al., 2022). Inhalation is
particularly associated with airborne microplastic fibers, which are small enough to bypass the respiratory system's natural
defenses (Prata et al., 2021). Studies have found microplastic fibers embedded in lung tissue, which may lead to health
conditions such as inflammatory responses and chronic obstructive pulmonary disease (COPD) (Yang et al., 2022).
Ingestion, on the other hand, has been linked to adverse effects in several biological systems, including the immune,
reproductive, and endocrine systems (Prata et al., 2021). The toxic components of microplastics can provoke various
consequences depending on the affected system (Yang et al., 2022). For example, in the immune system, the body’s defense
mechanisms struggle to neutralize microplastics due to their distinct structural characteristics compared to typical pathogens.
In the endocrine system, hormonal imbalances have been associated with the presence of additives such as bisphenol A (BPA),
a known endocrine disruptor found in many plastic materials. Elevated BPA levels can lead to estrogen imbalances and are also
associated with cardiovascular complications (Yang et al., 2022).
1.5 Regulations and Standards
In Colombia, the characterization of drinking water quality is governed by Resolution 2115 of 2007 (Gobierno de Colombia
Ministerio de Vivienda, 2007). This resolution establishes the physical, chemical, and microbiological parameters that treated
water must meet before being distributed to the population. It defines minimum acceptable concentrations for various minerals
and other substances that could affect human health. However, it does not address the presence of microplastics. The parameters
included in the resolution are based on known health risks associated with traditional contaminants, while emerging pollutants
such as microplastics remain unregulated. Although there are regulations in Colombia prohibiting the use of single-use plastics
(aimed at reducing environmental contamination and microplastic generation) these are not directly connected to water quality
standards (Colombian Congress, 2022).
Microplastics in Pipelines: Water Hammer Effects and Identification Protocol Validation
Cardona, S. & Plazas-Tuttle, J.
3
From a legislative perspective, the state operates under a set of legal instruments, including laws, decrees, and resolutions
that govern the provision of drinking water. Among these, Resolution 2115 stands out for its technical content. Additionally,
Colombia adheres to the International Health Regulations (IHR) (WHO, 2005), which provide a global framework for ensuring
public health safety. However, the IHR do not specifically address microplastics, nor do they include technical criteria related
to their presence in water.
Internationally, regulatory approaches to microplastics vary. In jurisdictions such as the European Union, the United States,
and China, regulations tend to focus primarily on primary microplastics,those intentionally manufactured at microscopic sizes
(Mitrano & Wohlleben, 2020). As a result, secondary microplastics, which originate from the degradation of larger plastic
materials, often remain unregulated, allowing their continued generation and accumulation. Effective regulation requires a
comprehensive understanding of both the causes and consequences of microplastic pollution. In this regard, continued research
can play a pivotal role in informing future regulatory frameworks and shaping global perspectives on the risks associated with
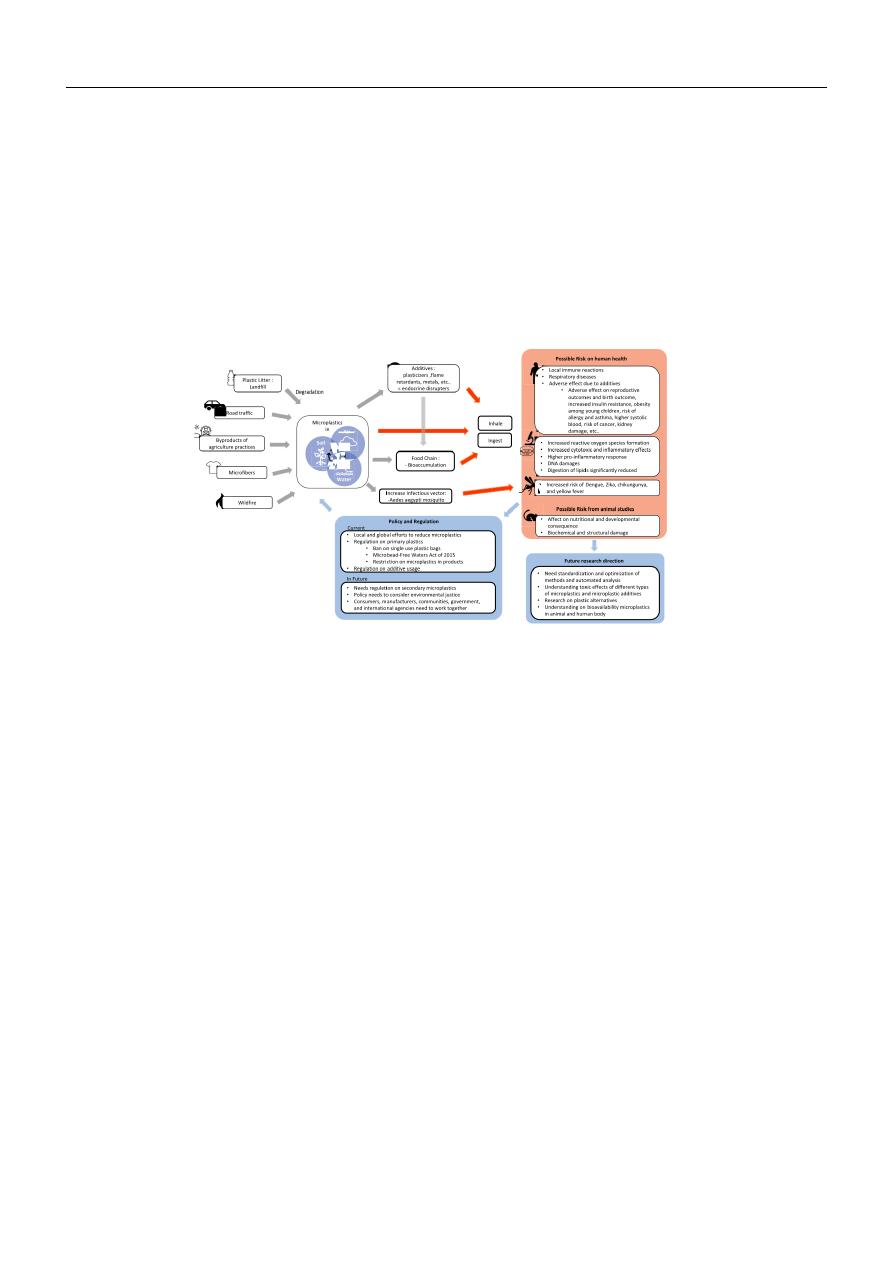
microplastics (Jung et al., 2022).
Figure 1. Process of research in Microplastics (Jung et al., 2022)
2. Methodology for Microplastic Identification
2.1. Methodologies in the literature
Protocols associated with the identification of microplastics in drinking water distribution systems have been detailed in
various studies. In research conducted by Kirstein et al. (2021), samples were collected directly from the tap using a flow rate
of 10 L/min. The water was filtered through stainless-steel filters with a pore size of 5 μm. As the filters became clogged with
particles, the volume of water filtered varied accordingly. The filtered material was transferred to pre-muffled glass Petri dishes
containing 70% ethanol and stored at -20°C to prevent contamination.
To extract microplastics from the samples, all equipment was thoroughly decontaminated muffled at 500°C and rinsed with
particle-free or deionized water. The samples were subsequently filtered again using 0.7 μm glass fiber filters. These filters
were then transferred to muffled glass beakers and incubated in a 5% sodium dodecyl sulfate (SDS) solution at 50°C for 24
hours. Following the removal of SDS, a density separation process using sodium polytungstate was carried out to isolate the
microplastic particles.
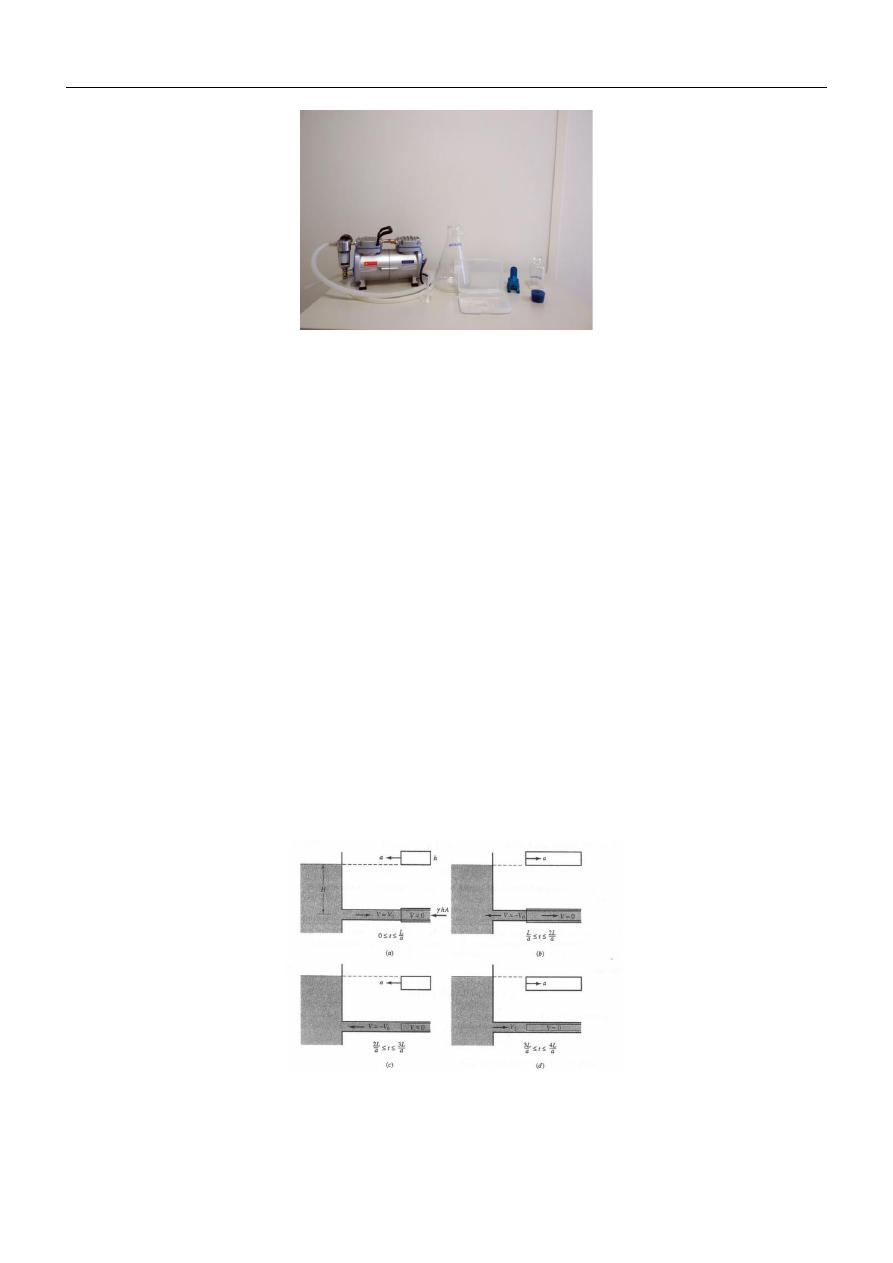
For the present investigation, the equipment to be used is the ParticleFinder™: Automatic Particle Location and Raman
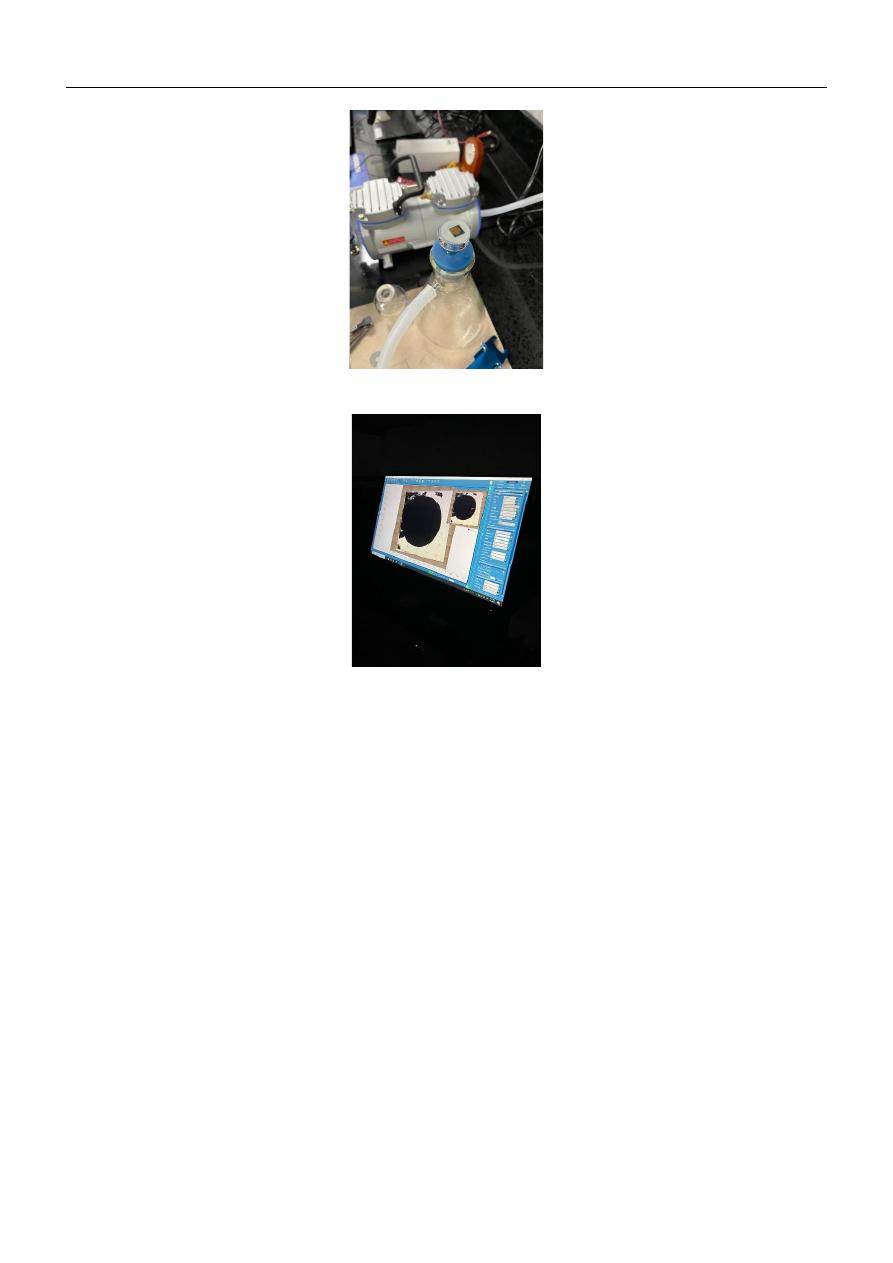
Chemical ID, which includes a filtration kit with silicon (Si) filters. The protocol begins with the extraction of a 125 mL water
sample, which is placed in a filtration flask connected to a vacuum pump. The flask is fitted with a funnel and a Si filter. When
the vacuum pump is activated, the sample passes through the filter, capturing any microplastic particles present.
The filter is then dried at 40°C for two hours to evaporate residual water. Once dry, it is analyzed using a Raman spectroscope
integrated with the ParticleFinder™ system to identify and quantify microplastics. Results will be expressed as the number of
particles per liter. The vacuum pump setup allows for successive filtrations of 125 mL to achieve a cumulative volume of 1
liter per sample.
Microplastics in Pipelines: Water Hammer Effects and Identification Protocol Validation
Cardona, S. & Plazas-Tuttle, J.
4
Figure 2. Filt Kit Horiba
3. Generation of micro plastics inside laboratory conditions
3.1. Water Hammer Phenomenon in Pipelines
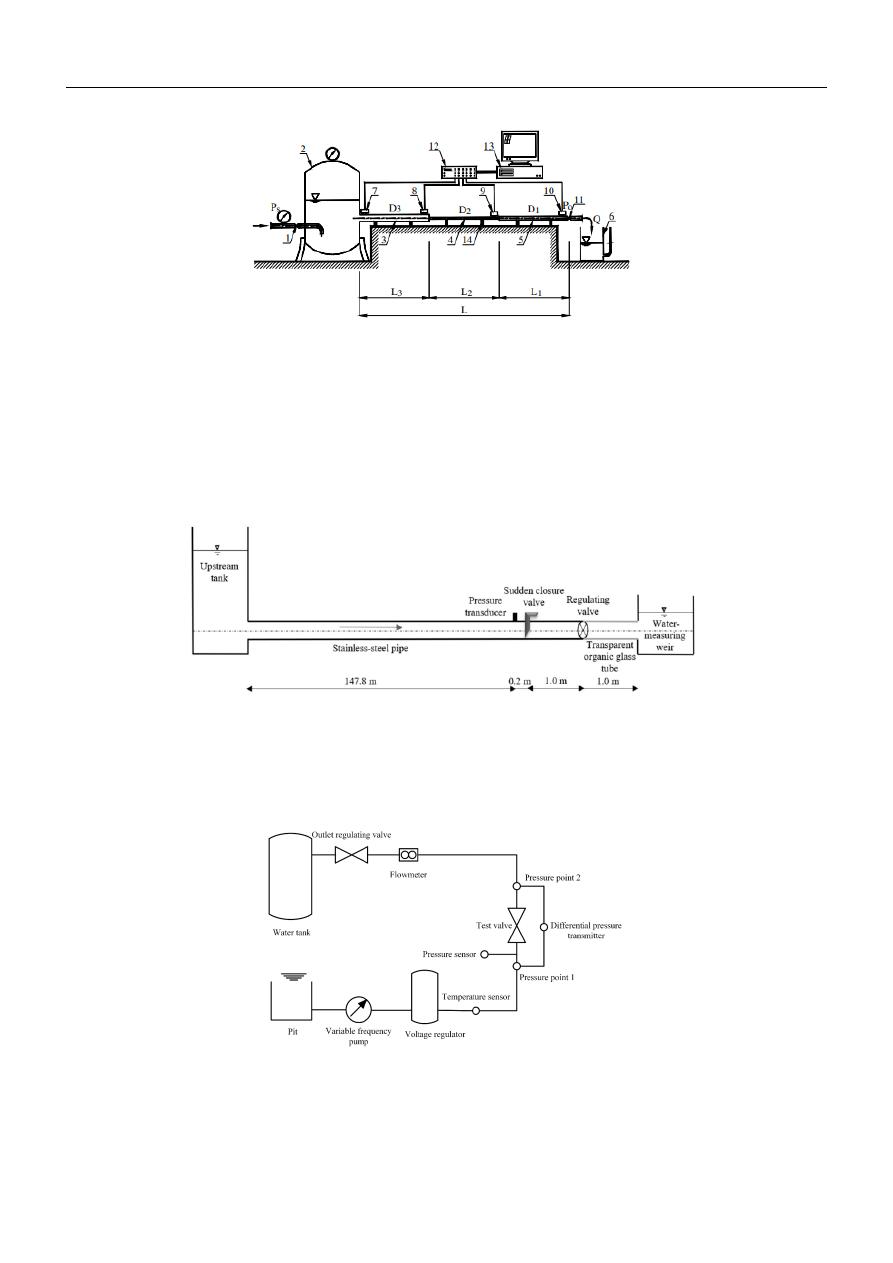
Water hammer is a transient hydraulic phenomenon that affects the flow within a pipe system. It is typically triggered by the
abrupt closure of a valve, which causes a sudden reduction in flow velocity and an associated increase in pressure head. This
results in the generation of a high-pressure pulse that propagates upstream at the sonic wave speed, denoted as a. The initial
pressure surge causes the flow to momentarily stop this marks the first of four characteristic waves associated with the water
hammer phenomenon.
As the upstream flow decelerates completely, the system attempts to stabilize by drawing from the upstream reservoir.
However, since the reservoir pressure is now lower than the pressure in the pipeline (following the arrival of the first wave),
the flow tends to reverse, leading to a pressure drop inside the pipe. This reversed wave then travels back toward the closed
valve. Upon reaching the valve, the flow is again abruptly stopped, generating a third wave that propagates upstream, this time
with a pressure lower than the original pipeline pressure.
At the reservoir, the wave is reflected once more, now moving downstream and causing a rise in pressure. Finally, the wave
reaches the valve a second time, where the still-closed valve halts the flow, initiating the cycle anew. This repetitive cycle
continues until the energy of the waves is sufficiently dissipated by the materials in the system.
Since the wave propagates at sonic speed (a), the time it takes for the wave to travel from the valve to the reservoir is given
by L/a, where L is the pipe length. Thus, the characteristic intervals for the wave reflections are:
• First wave: 0 < t < L/a (a)
• Second wave: L/a < t < 2L/a (b)
• Third wave: 2L/a < t < 3L/a (c)
• Fourth wave: 3L/a < t < 4L/a (d)
Figure 3. Water Hammer Phases (Streeter et al., 1998)

Microplastics in Pipelines: Water Hammer Effects and Identification Protocol Validation
Cardona, S. & Plazas-Tuttle, J.
5
The water hammer phenomenon has significant implications depending on the specific system conditions. It can generate
pressures that exceed the pipe's design limits, potentially damaging system components such as pumps. Moreover, in addition
to the high-pressure surges, the resulting negative pressures can be even more detrimental. Pipes are typically designed to
withstand internal positive pressures, but under vacuum or sub-atmospheric conditions, they may collapse (Streeter et al., 1998).
This study places particular emphasis on the deformations caused by water hammer, as these mechanical stresses (both
compressive and tensile) can degrade pipe material integrity over time. Such degradation can contribute to the release of
microplastics into the water, especially in systems using plastic materials like PVC or PE.
The equations associated with this phenomenon are the following:
The equation of motion:
𝜕𝑉
𝜕𝑡
+
1
𝜌
𝜕𝑝
𝜕𝑥
+ 𝑔 𝑠𝑖𝑛𝜃 +
𝑓 𝑉|𝑉|
2𝐷
= 0
(1)
The equation of continuity:
𝜕𝑝
𝜕𝑡
+ 𝜌𝑎
2
𝜕𝑉
𝜕𝑥
= 0
(2)
Where:
𝑎 =
𝐾/𝜌
√1 + (
𝐾
𝐸
) (
𝐷
𝑒
− 2)
(3)
Overpressure in the pipeline:
𝑃 =
𝑎𝑉
𝑔
(4)
And:
𝑝: Pressure inside the pipe
𝜌: Density of the fluid in the pipe.
𝑉: Velocity in the pipe
𝑥: Developing distance in the pipe.
𝑡: Developing time since the closure of the valve.
𝐷: Diameter of the pipe
𝑒: Thickness of the pipe.
𝐸: Young’s Modulus for the pipe material.
𝐾: Compressibility of the fluid.
𝑃: Overpressure caused by the Water Hammer.
𝑔: gravity 9.81 m/s
2
.
The deformations can be determined by the pressure made in the walls that generates the tensile and compressive stress
(Hariri Asli et al., 2024).
As was already exposed microplastics can be related with the internal degradation of the pipe, the for the investigation is
stated that if it is possible to degrade a pipe with mechanical deformation it is possible to find afterwards microplastics (Świetlik
& Magnucka, 2025).
Then overpressure inside the pipe that is going to be analyzed will be estimated with Equation 4. This equation is taken from
the catalogues of the pipes that are being used.
3.2. Methods for generating the water hammer.
For generating the water hammer a model should be designed and built. For the selection of the design other studies were
seen. The water hammer is going to be analyzed inside pipelines. The water hammer is often made by a rapid closure of a valve.
The detention of the flow makes a wave of high pressure, and then a wave of low pressure. The models that have been built
works according different characteristics. So, for each model seen, the characteristics that are evaluated are relevant. For the
study of Malesińska et al. (2020) the model that was built has the following setup.
Microplastics in Pipelines: Water Hammer Effects and Identification Protocol Validation
Cardona, S. & Plazas-Tuttle, J.
6
Figure 4. Model of. Malesińska et al. (2020)
Where: Measuring station for the research of water hammer: 1 = reducing valve; 2 = pressure tank; 3–5 = tested pipes with
variable geometric parameters (diameter and length of tested section); 6 = measuring vessel; 7–10 = pressure sensors; 11 =
shut-off valve with closing time meter; 12 = amplifier; 13 = PC with analog card; and 14 = regulated pipe clamping to the
ground
For this setup the pressure of the flow at initial conditions had values of 4 bar and when the wave started the pressure could
arise until values of 12 bar. Different sections of pipes were used, but in the experiment the types were combined in order to
make a venturi effect. This venturi effect was also associated with the generation of cavitation.
There is another model that has a purpose of measuring the wave. As the study made by Xu et al. (2023)
Figure 5. Model of Xu et al. (2023)
In this setup a singular 147.8m long pipe, of 8 and 5 centimeters. This investigation had an aim of determining the
characteristics of the waves formed by water hammer, the longer distance give bigger intervals for the wave to transport.
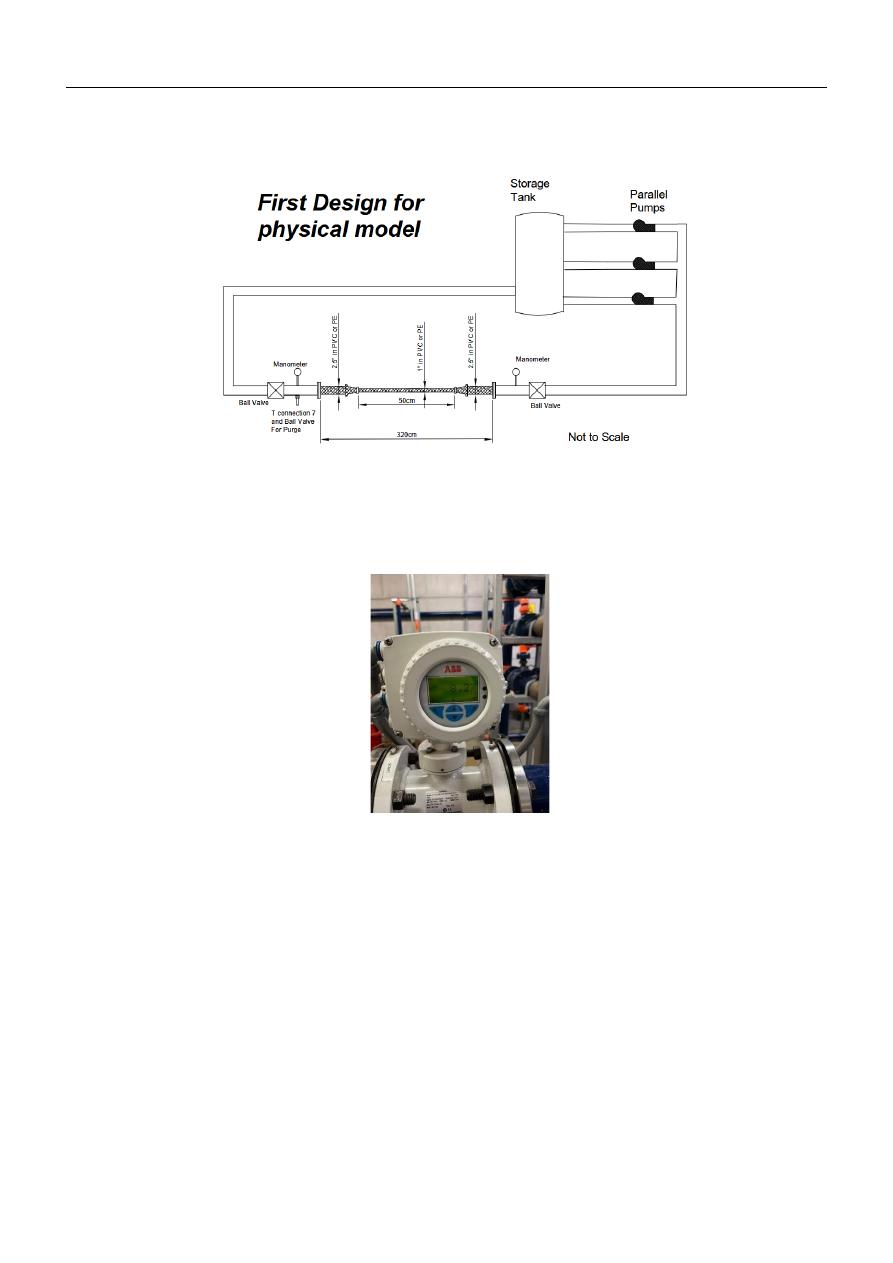
In the investigation by Han et al. (2022) had the aim of characterizing a ball valve. The ball valve has the main attribute of
being able to make instant closes in pipelines with ease. The setup for this research is designed as it follows.
Figure 6. Model by Han et al. (2022)
The experiment had flows up to 600
𝑚
3
/ℎ, and the pressures when the valve was closed could reach up to 600 kPa. The
measure had the objective of characterizing the times of closure of the ball valve. The physical model had feedback with a CFD
model where the pressures associated with the

Microplastics in Pipelines: Water Hammer Effects and Identification Protocol Validation
Cardona, S. & Plazas-Tuttle, J.
7
3.3. Mechnical behaviour of the materials.
For the experimental protocol developed in this thesis, a controlled physical laboratory model was designed to characterize
the generation of microplastics induced by water hammer events. The materials selected for evaluation include polyvinyl
chloride (PVC), high-density polyethylene (HDPE), polypropylene (PP), and chlorinated polyvinyl chloride (C-PVC), which
are widely used in drinking water distribution systems. These materials were comparatively assessed based on their mechanical
properties and viscoelastic behavior, with particular emphasis on their response to transient stress conditions. The analysis
focused on the manner in which each material accommodates rapid pressure fluctuations associated with water hammer,
allowing for the identification of material-dependent mechanical responses that may influence microplastic generation
mechanisms.
According to the framework presented in Mechanical Properties of Solid Polymers (Ward & Sweeney, 2013), the elastic
modulus is a primary parameter governing how a polymeric material responds to rapidly applied loads. In this context, PVC
and CPVC exhibit the highest elastic modulus among the materials analysed, indicating a relatively stiff mechanical response
with limited elastic deformation under stress. This stiffness implies that pressure waves generated during hydraulic transients
are transmitted with minimal attenuation through the pipe wall, resulting in higher instantaneous stresses at the material fluid
interface. In contrast, HDPE shows a significantly lower elastic modulus and markedly higher elastic deformability, allowing
the pipe wall to undergo radial expansion during pressure surges. Polypropylene presents an intermediate behavior, with
stiffness greater than HDPE but substantially lower than PVC and CPVC. Consequently, under water hammer conditions, PVC
and CPVC are expected to experience higher localized stress concentrations, while HDPE and, to a lesser extent, PP can
partially dissipate transient energy through elastic deformation.
Ward and Sweeney emphasize that tensile strength alone is insufficient to describe mechanical performance, as ductility and
fracture behavior play a decisive role under dynamic loading. HDPE, characterized by very high elongation at break and
pronounced ductile behavior, exhibits strong resistance to brittle fracture even under rapid loading conditions such as water
hammer. This ductility allows stresses to be redistributed within the polymer matrix, reducing the likelihood of crack initiation.
Polypropylene, depending on its grade, shows moderate to high elongation and a mixed ductile–brittle response, making it
more resistant to sudden fracture than PVC-based materials but less tolerant than HDPE. Conversely, PVC and CPVC, despite
their higher tensile strength, display limited elongation and greater notch sensitivity, which increases their susceptibility to
brittle fracture when exposed to repeated pressure transients. Under water hammer events, this mechanical behavior suggests a
higher risk of microcrack initiation in PVC and CPVC pipes, particularly at defects, joints, or areas affected by aging.
A key concept highlighted in Mechanical Properties of Solid Polymers is the viscoelastic nature of thermoplastics, where
time-dependent deformation and cyclic loading can lead to progressive damage. Water hammer generates short-duration but
high-amplitude stress cycles that, when repeated over the service life of a pipe, may contribute to fatigue and slow crack growth.
HDPE, while highly ductile, is more susceptible to long-term creep; however, its ability to absorb and damp pressure waves
reduces peak stresses during each transient event. Polypropylene exhibits moderate viscoelastic behavior, balancing stiffness
and energy dissipation, which may limit damage accumulation under moderate transient regimes. In contrast, PVC and CPVC,
due to their higher stiffness and lower energy-dissipation capacity, experience higher stress amplitudes during water hammer
events, accelerating fatigue processes at the microscale. This mechanical response is particularly relevant for studies on
microplastic generation, as repeated transient-induced stresses may promote surface degradation and particle release in rigid
polymer pipes over time.
The final experimental setup was constructed using PVC pipes and an HDPE storage tank. However, the system incorporates
a modular test section that can be readily replaced, allowing different pipe materials to be evaluated under identical hydraulic
conditions. A detailed description of the final laboratory model, including its configuration and operational parameters, is
provided in the following chapter.
4. Design of Laboratory Model
4.1. Design for Thesis I
The prototype reproduces hydraulic transients, specifically, water hammer events, through the abrupt closure of valves,
simulating real operating conditions in drinking water distribution systems. Manometers and flowmeters were installed to
monitor pressure and flow during testing. A total of eight tests were conducted under different configurations of pipe diameter
and pump operation. All configurations were tested for structural stability, repeatability of pressure waves, and sampling
feasibility.
The models researched are in the document review made for the last semester. The first prototype was schematized as
follows:
Microplastics in Pipelines: Water Hammer Effects and Identification Protocol Validation
Cardona, S. & Plazas-Tuttle, J.
8
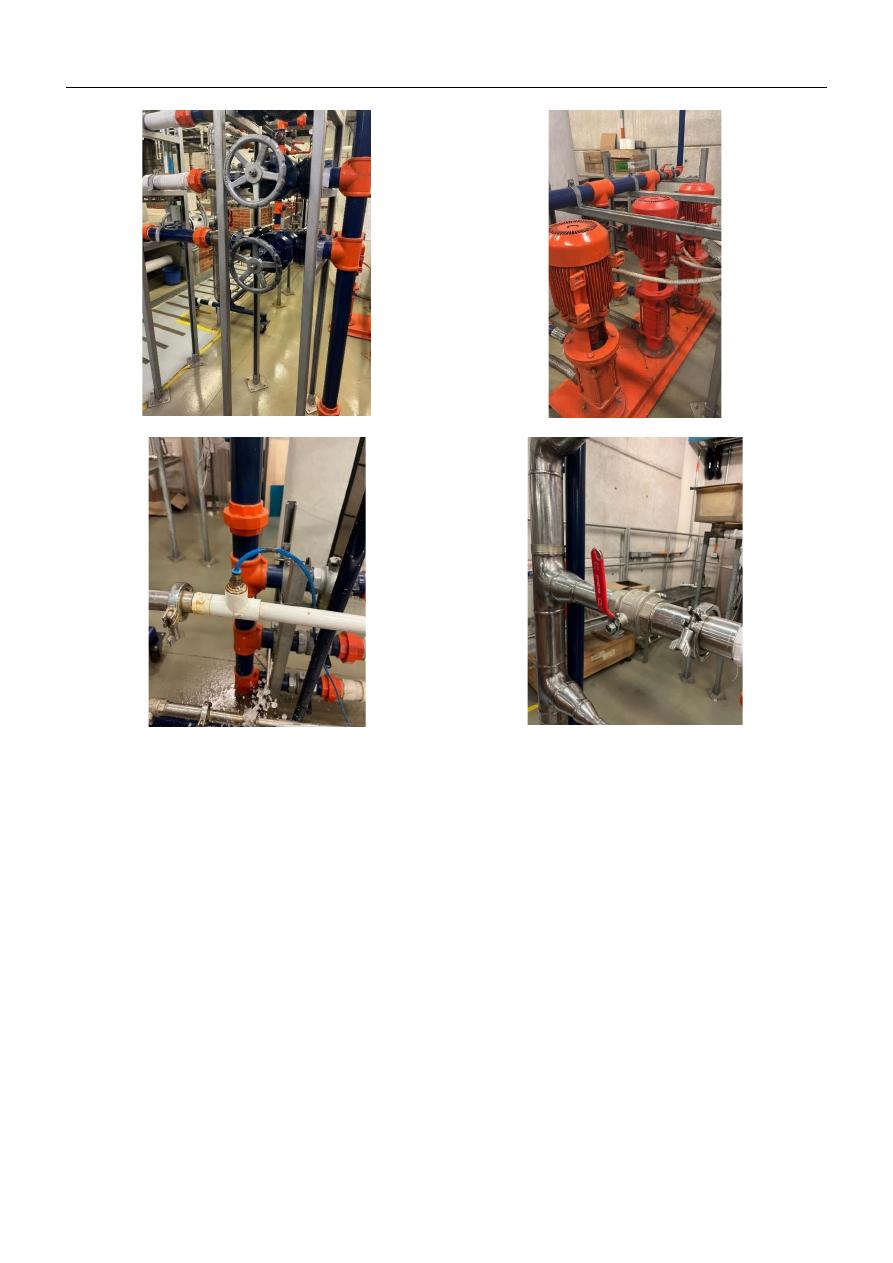
Figure 7. First Physical Prototype
This model had the following components:
Figure 8. Flowmeter Measure
Microplastics in Pipelines: Water Hammer Effects and Identification Protocol Validation
Cardona, S. & Plazas-Tuttle, J.
9
(a)
(b)
(c)
(d)
Figure 9. (a) Globe Valve. (b) Pump System. (c) Prestolock with hose, connected to the differential manometer. (d) Downstream Ball Valve
Microplastics in Pipelines: Water Hammer Effects and Identification Protocol Validation
Cardona, S. & Plazas-Tuttle, J.
10
Figure 10. First Model
As is shown in the figure the place where the contraction is the place where the pipeline could be changed to give different
hydraulic conditions to the water hammer.
A preliminary sample was taken from this model, yet some characteristics were identified. This model was measuring the
pressure far from the contraction. The manometers could be used to calibrate the friction factor inside the model; however the
pressure that could be given by the pumps was bigger than the pressure that could be measurable. That inconvenience was
caused by not reviewing the specifications of the equipment.
The model had a contraction too short, this caused cavitation in the model. The contraction was made in the pipe where the
water hammer is generated to have a length of 50 cm. This length could be much bigger to ensure that the conditions in the
model could be controlled. Then the model must be adjusted to make the length of changeable part the biggest as possible, then
the scheme for the model was changed for the following.
Microplastics in Pipelines: Water Hammer Effects and Identification Protocol Validation
Cardona, S. & Plazas-Tuttle, J.
11
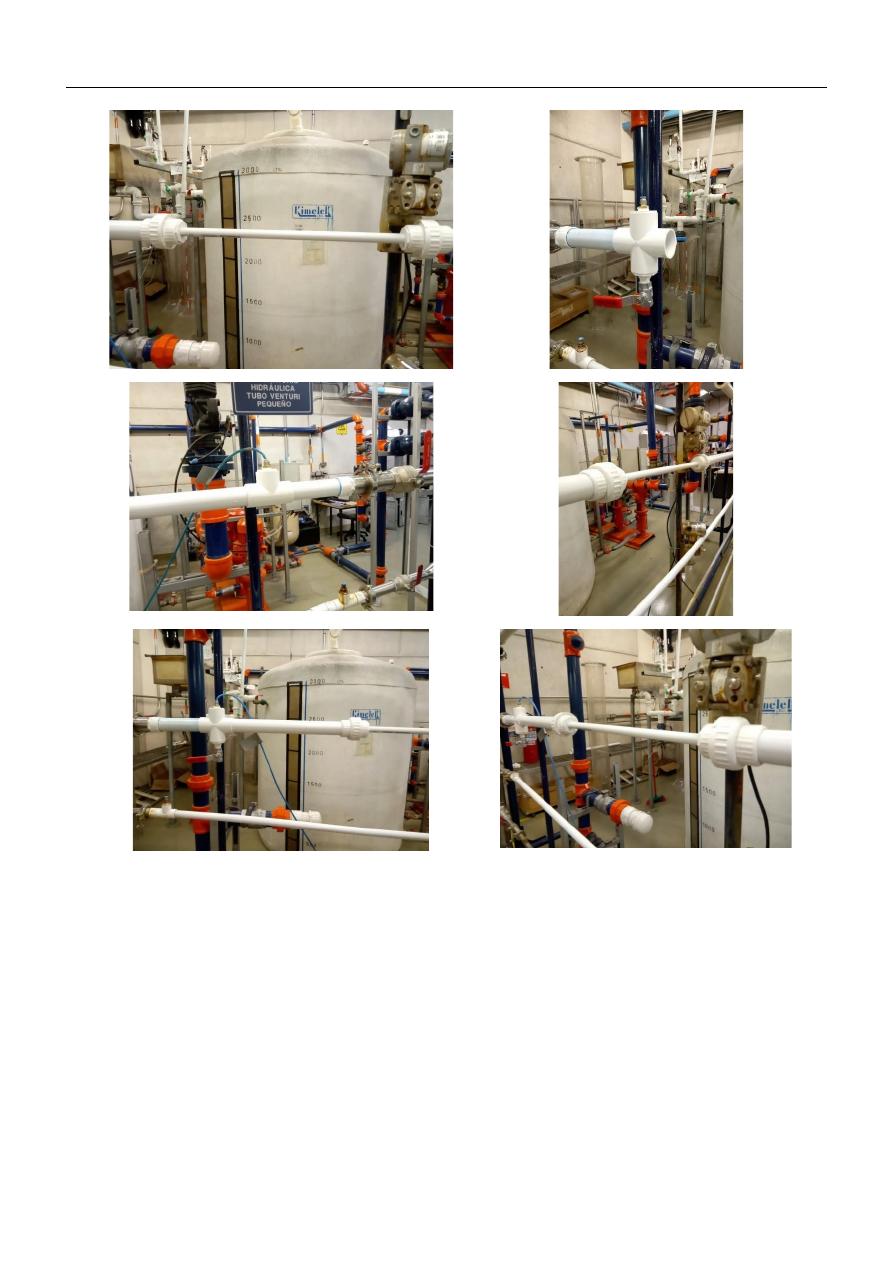
Figure 11. Second prototype
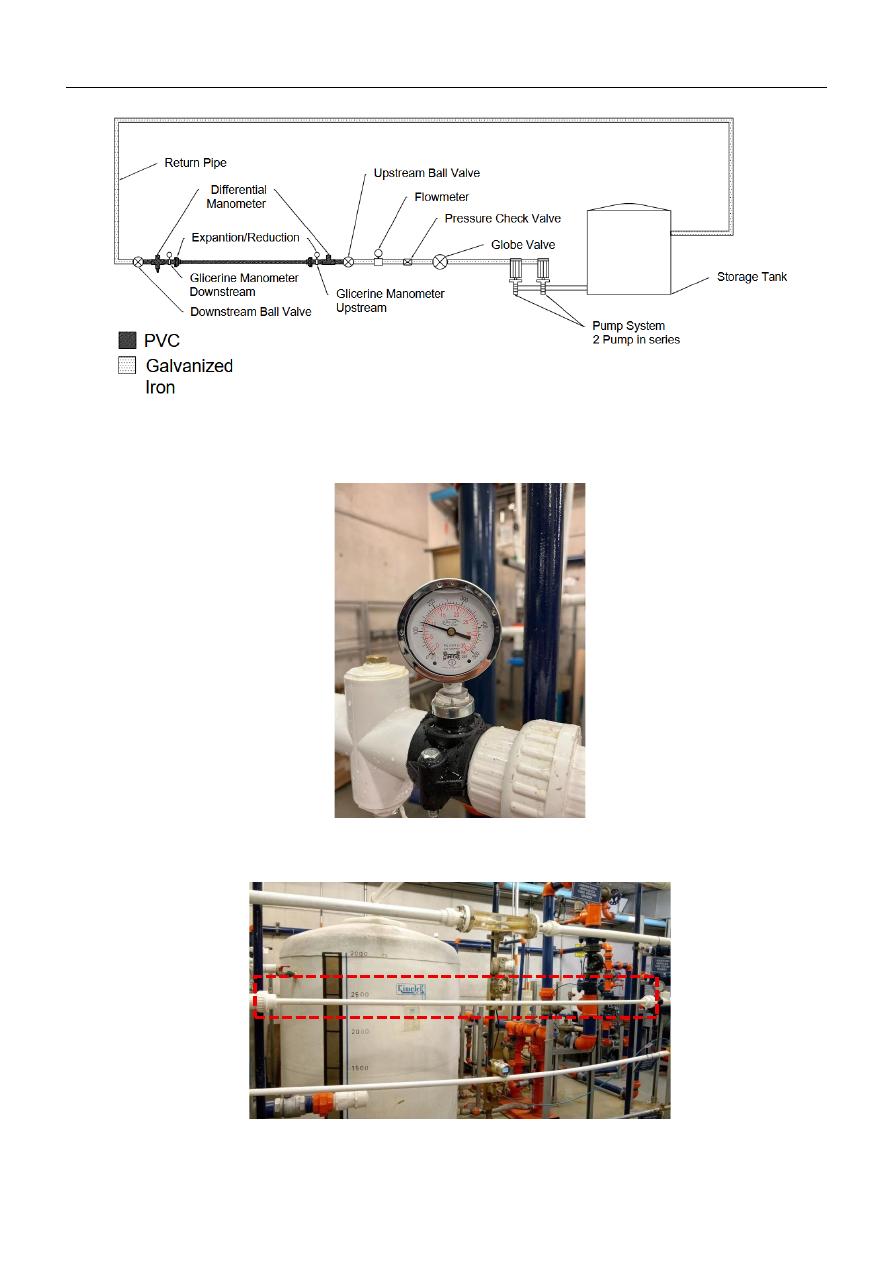
In this second prototype a glycerine manometer was added to the configuration to measure the pressure in the right
scale.
Figure 12. Glycerine Manometer
Also the changeable part was long enough, and cavitation was not an important factor.
Figure 13. In the intermittent it is the pipe (1/2" diameter PVC) that could be changed for the model

Microplastics in Pipelines: Water Hammer Effects and Identification Protocol Validation
Cardona, S. & Plazas-Tuttle, J.
12
This part of the model shown in red can be changed to try different diameters and materials. 4 trials were made with this
configuration. For the diameter of ½” and 1” two tests were made, one with one pump working and the other with 2 pumps,
these change the conditions of the flow as the pressure was always regulated with a pressure check valve that gets a maximum
of 50 PSI that was always reached.
4.2. Design for Thesis II
Para Thesis I se desarrollaron dos modelos diferentes. Uno preliminar el cual buscaba forzar la cavitación en el modelo y
otro en el cual se enfocara a la generación de mocriplásticos a través del golpe de ariete. Con estos y sus resultados se observaron
diversas condiciones que hicieron que se propusiera un modelo completamente nuevo con un sistema de almacenamiento
diferente. Esto implicaría un diseño nuevo con las conexiones de las bombas a un sistema de almacenamiento separado.
Two distinct experimental models were developed in the course of Thesis I. The first, a preliminary configuration, was
designed to intentionally induce cavitation within the system. The second model focused on the generation of microplastics
associated with water hammer events. The results obtained from these configurations allowed the identification of several
limitations, which ultimately motivated the proposal of a redesigned experimental model incorporating a modified storage
configuration. This new design decouples the pumping system from the primary storage tank, enabling improved control of
hydraulic transients and experimental conditions.
The previous model had two issues that had to be corrected to get clear resultsThe first issue with the second prototype was
the presence of scales inside the model. For this the model should be built in plastic pipes. This condition limits the model to
leaving all suction, impulsion, conduction, and return in the same material, which could be affected and degraded in the
generation of water hammer. For this purpose, a test section is left which could be replaceable in diameter and material to
perform different tests and thus evaluate the generation under different conditions.
The second issue with the second prototype is related to the volume stored inside the model. The volume does not ensure a
control sample, as it has several contaminants, as the scales. In turn, due to its size, the storage tank does not allow for optimal
mixing of the microplastics generated in the model. This means that the samples extracted may contain erroneous results
regarding their extraction. Therefore, the storage tank was separated from the rest of the model and suction was implemented
from this 250 L tank to the pumping system using PVC pipes or the material of interest. This would ensure optimal mixing
time and a much shorter retention time.
The model was constructed with a 250-liter storage tank and a PVC suction pipe from the pump to the tank. This tank was
to be placed on an elevated structure to facilitate pumping and ensure the priming of the pump.
Microplastics in Pipelines: Water Hammer Effects and Identification Protocol Validation
Cardona, S. & Plazas-Tuttle, J.
13
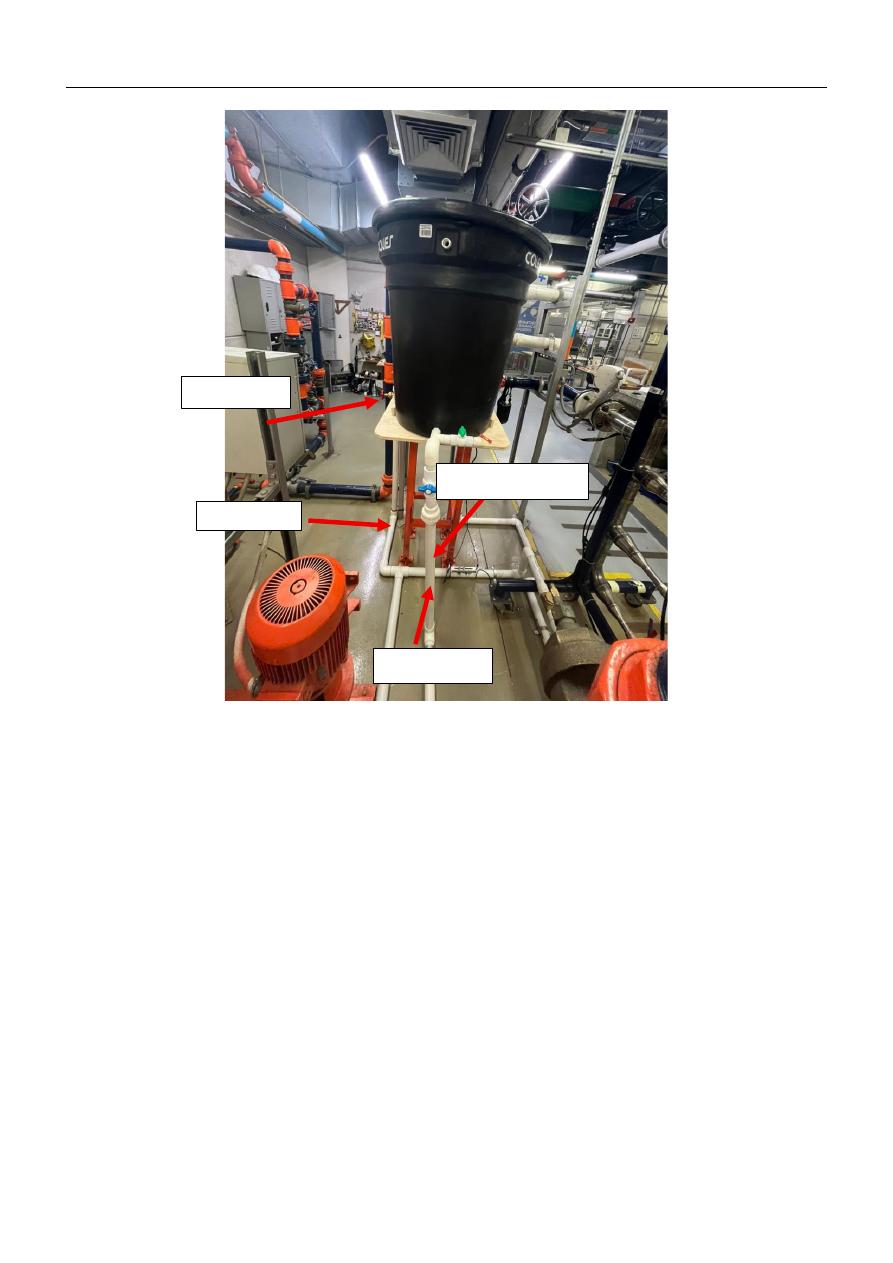
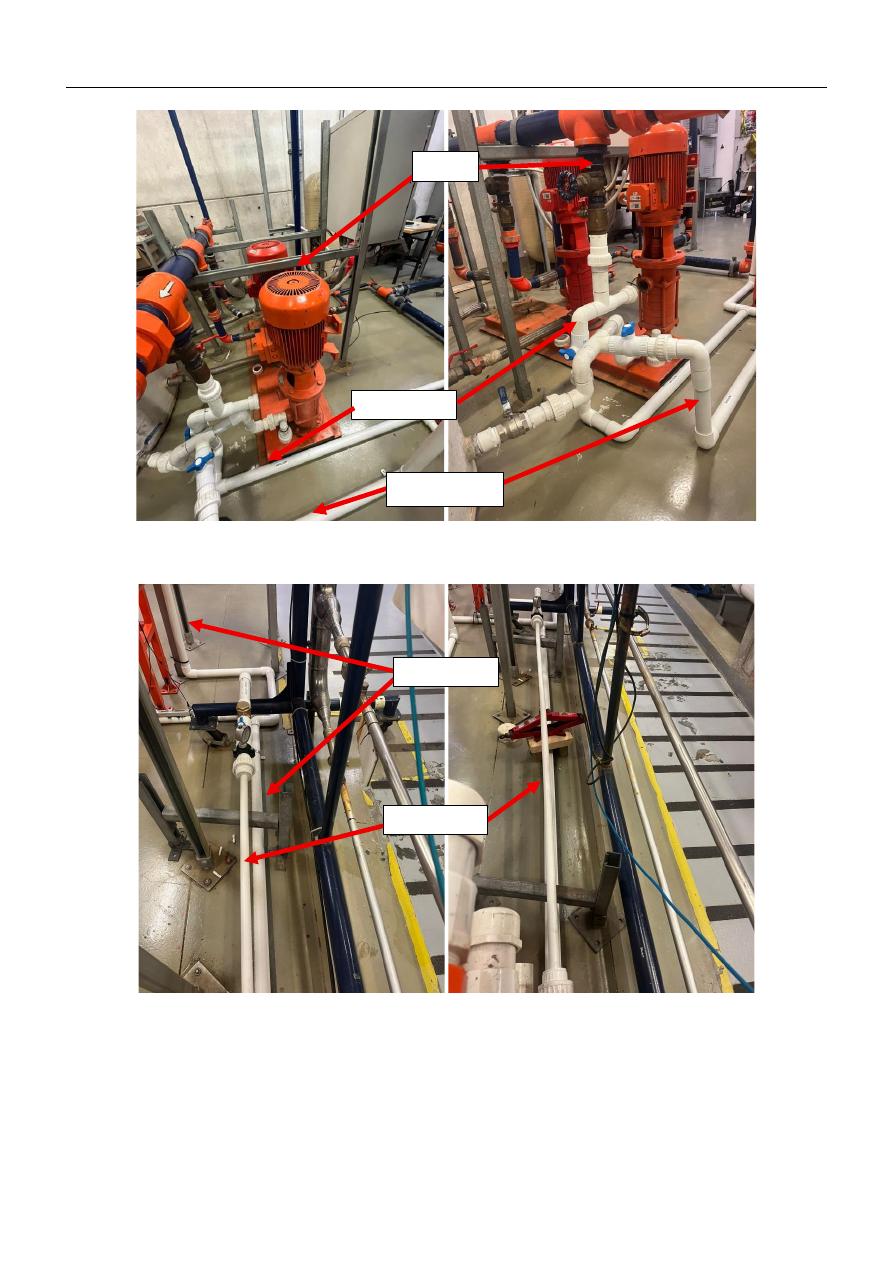
Figure 14. Laboratory Model
A non-intrusive Doppler flow meter was installed in the model. This equipment uses two probes to determine the flow rate
with a high degree of accuracy. This flow meter can be seen in the image above. The figure above also shows three pipes. The
one coming out of the front of the tank is the suction pipe, which carries the flow from the tank to the pump. The bypass pip e
runs up the side of the tank. This pipe has two main functions. The first is to regulate the flow rate, allowing it to be adjusted
so that the tests can have different hydraulic characteristics. The second is to act as a water hammer damper for the pump. This
bypass allows the flow to be diverted through this pipe and discharged completely into the storage tank when water hammer
occurs. This prevents the pumps from overheating due to a complete stoppage of the flow. There is also the discharge pipe.
This pipe carries the flow to the test section. After the test section, there is the return pipe, which transports the water after the
test section to the storage tank.
By Pass Pipe
Suction Pipe
Discharge Pipe
Doppler Flow meter
Microplastics in Pipelines: Water Hammer Effects and Identification Protocol Validation
Cardona, S. & Plazas-Tuttle, J.
14
Figure 15. Pump and connections
The model is designed so that different parts can be replaced and changed in terms of material or size if required.
Figure 16. Test Section
The figure shows two parallel pipes, one resting on the metal structure and the other on the ground. The pipe on the structure
corresponds to the test section, which has several accessories to easily change the material or size of the pipe. It also has pressure
gauges that record the pressure before and after the water hammer. Before the test section, there is a check valve to prevent
backflow in the system after the water hammer, which pressurizes the test section after the water hammer. There are also ball
valves before and after the test sections. The valve after the test section generates the water hammer by closing suddenly, and
the valve before the test section serves to seal the test section and take the sample for analysis.
Suction Pipe
Return Pipe
Test Section
Pump
Discharge pipe

Microplastics in Pipelines: Water Hammer Effects and Identification Protocol Validation
Cardona, S. & Plazas-Tuttle, J.
15
5. Process
The sample analysis and extraction procedure consists of three main stages: microplastic generation, extraction, and
identification. The proposed protocol was developed based on the physical laboratory models and was tailored to the available
hydraulic conditions and water quality characteristics of the experimental system.
5.1. Generation
To simulate microplastic formation induced by hydraulic transients, a pressurized hydraulic model was constructed using
two 6 HP pumps. The system was designed to generate controlled water hammer events within interchangeable pipe sections
manufactured from PVC, HDPE, polypropylene (PP), or chlorinated PVC (C-PVC).
For each experimental trial, a 250 L storage tank was filled with tap water. Upon completion of each test, the water was
discharged into the recirculation system of the hydraulics laboratory. Prior to microplastic generation, the system was prepared
by fully opening all valves and initiating pump operation. The flow was allowed to stabilize under steady-state conditions,
ensuring the absence of leaks, blockages, or abnormal pressure losses throughout the pipeline.
Before inducing water hammer, the hydraulic system was characterized to establish baseline conditions. This
characterization was performed by gradually closing the bypass valve while measuring flow rates and pressure values upstream
and downstream of the test section. Incremental adjustments of the bypass valve, combined with corresponding flow and
pressure measurements, allowed for the estimation of the pipe roughness coefficient based on the known geometric and material
properties of the pipeline. This step was critical to document the initial hydraulic condition of the pipe prior to any degradation
associated with transient loading.
Following system characterization, water hammer generation was initiated. The bypass gate valve was progressively closed
until a slight pressure buildup was observed at the bypass outlet connected to the storage tank. The system was then operated
for five minutes to ensure adequate mixing and homogenization of the circulating water volume. Subsequently, the pumps were
turned off and a 200 mL water sample was collected to serve as the pre–water hammer reference sample for microplastic
analysis.
The pumps were then restarted, and after an additional five-minute stabilization period, the first water hammer event was
generated. Immediately prior to each transient event, flow velocity was measured using a Doppler flowmeter, and pressures
were recorded using installed manometers. Water hammer was induced by the abrupt closure of the downstream valve of the
test section, while a check valve located upstream limited reverse flow and protected the system. A total of five water hammer
events were generated, each separated by five-minute intervals. During these events, excess pressure was relieved through the
bypass line to protect the pumps from over-pressurization.
After completion of the five water hammer cycles, the pumps were turned off and a second 200 mL water sample was
collected from the system. Both pre- and post-water hammer samples were subsequently processed following the microplastic
extraction and identification procedures described in the corresponding section.
Finally another diameter of pipe or material can be used for the next generation of water hammer.
Following the experimental tests, the pipe must be recharacterized using the same procedure applied during the initial
hydraulic characterization in order to recalculate the pipe roughness coefficient. Any variation in the estimated roughness may
indicate internal degradation or abrasion of the pipe wall induced by repeated water-hammer events. In addition, it is
recommended to dismantle the pipe after testing and perform direct surface analyses using techniques such as optical
profilometry or confocal laser scanning microscopy to quantitatively assess changes in internal surface roughness.
5.2. Extraction
For each sample of 200 ml some process should be made. There 5 steps for the extraction.
The procedure consists of five sequential steps: (i) filtration to concentrate suspended solids; (ii) organic digestion of the
retained solids; (iii) mixing of the digested material with a zinc chloride solution for density separation; (iv) extraction of the
resulting supernatant; and (v) dilution of the supernatant prior to microplastic identification.
The objective of this protocol is to extract microplastics from samples collected from the hydraulic model. Pre- and post-
experiment samples are processed in parallel and subjected to identical treatment to ensure comparability before proceeding to
the identification stage.
i.
Filtration
The following materials are required for the filtration step:
• Vacuum glass filtration flasks.
• Vacuum hose.
• Cellulose nitrate membrane filter with a pore size of 0.45 µm.
Microplastics in Pipelines: Water Hammer Effects and Identification Protocol Validation
Cardona, S. & Plazas-Tuttle, J.
16
• 250 mL Erlenmeyer flask.
•
200 mL water sample collected from the physical model.
For filtration, the cellulose nitrate membrane is placed in the filtration apparatus and connected to the vacuum system. The
sample is then poured slowly and continuously into the filtration funnel to avoid adhesion of suspended solids to the vessel
walls. After the entire volume has been filtered, the membrane containing the retained solids is carefully removed and
transferred to a 250 mL Erlenmeyer flask, while the filtrate is discarded. This procedure allows for the collection of all particles
larger than 0.45 µm present in the sample.
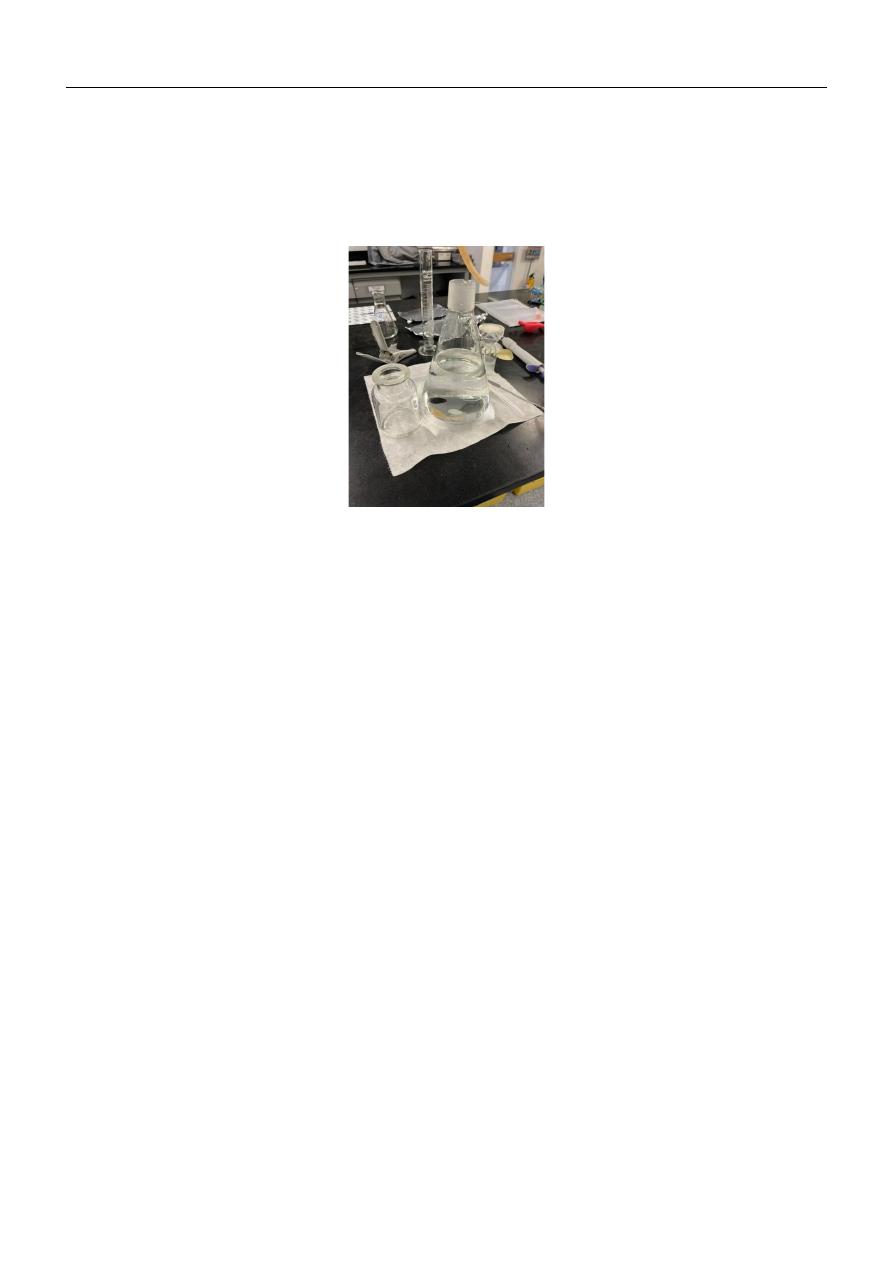
Figure 17. Filtration kit for extraction
ii.
Organic Digestion
The following tools and reagents are required for the digestion step:
• 100 mL of deionized water.
• 20 mL of 50% hydrogen peroxide (H₂O₂).
• Laboratory oven.
• Erlenmeyer flask containing the membrane filter with retained solids.
• Aluminum foil.
• Sonicator.
For digestion, 100 mL of deionized water and 20 mL of hydrogen peroxide are added to the Erlenmeyer flask containing the
membrane filter. The flask is sonicated for 5 minutes to detach solids adhering to the filter surface, as preliminary tests showed
that residual adhesion could retain potential microplastic particles. Following sonication, the Erlenmeyer flask is loosely
covered with aluminum foil perforated with small holes to allow gas release and then placed in a laboratory oven at 60 °C for
24 hours.
This digestion step is intended to degrade organic matter present in the sample or coating the retained solids. Effective
removal of organic material is essential for subsequent identification, as organic compounds can produce interfering Raman
signals that obscure or contaminate the spectra of microplastic particles.
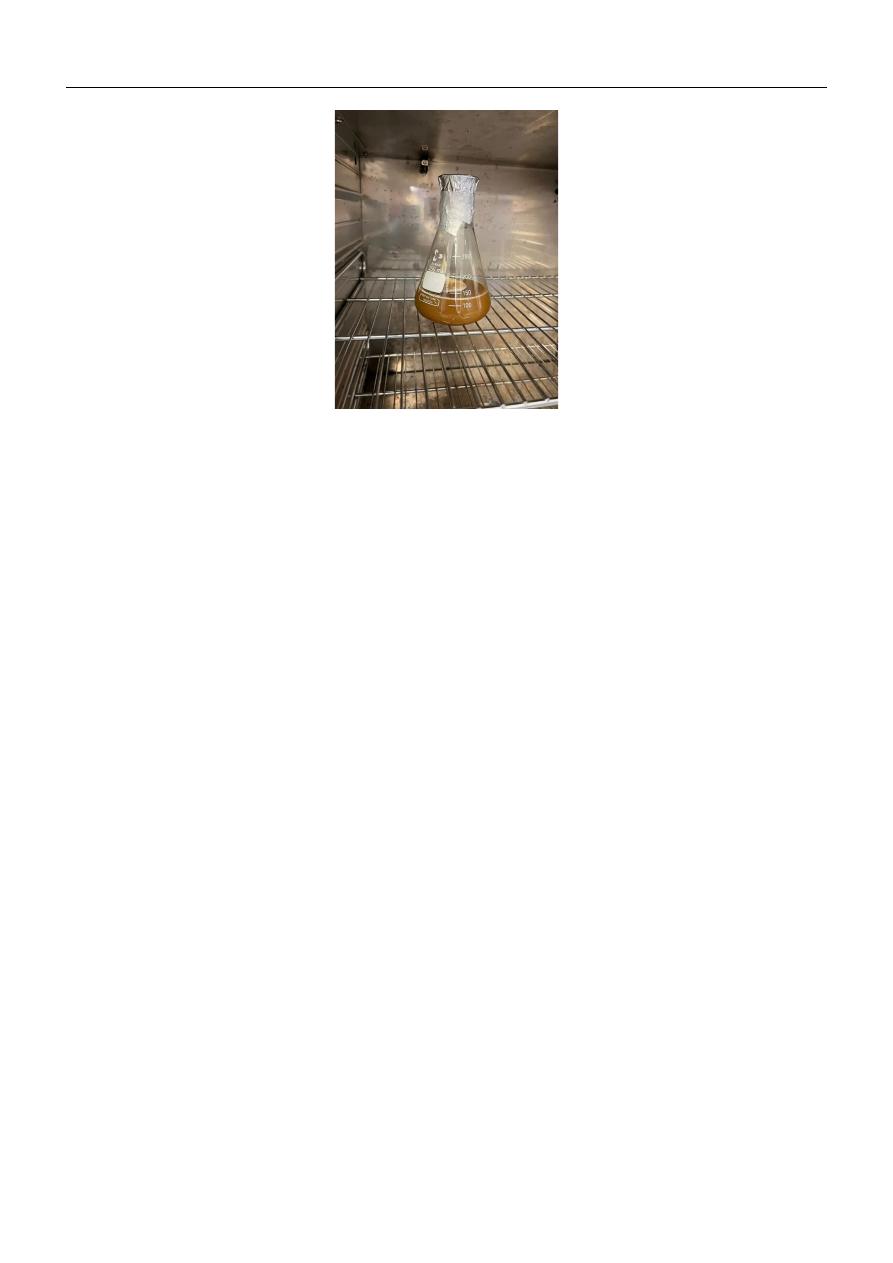
As illustrated in the corresponding Figure 18, early samples exhibited high turbidity and coloration during digestion. These
effects were eliminated after modifications to the hydraulic model, and were no longer observed in the final samples analyzed.
Microplastics in Pipelines: Water Hammer Effects and Identification Protocol Validation
Cardona, S. & Plazas-Tuttle, J.
17
Figure 18. Sample before digestion
iii.
Density Separation
For the density separation step, the following materials and reagents are required:
• 45 g of zinc chloride (ZnCl₂).
• 30 mL of deionized water.
• Vacuum filtration apparatus.
• Vacuum hose.
• Cellulose nitrate membrane filter with a pore size of 0.45 µm.
• Erlenmeyer flask containing the digested sample.
• Clean 250 mL Erlenmeyer flask.
• Magnetic or mechanical mixer.
• Sonicator.
Once the digestion step is complete, the filtration procedure is repeated following the same protocol used for the initial
filtration. The membrane filter used during digestion is discarded, ensuring that no residual solids remain adhered to it. The
digested solution is then filtered using the vacuum filtration apparatus equipped with a new 0.45 µm cellulose nitrate membrane.
After filtration, the membrane containing the retained solids is transferred to a clean 250 mL Erlenmeyer flask. Subsequently,
45 g of zinc chloride and 30 mL of deionized water are added to the flask, yielding a ZnCl₂ solution with a mass ratio of
approximately 1.5:1 (ZnCl₂:water). The mixture is gently agitated using a mixer to promote dissolution and then placed in a
sonicator for 30 minutes to ensure complete dispersion of particles and homogenization of the solution.
The resulting ZnCl₂ solution has an estimated density in the range of 1.6–1.8 g/cm³, which enables effective density
separation of microplastics. Common polymers present in the samples, such as PVC (≈1.2–1.4 g/cm³), polypropylene (≈0.90
g/cm³), and HDPE (≈0.90–1.00 g/cm³), have lower densities than the solution and therefore remain suspended or float in the
upper phase, while denser inorganic particles settle.
Following mixing, the Erlenmeyer flask is left undisturbed to allow mineral and other high-density particles to precipitate,
thereby facilitating subsequent recovery of microplastics from the supernatant.
iv.
Supernatant extraction
The following tools are required for supernatant extraction:
• 10 mL test tube.
• 10 mL pipette.
• Pipette bulb.
• Erlenmeyer flask containing the density-separated sample.
To extract the supernatant, the pipette fitted with a bulb is carefully inserted into the Erlenmeyer flask, which contains the
microplastics concentrated in the upper phase following density separation. A volume of 10 mL of the supernatant is gently
withdrawn, taking care not to disturb the settled material at the bottom of the flask. This supernatant represents the fraction
enriched in microplastics and is expected to contain most particles with densities lower than that of the ZnCl₂ solution.
Microplastics in Pipelines: Water Hammer Effects and Identification Protocol Validation
Cardona, S. & Plazas-Tuttle, J.
18
The collected 10 mL aliquot therefore contains microplastics in a diluted form and is subsequently used for further processing
and identification.
v.
Dilution
For the dilution step, the following materials are used:
• Four 125 mL Erlenmeyer flasks, each containing 90 mL of deionized water.
• A 10 mL graduated cylinder containing the extracted supernatant.
To prepare the dilutions, a serial dilution procedure is performed to obtain concentrations suitable for microplastic
identification. First, 10 mL of the extracted supernatant is transferred into an Erlenmeyer flask containing 90 mL of deionized
water, producing a 1:10 dilution. Subsequently, 10 mL of this diluted solution is transferred into a second Erlenmeyer flask
containing 90 mL of deionized water to obtain a 1:100 dilution. This serial dilution process is repeated until a final dilution of
1:10,000 is achieved.
Adequate dilution is critical for microplastic identification, as the analytical procedure involves filtering the sample onto a
1 cm² membrane. Excessive particle loading can lead to filter saturation, hindering particle discrimination and spectral analysis.
Therefore, the applied dilution factors are explicitly accounted for during the quantification of microplastics.
Finally, the Erlenmeyer flasks containing the 1:10,000 dilutions (total volume of 100 mL) corresponding to the pre- and
post-experiment samples are selected for subsequent filtration and microplastic analysis.
5.3. Identification
Microplastic identification is performed using Raman spectroscopy with a HORIBA confocal Raman microscope coupled
with ParticleFinder software. Identification is carried out on silica membrane filters onto which the microplastic particles are
deposited.
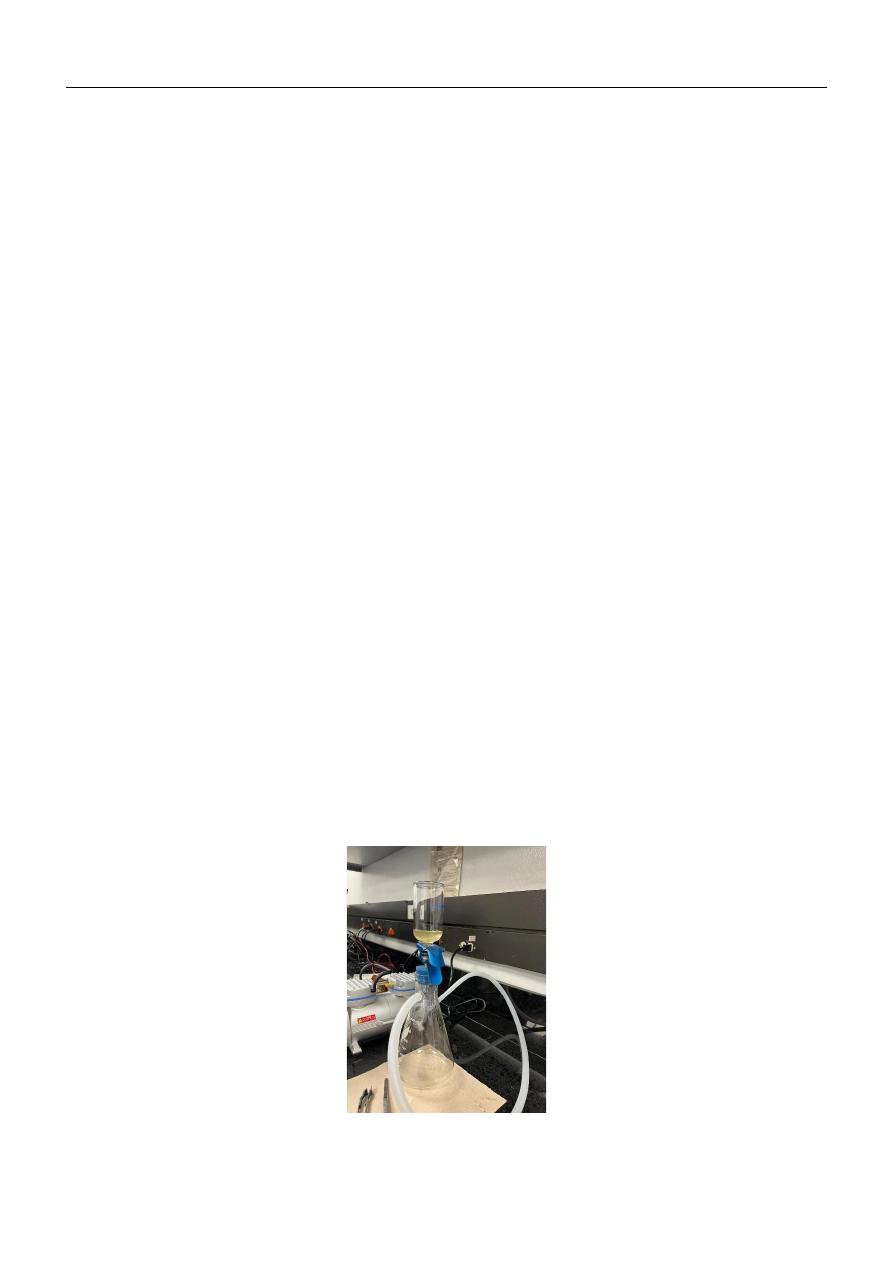
For each sample (pre- and post-experiment), the diluted supernatant is filtered through a dedicated silica filter using a vacuum
filtration system, as illustrated in Figure 19. Proper dilution is essential to prevent filter clogging and particle overlap, as shown
in Figure 20. Pre- and post-experiment samples are filtered separately using individual filters to avoid cross-contamination.
Following filtration, the filters are dried in a laboratory oven at 60 °C for 24 hours to remove residual moisture, which can
otherwise distort Raman spectra. This drying step was found to significantly improve spectral quality. Each silica filter is used
only once, as cleaning procedures were insufficient to eliminate residual contamination; although this increases consumable
costs, it ensures data integrity.
After drying, each filter is placed on the HORIBA microscope stage for particle identification. For analysis, a 500 µm × 500
µm analysis window is defined, and a total of sixteen such windows are analyzed per filter. These areas are selected in regions
with visibly higher particle concentrations to ensure comparable analytical conditions between pre- and post-samples. All
particles within each window are analyzed, regardless of their nature. Non-plastic particles, such as cellulose nitrate filter
residues or zinc chloride crystals, are readily distinguished and excluded based on their Raman spectra.
Due to instrument availability and analysis time (approximately two hours per sample pair), pre- and post-samples can
currently be processed at a maximum frequency of once per week, representing the main bottleneck of the experimental
workflow. To address this limitation, specialized training of the researcher in microscope operation is proposed, enabling
extended instrument use and increasing the number of samples analyzed per week in accordance with the protocol requirements.
Figure 19. Identification filtration system
Microplastics in Pipelines: Water Hammer Effects and Identification Protocol Validation
Cardona, S. & Plazas-Tuttle, J.
19
Figure 20. Silicate Filter placement
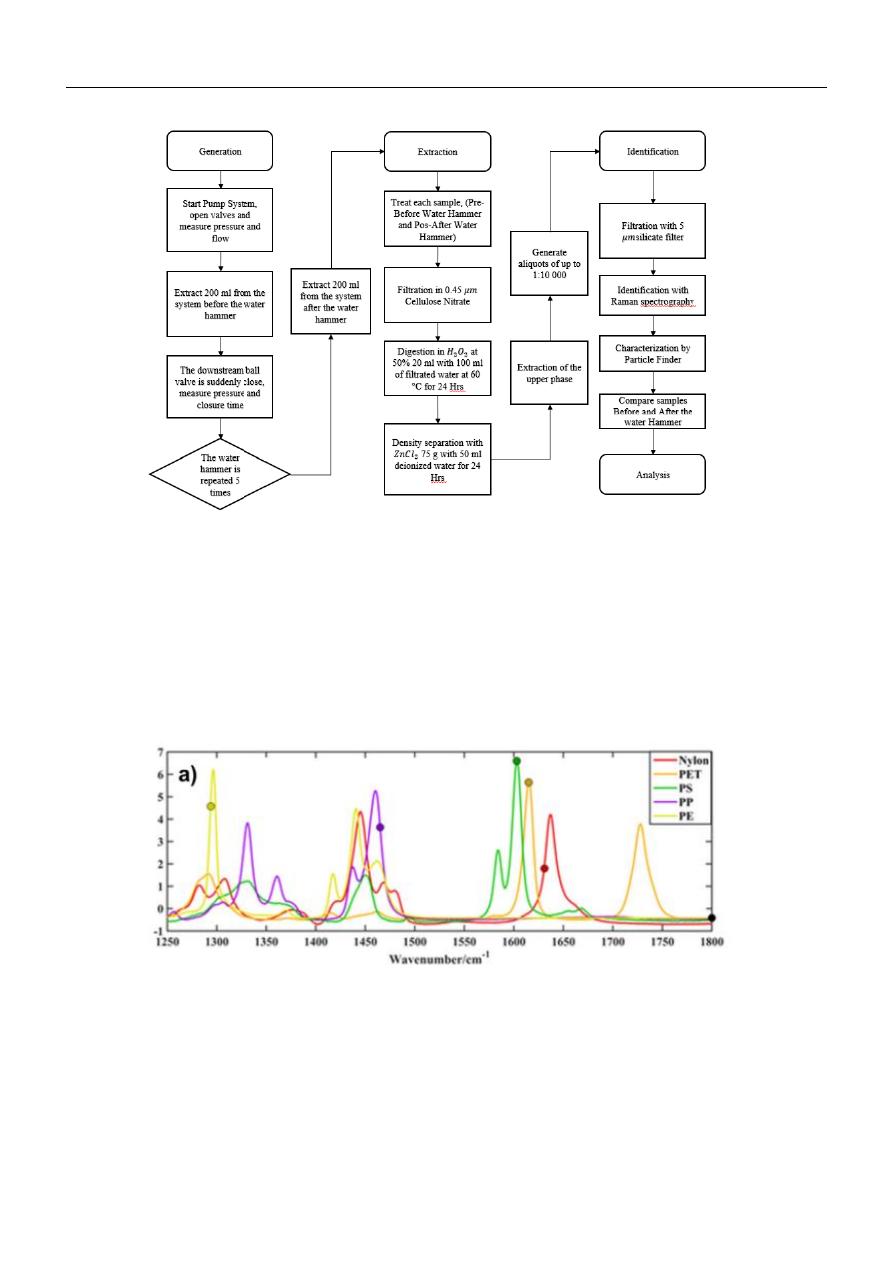
Figure 21. Particle Finder Software
Microplastics in Pipelines: Water Hammer Effects and Identification Protocol Validation
Cardona, S. & Plazas-Tuttle, J.
20
Figure 22. Flow Diagram
6. Discussion
6.1. Trials
The detection of the particles was made for each sample. The identification is based in the Raman Spectrography, in which
the specter of the sample is compared to the characteristic bands of reflection of each material. During identification, a thorough
characterization of the particles present in the analysis sample is performed, involving morphology and material.
Figure 23. Typical specters for plastics
(Araujo et al., 2018)
Raman spectroscopy is a non-destructive analytical technique used to study vibrational, rotational, and other low-frequency
modes in a system, providing a molecular fingerprint of materials. It works by shining a monochromatic laser light onto a
sample and detecting the inelastically scattered light, which contains shifts in energy corresponding to the vibrational modes of
the molecules. These energy shifts, known as Raman shifts, reveal detailed information about the chemical composition,
molecular structure, and interactions within the sample. Raman spectroscopy is widely used in chemistry, materials science,
biology, and pharmaceuticals for both qualitative and quantitative analysis.
Microplastics in Pipelines: Water Hammer Effects and Identification Protocol Validation
Cardona, S. & Plazas-Tuttle, J.
21
Experimental tests were conducted in two distinct phases corresponding to the two stages of the thesis. During the first phase
(Thesis I), experiments were performed using an existing hydraulic model that was adapted and implemented in the hydraulics
laboratory. Based on the results and limitations identified in this initial phase, the experimental setup was subsequently
improved by designing and constructing a new hydraulic model, which was connected to the same pumping system.
In the second phase (Thesis II), the refined model enabled improved control of experimental conditions and the testing of
additional configurations, including alternative pipe materials and model adaptations. As a result, the proposed experimental
protocol was applied to a broader and more robust set of samples in this phase. Table 1. Samples Tested Thesis I summarizes
the tests conducted during Thesis I, while Table 2. Samples Tested Thesis II presents the tests carried out during Thesis II.
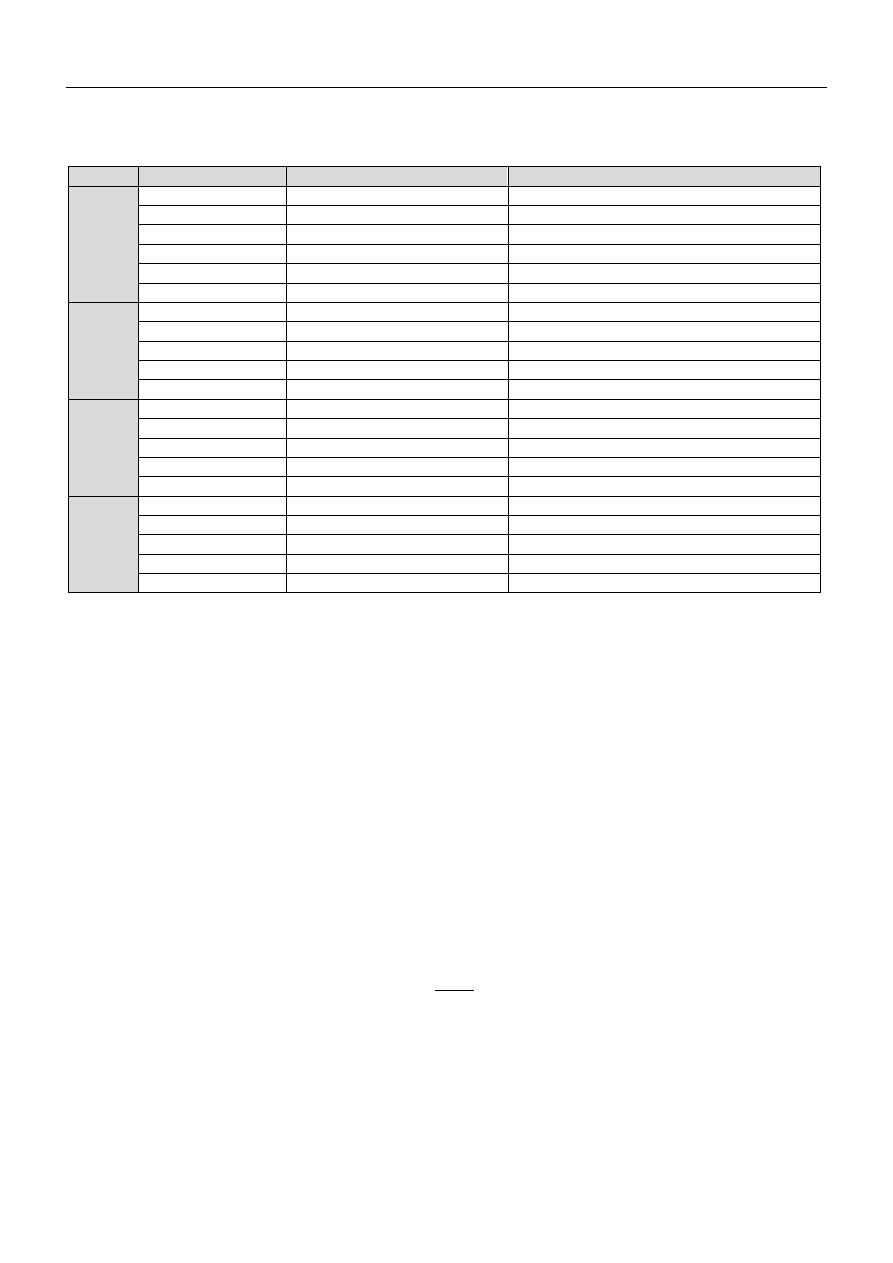
For each sample there was an analysis in the identification. The samples taken are the following for thesis I:
Sample
Characteristics
White Sample
Sample of the water that fills the model
Preliminar Sample
Sample with one water hammer
½” and 2 Pumps
Sample in a PVC pipe with a nominal pressure of 200
PSI with a diameter of ½” and both pumps working
½” and 1 Pump
Sample in a PVC pipe with a nominal pressure of 200
PSI with a diameter of ½” and one pump working
1” and 2 Pumps
Sample in a PVC pipe with a nominal pressure of 200
PSI with a diameter of 1” and both pumps working
1” and 1 Pump
Sample in a PVC pipe with a nominal pressure of 200
PSI with a diameter of 1” and one pump working
Table 1. Samples Tested Thesis I
For Thesis II the sample taken were the following:
Sample
Characteristics
Pre PVC 1”
Sample taken before the water hammer
Post PVC 1”
Sample taken after the water hamer
Pre PVC ½”
Sample taken before the water hammer
Post PVC ½”
Sample taken after the water hamer
Pre PVC ¾”
Sample taken before the water hammer
Post PVC ¾”
Sample taken after the water hamer
Pre C-PVC ½”
Sample taken before the water hammer
Post C-PVC ½”
Sample taken after the water hamer
Pre C-PVC ¾”
Sample taken before the water hammer
Post C-PVC ¾”
Sample taken after the water hamer
Pre PP ½”
Sample taken before the water hammer
Post PP ½”
Sample taken after the water hamer
Pre PP ¾”
Sample taken before the water hammer
Post PP ¾”
Sample taken after the water hamer
Pre HDPE 1”
Sample taken before the water hammer
Post HDPE 1”
Sample taken after the water hamer
Pre HDPE ½”
Sample taken before the water hammer
Post HDPE ½”
Sample taken after the water hamer
Table 2. Samples Tested Thesis II
For all defined samples, a flow rate of 2.5 L and a working pressure of 344 kPA were used, which were the conditions
provided by the pump.
For the samples corresponding to Thesis II, both pre- and post-experiment samples were collected. The protocol was
modified to require microplastic quantification before and after the water-hammer event, ensuring a robust comparison between
baseline and post-degradation conditions. This approach allows the effects of water hammer to be isolated from other
experimental variables and enables proper normalization of results across tests with differing conditions, such as pipe material,
diameter, flow rate, and operating pressures.
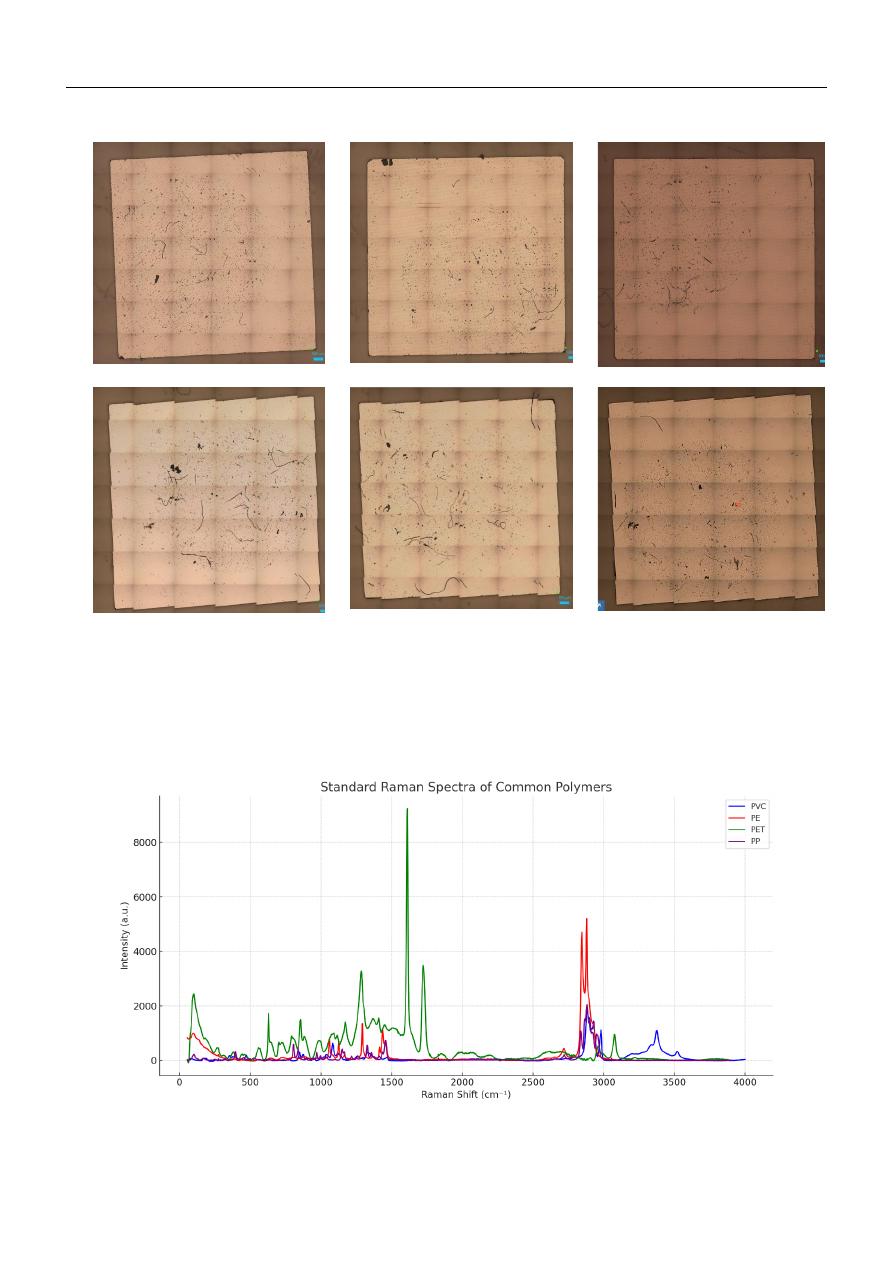
Each sample had an image where the analysis was made this are the images:
Microplastics in Pipelines: Water Hammer Effects and Identification Protocol Validation
Cardona, S. & Plazas-Tuttle, J.
22
Post 1” PVC
Pre ½” PVC
Post ¾”
White Sample
Preliminary Test
1” 2B PVC
Figure 24. Images of the HORIBA Microscope
The it was important to look to the particles that could have a resemblance to the particles of the standards of microplastic
that had been seen.
Then the particles where trialed with the particle finder and the spectra would be categorized according to the standard
spectra observed.
To identify according the spectra, the standards of some microplastics were trialed and produced.
Figure 25. Standard Spectrum
Microplastics in Pipelines: Water Hammer Effects and Identification Protocol Validation
Cardona, S. & Plazas-Tuttle, J.
23
However for the investigation the most important microplastic would be the one of the material, as PVC, PP or PE. C-PVC.
The bands to determine each of the material are the following. This identification is completely cualitative article by particle.
Polymer Raman band (cm⁻¹)
Main vibrational assignment
Diagnostic relevance
PVC
610–640
C–Cl stretching
Primary diagnostic band for PVC
695
C–Cl deformation
Confirms chlorinated polymer
960–980
C–C stretching
Supporting band
1095–1145
C–C stretching
Supporting band
1430–1450
CH₂ bending
Common polymer band
2910–2970
C–H stretching
Supporting band
CPVC
630–700
C–Cl stretching (broader/shifted)
Primary diagnostic band (higher chlorination)
960–1000
C–C stretching
Supporting band
1100–1150
C–C stretching
Supporting band
1430–1450
CH₂ bending
Common polymer band
2900–2970
C–H stretching
Supporting band
PP
840–850
CH₃ rocking
Primary diagnostic band for PP
973–999
C–C stretching
Supporting band
1160–1180
C–C stretching
Supporting band
1450–1460
CH₃ asymmetric bending
Distinguishes PP from PE
2880–2950
C–H stretching (CH₃ dominant)
Strong confirmation
HDPE
1060–1065
C–C stretching (crystalline PE)
Primary diagnostic band
1128–1132
C–C stretching (crystalline PE)
Strong confirmation
1295
CH₂ twisting
Supporting band
1440–1450
CH₂ bending
Distinguishes from PP
2848–2880
C–H stretching (CH₂)
Supporting band
Table 3. Bands for identification for each material
6.2. Quantificaction
Based on the conditions evaluated in the experimental tests, an estimate of uncertainty was obtained using a Poisson
statistical model. This model is intended to provide an order-of-magnitude estimate of the number of microplastic particles
generated during each test, rather than serving as a basis for definitive conclusions. Accordingly, the quantification approach
is used as a supporting analytical tool to contextualize the results. The quantification analysis is performed as follows:
Raman analysis produces non-negative integer counts of MPs within each scanned window. Under the assumptions that
MPs are randomly distributed within the deposited area at the scale of the 500 × 500 µm window, and (b) each particle’s
presence in the window is independent of other particles, the count in a given window can be modeled as a realization of a
Poisson process. The Poisson model is standard for rare-particle events observed in fixed-area subsamples.
i. Poisson distribution and properties
Let
𝑌
𝑖
denote the MP count observed in window
𝑖(area 𝑎
𝑤
). The Poisson distribution is defined as:
𝑌
𝑖
∼ Poisson(𝜆)
(5)
where
𝜆 > 0is the expected number of MPs per Raman window in the final working deposit. The probability of observing
exactly
𝑦particles in a window is:
Pr (𝑌
𝑖
= 𝑦) =
𝑒
−𝜆
𝜆
𝑦
𝑦!
, 𝑦 = 0,1,2, …
(6)
Key properties enabling inference are:
a. Mean equals the rate
𝔼[𝑌
𝑖
] = 𝜆
(7)
b. Variance equals the mean
Var(𝑌
𝑖
) = 𝜆
(8)

Microplastics in Pipelines: Water Hammer Effects and Identification Protocol Validation
Cardona, S. & Plazas-Tuttle, J.
24
c. Additivity
If windows are independent, the sum ∑
𝑌
𝑖
𝑘
𝑖=1
is also Poisson with parameter
𝑘𝜆.
These properties justify estimating
𝜆using the sample mean of the 16 windows.
ii. Estimation of MPs in the original 200 mL sample
Area-based up-scaling
The deposit area is
𝑎
𝑑
= 1 cm
2
= 10,000
2
𝜇𝑚
2
.
Each Raman window has
𝑎
𝑤
= 500 × 500 𝜇𝑚
2
.
Thus, the fraction of the deposit scanned by one window is:
𝑓
𝑎𝑟𝑒𝑎
=
𝑎
𝑤
𝑎
𝑑
(9)
and the deterministic area expansion factor is:
𝐴 =
1
𝑓
𝑎𝑟𝑒𝑎
(10)
Numerically,
𝐴 = 400, meaning each observed particle corresponds to an expected 400 particles across the full deposit of
the final working sample.
Dilution-based up-scaling
Because the final working 100 mL suspension contains
1/𝐷 of MPs originally present in 200 mL, the scaling back to the
raw sample is performed by multiplying by the dilution factor
𝐷 = 10 000.
Point estimator
Let
𝑦
1
, … , 𝑦
16
be the measured counts per window. The estimated mean count per window is:
𝑦ˉ =
1
16
∑ 𝑦
𝑖
16
𝑖=1
(11)
The estimated total MPs in the original 200 mL sample is:
𝑁
̂ = 𝐷 𝐴 𝑦ˉ
(12)
Given the two-condition experiment:
Before:
𝑁
̂
𝑏
= 𝐷𝐴𝑦ˉ
𝑏
After:
𝑁
̂
𝑎
= 𝐷𝐴𝑦ˉ
𝑎
The estimated number of MPs generated is:
Δ𝑁
̂ = 𝑁̂
𝑎
− 𝑁
̂
𝑏
= 𝐷𝐴(𝑦ˉ
𝑎
− 𝑦ˉ
𝑏
)
(13)
iii. Bias correction retained in the protocol
Even with random coordinates, a conservative bias-correction step is included to account for any residual non-
representativeness due to subtle operator effects (e.g., excluding windows with spectral artifacts) or minor heterogeneity. The
correction is implemented through stratified weighting across the 16-cell grid:
a. Classify cells a priori into two strata based on objective, coarse deposit features visible under low magnification:
o higher-density stratum 𝐻(e.g., outer ring / flow path)
o lower-density stratum 𝐿
b. Let
𝑝
𝐻
be the fraction of deposit area belonging to
𝐻, determined by grid area count (number of cells in 𝐻/ 16 that has
a high density of microplastics). Then
𝑝
𝐿
= 1 − 𝑝
𝐻
.

Microplastics in Pipelines: Water Hammer Effects and Identification Protocol Validation
Cardona, S. & Plazas-Tuttle, J.
25
c. Compute stratum means:
𝑦ˉ
𝐻
=
1
𝑘
𝐻
∑ 𝑦
𝑖
𝑖∈𝐻
, 𝑦ˉ
𝐿
=
1
𝑘
𝐿
∑ 𝑦
𝑖
𝑖∈𝐿
(14)
The bias-corrected mean per window is:
𝑦ˉ
𝑐𝑜𝑟𝑟
= 𝑝
𝐻
𝑦ˉ
𝐻
+ 𝑝
𝐿
𝑦ˉ
𝐿
(15)
The corrected total is:
𝑁
̂
𝑐𝑜𝑟𝑟
= 𝐷 𝐴 𝑦ˉ
𝑐𝑜𝑟𝑟
(16)
This step ensures that if a stratum is over- or under-sampled due to practical constraints, the estimator remains aligned with
the known area proportions.
iv. Uncertainty quantification and confidence intervals
Because window counts follow a Poisson model, the variance of the sample mean is approximated by:
Var(𝑦ˉ) ≈
𝑦ˉ
𝑘
with 𝑘 = 16
(17)
Therefore, the standard error (SE) of the total estimate is:
SE(𝑁
̂) = 𝐷 𝐴 √
𝑦ˉ
𝑘
(18)
For generated MPs:
SE(Δ𝑁
̂ ) = 𝐷 𝐴 √
𝑦ˉ
𝑎
𝑘
+
𝑦ˉ
𝑏
𝑘
(19)
A 95% confidence interval is obtained via:
Δ𝑁
̂ ± 1.96 SE(Δ𝑁
̂ )
(19)
v. Applicability and limitations
The proposed model is applicable to Raman-based MP quantification under serial dilution and areal subsampling because
it:
a. Matches the data-generation mechanism: Counts per window are discrete and sparse; the Poisson process is the
canonical model for independent particle counts in fixed areas.
b. Maintains experimental comparability Using the same grid size (16 cells), window area, and dilution scheme for
“before” and “after” samples ensures that differences reflect generation, not methodology.
c. Provides explicit uncertainty The Poisson variance structure yields confidence intervals that can be reported
alongside point estimates, strengthening inferential rigor.
6.3 Results obtained
The experimental campaign yielded several results that were primarily intended to evaluate the performance and feasibility
of the proposed protocol. While these results confirm that the protocol operates as intended, successfully enabling microplastic
extraction, identification, and preliminary quantification, still they are not sufficient to draw definitive conclusions regarding
the specific hydraulic conditions or material properties associated with microplastic generation.
Nevertheless, the variation in experimental configurations, including changes in pipe diameter, material, flow rate, and
transient pressure conditions, demonstrates that the protocol is sensitive to changes in operating conditions. The observed
differences in microplastic detection across tests suggest that microplastic generation is influenced by both hydraulic and
material parameters, although additional replicated experiments are required to isolate and quantify these effects. Consequently,
the results support the validity of the protocol as a diagnostic and comparative tool, while underscoring the need for systematic
repetition under controlled conditions to obtain statistically robust conclusions.
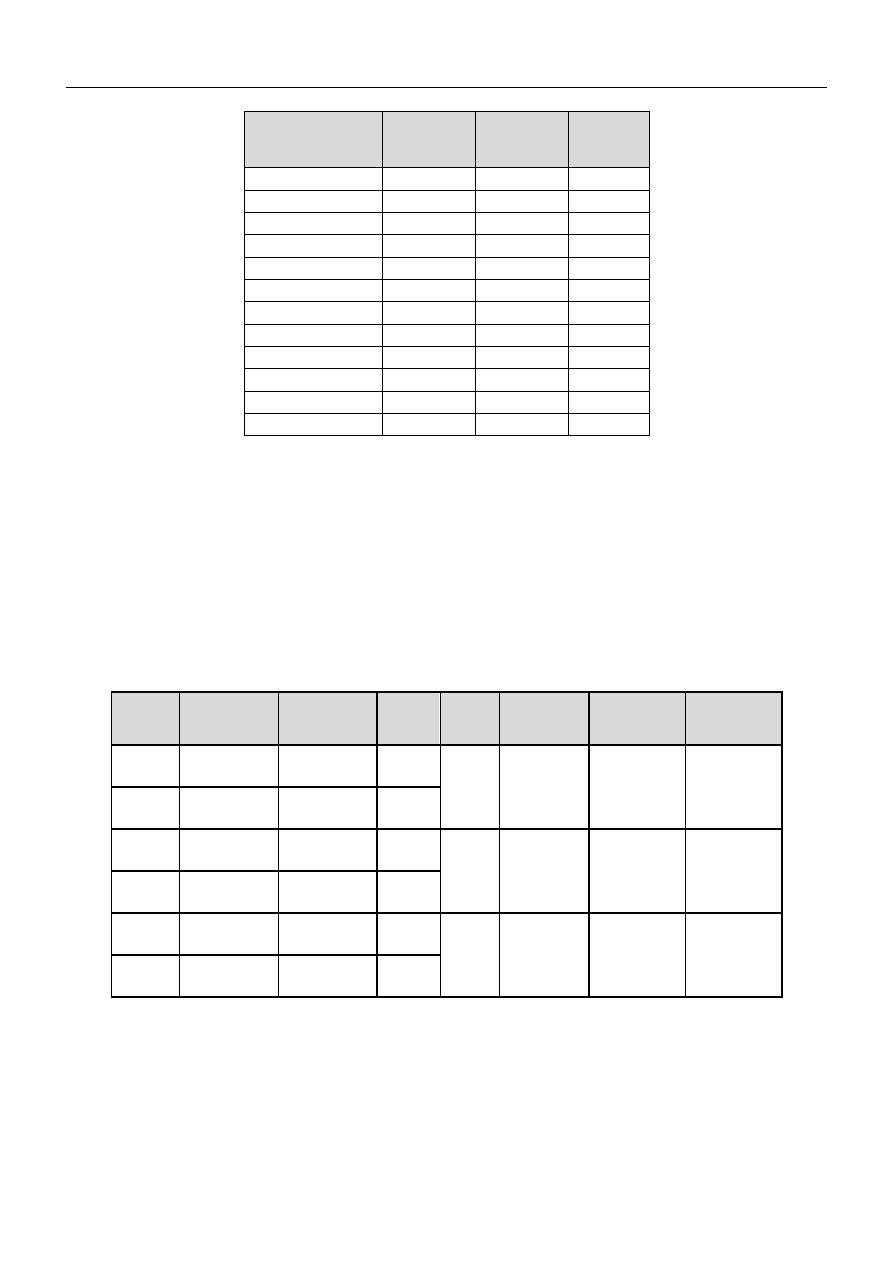
The microplastic found in the research gave important information to the methodology developed for the research.
Microplastics in Pipelines: Water Hammer Effects and Identification Protocol Validation
Cardona, S. & Plazas-Tuttle, J.
26
Sample
Number of
particles
PVC
Size microm Solution
White
1
514.2
1:1,000
Preliminary test
1
114.9
1:1,000
1/2" 2B
1
44.9
1:1,000
1/2" 1B
0
-
1:1,000
1" 2B
1
52.4
1:1,000
1" 1B
0
-
1:1,000
Pre PVC 1”
0
-
1:10,000
Post PVC 1”
1
43.6
1:10,000
Pre PVC ½”
0
-
1:10,000
Post PVC ½”
2
32.5
1:10,000
Pre PVC ¾”
0
-
1:10,000
Post PVC ¾”
1
22.4
1:10,000
Table 4. Particles Identified
For the methodology only PVC was triales completely in the definitive design.
Quantification was performed using the data obtained; however, these results are not yet sufficient to draw robust conclusions
regarding the hydraulic conditions that govern microplastic generation. No results are reported for C-PVC, PP, or HDPE, as
reliable identification of these materials could not be achieved using Raman spectroscopy under the experimental conditions
applied.
In contrast, the results obtained for PVC indicate that microplastics are being generated and that both identification and
quantification are feasible within the proposed experimental framework. Nevertheless, due to the limited number of comparable
datasets and the absence of results for the other materials, a systematic comparison between materials and operating conditions
could not be conducted. The estimated values and associated uncertainties do not provide a basis for drawing definitive
conclusions from the results; rather, they offer an indication of the potential magnitude of microplastic generation based on the
proposed Poisson statistical model.
Sample
Number of
particles
PVC
Number
of
windows
A factor ΔN
SE(ΔN)
ΔN-
1.96
SE(ΔN)
ΔN+1.96
SE(ΔN)
Pre PVC
1”
0
16
400
250000 1000000
0
2210000
Post
PVC 1”
1
16
400
Pre PVC
½”
0
16
400
500000
1414213.562
0
3271858.582
Post
PVC ½”
2
16
400
Pre PVC
¾”
0
16
400
250000 1000000
0
2210000
Post
PVC ¾”
1
16
400
Table 5. Cuantification of the trials
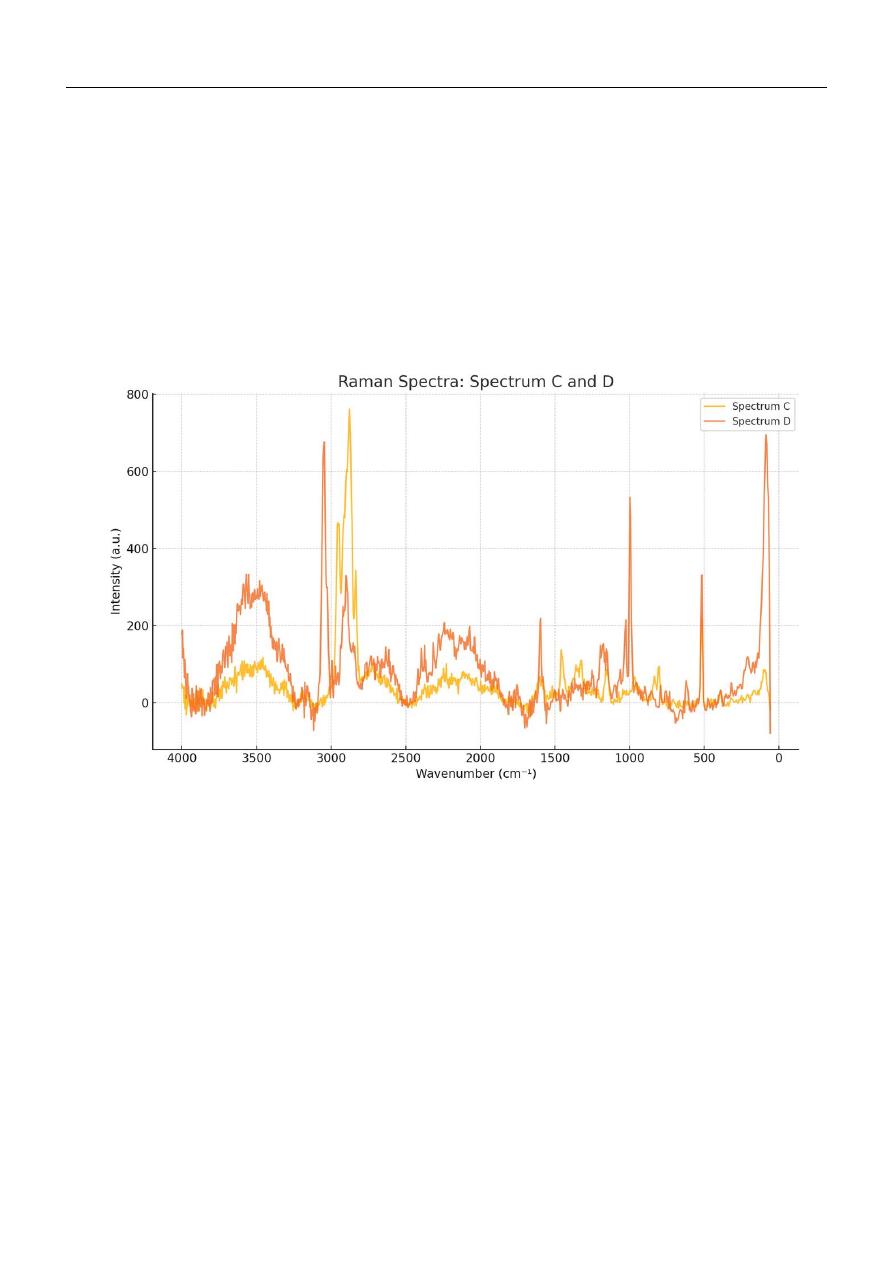
The identification and comparison of Raman spectra provide qualitative evidence of microplastic generation. The results
confirm that particle identification is successful, as the measured spectra match reference spectra corresponding to the known
polymer standards. This agreement demonstrates that the proposed protocol functions as intended. However, to obtain
statistically robust and conclusive results regarding the influence of pipe material and hydraulic conditions on microplastic
generation, the protocol must be systematically repeated under controlled and comparable experimental conditions.
Microplastics in Pipelines: Water Hammer Effects and Identification Protocol Validation
Cardona, S. & Plazas-Tuttle, J.
27
Spectral comparisons are performed as illustrated in Figure 26. These qualitative assessments, combined with automated
analysis using ParticleFinder software, enable rapid identification of both the polymer type and particle size of the generated
microplastics.
Based on the conditions under which the identification protocol was applied, it is hypothesized that PVC may generate a
higher quantity of microplastics compared to other materials due to its mechanical properties. In contrast, the higher ductility
of HDPE and the greater durability of PP suggest that PVC may be more susceptible to abrasion and mechanical damage, which
can promote microplastic release under transient hydraulic stresses.
Nevertheless, microplastic generation is likely influenced by additional factors beyond pipe material alone. These include
the materials used in other components of the hydraulic model, as well as the age and degradation state of the pipes. Aging
processes may alter material properties over time, leading to different microplastic generation mechanisms and patterns
depending on the service life of the material (Świetlik & Magnucka, 2025).
The spectra identified for the microplastics where the following:
Figure 26. Spectrum Detected
The spectrum for the spectrum C corresponds to PE and the spectrum D corresponds to PVC.
In light of the results obtained, several observations can be made. First, the results primarily reflect the correct functioning
and feasibility of the proposed protocol. The data presented are not intended to draw definitive conclusions regarding the
hydraulic or material conditions that may favor microplastic generation.
Nevertheless, the experimental conditions under which the tests were conducted are representative of hydraulic conditions
commonly found in internal household water networks, where such transient phenomena may occur. In this context, the
developed protocol provides a solid methodological basis for performing future comparative tests under controlled and
repeatable conditions.
The study incorporates a Poisson-based statistical model to estimate the number of microplastic particles generated during
water-hammer events and to quantify the associated uncertainty. Although the characteristics of the materials analyzed do not
allow definitive conclusions regarding which material generates a greater quantity of microplastics, insights drawn from the
literature, particularly Mechanical Properties of Solid Polymers (Ward & Sweeney, 2013), suggest that PVC may be more
susceptible under the tested conditions. However, this hypothesis requires validation through additional experiments and more
robust datasets.

Microplastics in Pipelines: Water Hammer Effects and Identification Protocol Validation
Cardona, S. & Plazas-Tuttle, J.
28
7. Conclusions
The presence of microplastics in water systems can be attributed to both primary and secondary sources. Specifically,
secondary microplastics result from the degradation of larger plastic materials. It has been demonstrated that drinking water
pipelines can release microplastics due to such degradation, which may be driven by various factors, including mechanical
damage to the pipe walls caused by hydraulic phenomena such as water hammer.
To investigate the potential formation of microplastics, a protocol for their identification was developed in conjunction with
a preliminary sampling process using a laboratory-scale pipeline model. The protocol employed the ParticleFinder™ system,
which enables automatic particle localization and Raman-based chemical identification. Following the extraction of particles
from PVC pipes, this system allows for efficient detection and quantification of microplastics. In the laboratory trials, it is
expected that the predominant form of microplastics found will be fragments, as this is the most common morphology released
from PVC, CPVC, PP and PE pipes.
The experimental results demonstrate that the proposed protocol enables both the generation and identification of
microplastics under different hydraulic conditions. Although several challenges were encountered during the development of
the Thesis I experimental setup, these limitations informed the design of the Thesis II model. The revised design produced
samples with improved water quality and reduced turbidity, resulting in more favorable conditions for subsequent processing
and analysis.
Adapting the protocol to include sampling before and after each water hammer event allows for control and comparison of
the amount of microplastics generated. This paired sampling approach enables meaningful comparisons across tests and
facilitates the evaluation of differences associated with varying hydraulic conditions and pipe materials.
During testing, the importance of properly managing the organic digestion step became evident, as insufficient digestion
produced clear interferences in the Raman spectra. Similar interferences were also observed when moisture or particulate
contamination was present on the silica filters, underscoring the need for strict sample handling and preparation procedures.
The dilution scheme had to be adjusted as the improved hydraulic model generated a higher number of particles after the
processing of the samples. This change is likely attributable to the elimination of scale-related trapping observed in the earlier
model, where detached mineral scales may have retained particles during density separation, resulting in fewer particles in the
extracted supernatant. Consequently, the final tests were conducted using 1:10,000 dilutions to avoid filter saturation and ensure
reliable identification.
RAMAN spectroscopy represents a bottleneck in the methodology, as only a couple of pre-post samples can be analyzed per
week, since the laboratory where the HORIBA microscope is located is a service laboratory that schedules appointments based
on availability.
Based on the results of these trials, a clearer understanding of the implications of using plastic pipes for water distribution
can be established. Additionally, hydraulic phenomena associated with microplastic release warrant further study, as they may
compromise drinking water quality. It is particularly important to carry out these tests, as even low concentrations of
microplastics can be harmful over prolonged exposure periods (Jung et al., 2022).
The methodology developed in this work provides a foundational framework for demonstrating the potential contamination
of water in internal distribution networks. It enables the characterization of various hydraulic conditions under which
microplastics may be generated and allows for comparative analysis of materials to evaluate their contribution to microplastic
release in distribution pipelines. These insights could influence the ongoing use and regulation of PVC, C-PVC, PP and PE
piping systems. This methodology should be replicated and tested to verify the conditions of each of the materials used for
domiciliary pipelines.
Moreover, the identification protocol developed herein could be standardized for future research. Subsequent studies may
strengthen the case for revising hydraulic design criteria in water distribution systems. Ultimately, recognizing the role of
hydraulic phenomena in microplastic generation could support the development of new regulatory measures aimed at
controlling microplastic pollution in drinking water networks.
8. Recommendations
• Given that Raman spectroscopy constitutes the main bottleneck in sample analysis, it is recommended to secure
extended access to the microscope or to train additional researchers in its operation. Increased instrument
availability would significantly improve sample throughput and allow for repeated experiments, which are
necessary to obtain statistically robust results.

Microplastics in Pipelines: Water Hammer Effects and Identification Protocol Validation
Cardona, S. & Plazas-Tuttle, J.
29
• The statistical model must be applied with better scaling conditions to reduce its uncertainty, as it has values lower
than 0. To do this, a more extensive count could be performed using the HORIBA microscope, or a larger sample
volume could be taken.
• Based on the microplastic count, an estimate could be made of the degraded mass of the pipe to corroborate the
amount of microplastics generated. This could quantitatively adjust the amount of microplastics generated given
the hydraulic conditions.
• Future experiments should incorporate pipes with different ages, degrees of degradation, and material formulations.
Accelerated aging tests or the use of field-extracted pipes could provide valuable insight into how long-term service
conditions influence microplastic generation mechanisms.
• Develop several experiments changing characteristics that can affect the pipelines such as temperature of the fluid
and external temperature and sunlight exposition.
• Automated particle detection and spectral mapping tools should be further optimized to reduce operator dependency
and analysis time. Improved automation would enhance reproducibility and allow larger areas of each filter to be
analyzed more efficiently. This could be made with the software ParticleFinder.
• To enable meaningful comparisons between materials and operating scenarios, it is recommended that future studies
repeat the protocol under strictly controlled and replicated hydraulic conditions, including flow rates, pressures,
and water-hammer intensity.
• Apply methodologies to measure the abrasion besides measuring the roughness of the pipes such as optical
profilometry or confocal laser scanning microscopy
References
Araujo, C. F., Nolasco, M. M., Ribeiro, A. M. P., & Ribeiro-Claro, P. J. A. (2018). Identification of microplastics using
Raman spectroscopy: Latest developments and future prospects. In Water Research (Vol. 142, pp. 426–440). Elsevier
Ltd. https://doi.org/10.1016/j.watres.2018.05.060
Chu, X., Zheng, B., Li, Z., Cai, C., Peng, Z., Zhao, P., & Tian, Y. (2022). Occurrence and distribution of microplastics in
water supply systems: In water and pipe scales. Science of the Total Environment, 803.
https://doi.org/10.1016/j.scitotenv.2021.150004
Colombian Congress. (2022, July 8). Ley 2232 2022. Diario No 52.124.
Cong, J., Wu, J., Fang, Y., Wang, J., Kong, X., Wang, L., & Duan, Z. (2024). Application of organoid technology in the
human health risk assessment of microplastics: A review of progresses and challenges. In Environment International
(Vol. 188). Elsevier Ltd. https://doi.org/10.1016/j.envint.2024.108744
Dalmau-Soler, J., Ballesteros-Cano, R., Ma, &, Boleda, R., Paraira, M., Ferrer, N., & Lacorte, S. (2021). Microplastics from
headwaters to tap water: occurrence and removal in a drinking water treatment plant in Barcelona Metropolitan area
(Catalonia, NE Spain). https://doi.org/10.1007/s11356-021-13220-1/Published
Gobierno de Colombia Ministerio de Vivienda, C. y T. (2007, June 22). Resolución 2115 de 2007.
https://scj.gov.co/sites/default/files/marco-legal/Res_2115_de_2007.pdf
Han, Y., Shi, W., Xu, H., Wang, J., & Zhou, L. (2022). Effects of Closing Times and Laws on Water Hammer in a Ball Valve
Pipeline. Water (Switzerland), 14(9). https://doi.org/10.3390/w14091497
Hariri Asli, K., Falahatkar, S., & Dayemi Gorabi, M. (2024). Water hammer stress on water transmission line. Water Practice
and Technology, 19(6), 2399–2418. https://doi.org/10.2166/wpt.2024.148
Jung, Y. S., Sampath, V., Prunicki, M., Aguilera, J., Allen, H., LaBeaud, D., Veidis, E., Barry, M., Erny, B., Patel, L., Akdis,
C., Akdis, M., & Nadeau, K. (2022). Characterization and regulation of microplastic pollution for protecting planetary
and human health. In Environmental Pollution (Vol. 315). Elsevier Ltd. https://doi.org/10.1016/j.envpol.2022.120442
Kirstein, I. V., Hensel, F., Gomiero, A., Iordachescu, L., Vianello, A., Wittgren, H. B., & Vollertsen, J. (2021). Drinking
plastics? – Quantification and qualification of microplastics in drinking water distribution systems by µFTIR and Py-
GCMS. Water Research, 188. https://doi.org/10.1016/j.watres.2020.116519

Microplastics in Pipelines: Water Hammer Effects and Identification Protocol Validation
Cardona, S. & Plazas-Tuttle, J.
30
Li, C., Busquets, R., Moruzzi, R. B., & Campos, L. C. (2021). Preliminary study on low-density polystyrene microplastics
bead removal from drinking water by coagulation-flocculation and sedimentation. Journal of Water Process
Engineering, 44. https://doi.org/10.1016/j.jwpe.2021.102346
Malesińska, A., Rogulski, M. W., Puntorieri, P., Barbaro, G., & Elżbieta Kowalska, B. (2020). Equivalent Celerity in Water
Hammer for Serially Connected Pipelines. Journal of Pipeline Systems Engineering and Practice, 11(1).
https://doi.org/10.1061/(asce)ps.1949-1204.0000411
Mitrano, D. M., & Wohlleben, W. (2020). Microplastic regulation should be more precise to incentivize both innovation and
environmental safety. Nature Communications, 11(1). https://doi.org/10.1038/s41467-020-19069-1
Nawab, A., Ahmad, M., Khan, M. T., Nafees, M., Khan, I., & Ihsanullah, I. (2024). Human Exposure to Microplastics: A
Review on Exposure Routes and Public Health Impacts. Journal of Hazardous Materials Advances, 100487.
https://doi.org/10.1016/j.hazadv.2024.100487
Prata, J. C., da Costa, J. P., Lopes, I., Andrady, A. L., Duarte, A. C., & Rocha-Santos, T. (2021). A One Health perspective of
the impacts of microplastics on animal, human and environmental health. In Science of the Total Environment (Vol.
777). Elsevier B.V. https://doi.org/10.1016/j.scitotenv.2021.146094
Sillanpää, M., Khadir, A., Senthilkannan, S., & Editors, M. (2022). Environmental Footprints and Eco-design of Products
and Processes Microplastics Pollution in Aquatic Media Occurrence, Detection, and Removal.
https://link.springer.com/bookseries/13340
Streeter, V., Wylie, B., & Bedford, K. (1998). Fluid Mechanics (McGraw Hill, Ed.; Ninth Edition).
Świetlik, J., & Magnucka, M. (2025). Aging of drinking water transmission pipes during long-term operation as a potential
source of nano- and microplastics. International Journal of Hygiene and Environmental Health, 263.
https://doi.org/10.1016/j.ijheh.2024.114467
Thompson, R. C., Olsen, Y., Mitchell, R. P., Davis, A., Rowland, S. J., John, A. W. G., McGonigle, D., & Russell, A. E.
(2004). Lost at Sea: Where Is All the Plastic? Science, 304(5672), 838. https://doi.org/10.1126/science.1094559
Ward, I. M., & Sweeney, J. (2013). Mechanical Properties of Solid Polymers (Third Edition).
https://doi.org/10.1002/9781119967125
WHO. (2005). International Health Regulations. https://www.who.int/publications/i/item/9789241580410
Wu, J. hai, Sun, Y. dong, Su, M. zhu, & Zhu, H. zhen. (2023). Fluid-structure interaction and band gap analysis of periodic
composite liquid-filled pipe. Composite Structures, 304, 116444.
https://doi.org/10.1016/J.COMPSTRUCT.2022.116444
Xu, T., Zhang, L., Ni, W., Zhang, X., Yu, X., & Zhang, J. (2023). Analysis of Anomalies in Water Hammer Experiments
With Partially Open Valves. Journal of Pressure Vessel Technology, Transactions of the ASME, 145(1).
https://doi.org/10.1115/1.4055380
Yang, X., Man, Y. B., Wong, M. H., Owen, R. B., & Chow, K. L. (2022). Environmental health impacts of microplastics
exposure on structural organization levels in the human body. In Science of the Total Environment (Vol. 825). Elsevier
B.V. https://doi.org/10.1016/j.scitotenv.2022.154025
Yang, X., Xu, X., Zhou, Y., Yao, Y., Shen, C., & Liu, J. (2023). Longitudinal and vertical distribution of microplastics in
various pipe scales in an operating drinking water distribution system. Journal of Hazardous Materials, 459.
https://doi.org/10.1016/j.jhazmat.2023.132108
