
[1]
Optimal design of pipes in series with pressure driven
demands
Páez, D.
1
, Hernandez, D.
2
and Saldarriaga, J.
3
ABSTRACT
This paper presents an approach that combines concepts of energy use and the ILP to
found near optimal solutions for the optimal design of pipes in series systems in a
reduced amount of time. The proposed methodology predefines the head in each
node based on known criteria developed by past research on optimal design of
looped demand-driven networks. Once the heads are available, the demands are
calculated with the demand-pressure function and then the problem is solved as
demand-driven with ILP. Taking into account that the resulting design can be
unfeasible because of the probable changes in the nodes’ heads and therefore in the
demand flows, there are needed various iterations of the methodology that explores
the head assignation space in an intelligent way. The methodology is tested for
different scenarios showing the advantages of this approach.
Keywords:
Pipe in series, pressure driven demands, Optimal Hydraulic Gradient Line (OHGL),
Integer Linear Programming (ILP)
1
Professor, Civil and Environmental Engineering Department, Universidad de los Andes.
Researcher, Water Distribution and Sewer Systems Research Center – CIACUA. Email:
da.paez27@uniandes.edu.co
2
Researcher, Water Distribution and Sewer Systems Research Center – CIACUA. Civil and
Environmental
Engineering
Department,
Universidad
de
los
Andes.
Email::
da.hernandez39@uniandes.edu.co;
3
Professor, Civil and Environmental Engineering Department, Universidad de los Andes. Director,
Water
Distribution
and
Sewer
Systems
Research
Center
–
CIACUA.
Email:
jsaldarr@uniandes.edu.co

[2]
1.
INTRODUCTION
A pipe in series is a type of water distribution system (WDS) in which there is one
reservoir, a set of pipes connected in a lineal way and a set of demand nodes placed
on the pipes’ junctions. The system is usually called demand-driven whenever the
demand on the nodes is independent from the network‘s hydraulic behavior.
Likewise, a pressure-driven model is one in which the demand on each node is a
function of the systems pressure.
The optimal designing of WDSs consists in choosing the diameter of each pipe in the
system ensuring that the pressure nodes is greater than or equal to a minimum
allowable limit, seeking to minimize the system’s construction cost. Several
methodologies have been used to design demand-driven models. Most of those
methodologies consist in heuristics that mimic natural and physical phenomena to
explore the solution space e.g Genetic Algorithms (Savic & Waters, 1997; Wu &
Simpson, 2001; Reca & Martínez, 2006), Simulated Annealing (Cunha & Sousa,
1999; Reca et al., 2007), Harmony Search (Geem, 2002; Gemm, 2009) and Ant
Colony (Zecchin et al., 2006; Ostfled & Tubaltzev, 2008), among others; but some
researchers as Ipai Wu in 1975 and Ochoa and Saldarriaga in 2009 have proposed
methodologies based on hydraulic/energy concepts as Optimal Pressure Grade Line
and Optimal Power Use Surface.
Meanwhile, for pressure-driven models there have been proposed and tested less
number of methodologies like Genetic Algorithms (Farmani et al., 2007), Fuzzy
Linear Programing (Spiliotis and Tsakiris, 2007) and Recursive Design (González-
Cebollada et al., 2011); most of which are applied to design irrigation networks with
emitters at their nodes.
This paper presents an approach that combines the mentioned concepts of energy use
and Integer Linear Programming (ILP) to found near optimal solutions in a reduced
amount of time for pipes in series systems with pressure-driven demands. This
research is considered a first step for further methodologies that attempt to solve the
WDS optimal design problem for pressure driven demands in more complex
networks and based on hydraulics and not in heuristics. It can be especially useful for
fire water networks design, WDSs design considering leakage, residential and non-
residential plumbing systems design among others.
2.
PROBLEM FORMULATION
This study deals with pressure-driven demand models with a pipes in series topology.
The optimal design can be defined as: Given a layout, lengths of each pipe,
topography, connection between pipes and nodes and the minimum pressure
requirement, find the diameter combination that implies the minimum construction
cost. This combination must obey the mass and energy conservation principles and
the minimum pressure requirement on each node (in this study there are not

[3]
considered other kind of constraints like minimum and maximum velocities).
Mathematically, the problem can be expressed as:
[1]
where
is pipe in series construction cost and is calculated as:
∑
[2]
where
is the number of pipes in the series;
is the length of pipe
;
is the
diameter of pipe
; and and are regression parameters for the pipe unitary costs
as a function of the diameter. Problem constraints are:
Mass conservation:
∑
(
)
[3]
where
is the total flow rate at pipe
,
is the base demand at node
, and
is
the flow of the emitter at node
and it depends of the pressure on that node as is
shown in Equation 4.
[4]
where
is the pressure head in node
, and
and
are coefficients that describe
the emitter characteristics.
Energy conservation:
∑
[5]
where
is the total head in node
,
is the total head at the reservoir,
is the
friction loss in pipe
;
is the minor loss in pipe
and is the number of nodes.
For this study friction losses are calculated with Darcy-Weisbach equation.
Minimum pressure in demand nodes:
[6]
where
is the minimum head required in node
which corresponds with the
minimum allowable pressure.
Pipe diameters can only take discrete values belonging to commercial diameters set
:
[7]
[4]
It should be noticed that the flow in each node is not known before the design as they
depend of the pressure on each downstream node, and for that reason IPL cannot be
used directly to find the global optimum of the problem.
3.
OPTIMUM HYDRAULIC GRADE LINE FOR A PIPE IN SERIES
As well as I-pai Wu (1975) and later Ochoa and Saldarriaga (2009) established, the
minimum cost design usually develops a parabolic hydraulic gradient line (HGL). In
order to establish the behavior of the quadratic equation of the hydraulic gradient,
there must be known three points that describes the parabolic function. In the case of
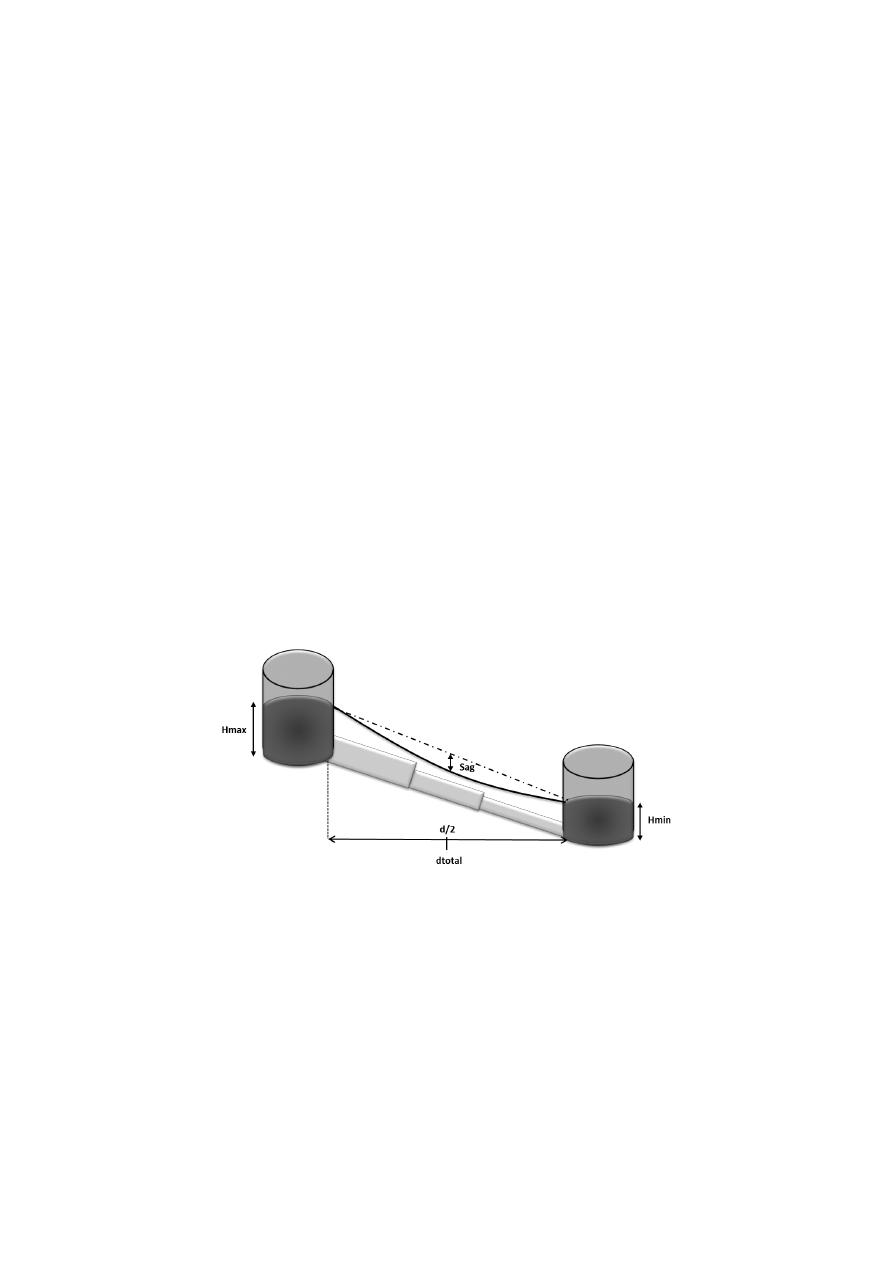
the hydraulic gradient, the three points are:
Hmax: is the available head for the entire network and as it is the head at the
reservoir, it is placed at abscissa
.
Hmin: is the minimum head for the critical node which is either the final node or a
node that will have a total head closer to the minimum because of its elevation. As it
defines the final node, it is placed at abscissa
.
Hsag: corresponds to the head in the point of maximum curvature in the hydraulic
gradient line. This point is defined by the Sag which is a percentage of the difference
between Hmax and Hmin line and it will determine the Hsag as shown in Figure 1. It
is always placed at abscissa
.
Figure 1. HGL goal, based on three known points.
As shown in Figure 1 it can be seen that there is a straight line corresponding to the
case when the hydraulic gradient line is linear. When the Sag is 0 the gradient will be
equal to the straight line, but when the sag is different to 0 the head in the middle of
the pipe system will be equal to the head in the middle point for the straight line
minus the Sag multiplied by the available head in the system.
This means that the objective hydraulic gradient line could be found by this
expression:
[5]
[8]
where:
is the objective
head on node
placed at a distance from the reservoir; S is
the selected sag and
and
are the heads at the mentioned points.
4.
METODOLOGY
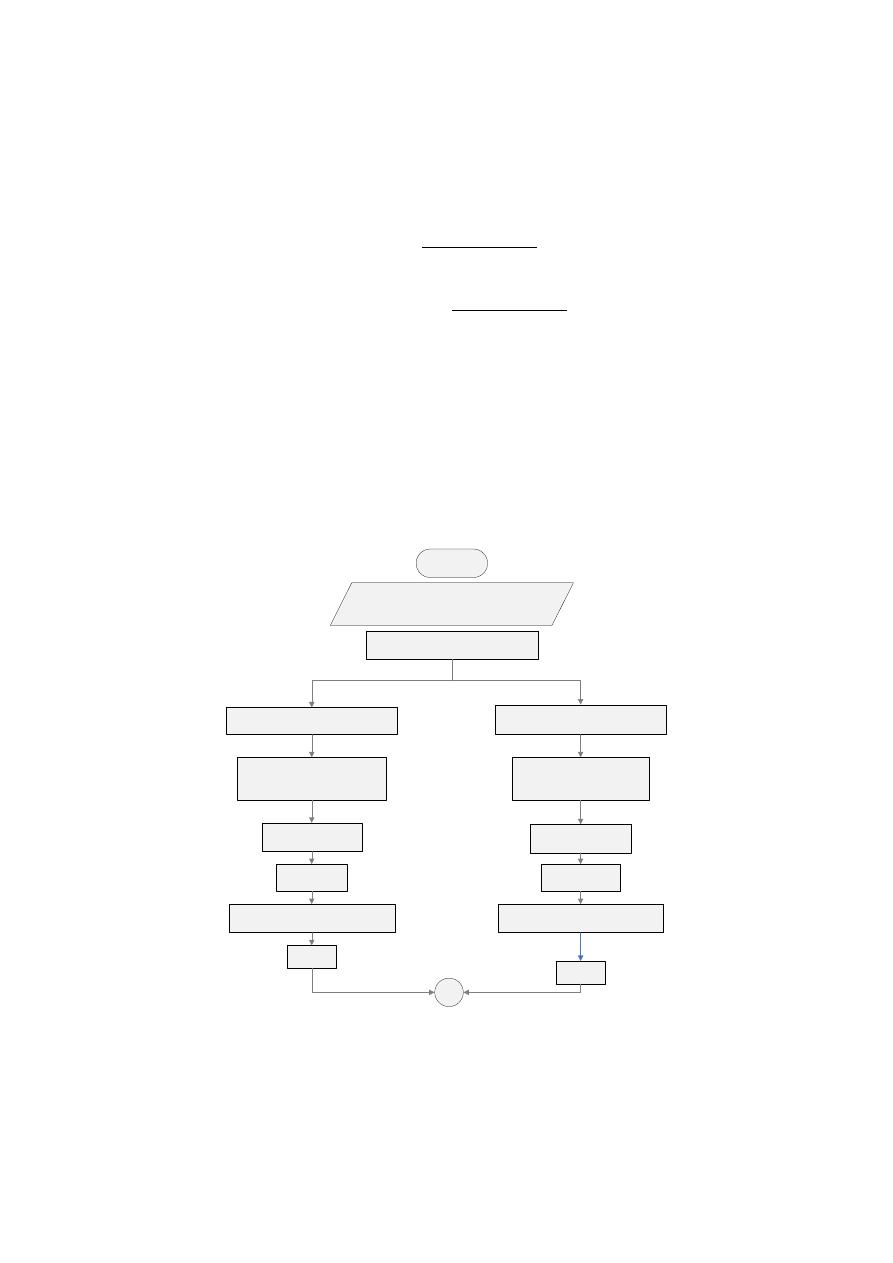
The proposed methodology is show in Diagram 1 and explained above:
Predifine HGL for Sag 0 and 0.25 using
Equation
Calculate flow on each node for sag 0 HGL
Assign the flow obtained as the total
base demand on each node
Calculate flow on each node for sag 0.25 HGL
Assign the flow obtained as the total
base demand on each node
Design the system ussing
Integer Linear
Programming
Design is obtained
S(0) = D1
Design is obtained
S(0.25) = D2
Run D1 hydraulics with pressure driven
demands in each node and calculate the
pressure and real flow on each node.
Run D2 hydraulics with pressure driven
demands in each node and calculate the
pressure and real flow on each node.
Print:
FlowP1_i,
Print:
FlowP2_i,
Design the system ussing
Integer Linear
Programming
A
START
System topology, Maximum Head
(Hmax), Minimum Pressure (Pmin),
diameters, Ks, Km.
Diagram 1. Methodology.
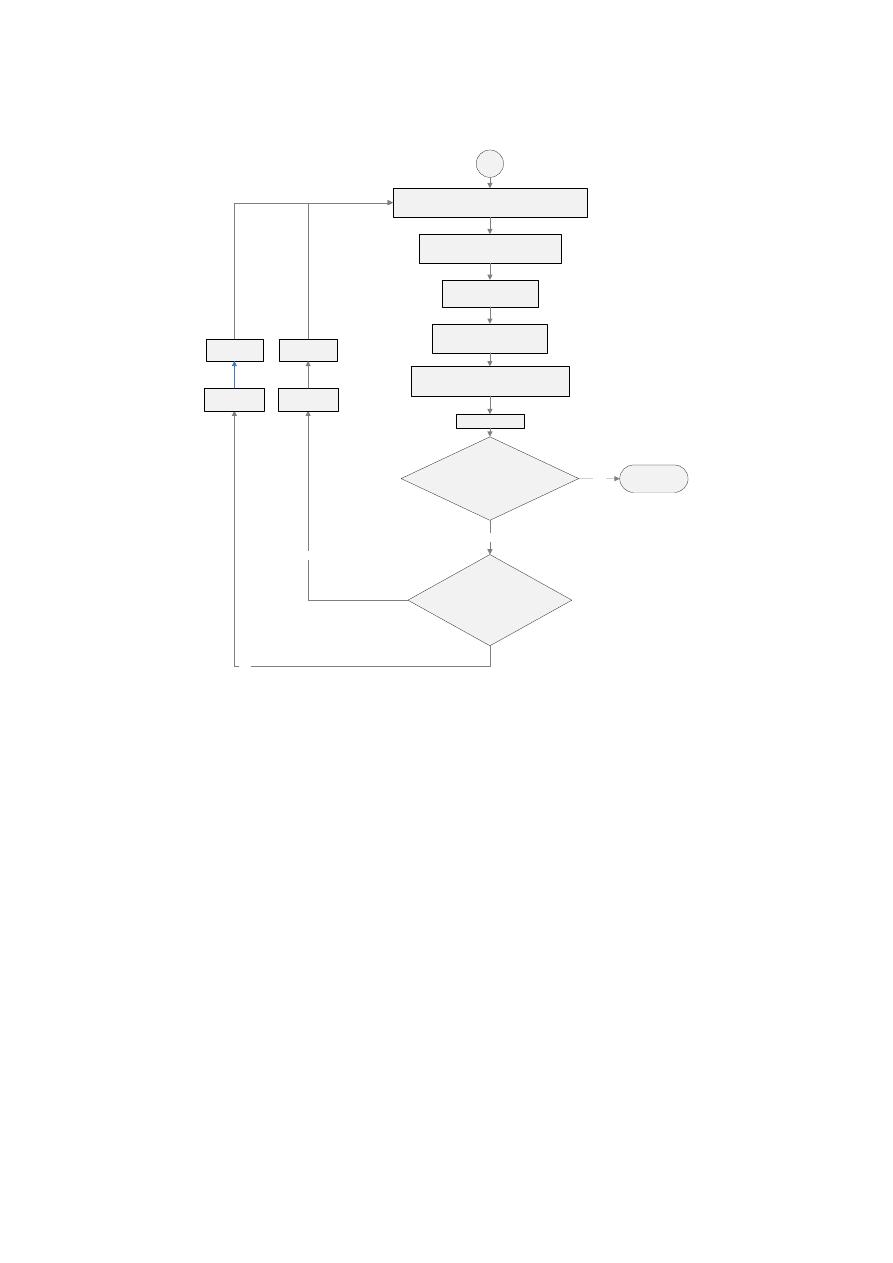
[6]
FlowMj_i = (FlowP1_i + FlowP2_i )/2
Assign FlowMj_i on each node i
Design the system ussing
Integer Linear
Programming
Run Dj hydraulics with pressure driven
demands in each node and calculate the
pressure and real flow on each node.
Number of nodes with Headi >=Head
min are greater than Zero?
Print: Design_Average j = Dj
YES
FlowP1_i =
FlowPj_i
Print: FlowPj_i
FlowP2_i =
FlowPj_i
IF(
∑FlowE_ji - ∑FlowE_j-1i < ε )
AND
For each node Headi >= Head min
NO
NO
Yes
D2 = Dj
D1 = Dj
A
END
Diagram 2. Methodology.
4.1 Predefine Hydraulic Gradient Line
In order to calculate the HGL is important determine the sag that will be used. It can
be proved that the sag have a validity range between 0 and 0.25. When design is
based on the HGL with a 0 sag the system meets the minimum pressure restriction
but generates high constructive costs as it overestimates the emitter flows. Whereas
when is based on a 0.25 sag the design has low constructive cost but does not meet
the minimum pressure because of its subestimation of emitter flows.
Considering that behavior, the methodology looks for an average between those two
designs looking to accurately estimate the emitter flows and therefore the flow rate in
each pipe.
4.2 Designs with Integer Linear Programming
Once the flow rate in each pipe is supposed by using the results of the last step, the
optimum design of that system can be achived with the following ILP formulation:

[7]
Define
as the set of nodes in the network,
as the set of available diameters and
as binary decision variables described by Equation :
{
[9]
Also define
as
auxiliary decision variables that represent the total head in the node
i
N. Then the objective function is:
∑ ∑ ∑
[10]
were
is the cost of assigning a diameter
in the pipe that goes from node
to the node . Finally the constraints for the ILP problem are:
Constraints:
Constraint of minimum allowable pressure and its consequent total head
defined by Equation 6.
Constraint that ensures the conservation of energy for each pipe. The total
head at node
downstream the node will be equal to the total head
in node
minus the total head losses produced in the pipe from to
when a diameter is assigned to that pipe:
∑
, |
[11]
were
is the head in the downstream node,
the head in the upstream
node,
is the parameter of total head losses that occurs in pipe from node
to when a diameter is assigned, and is a function
that returns a
when the pipe that goes from to acctually exists ad a
otherwise.
Constraint that ensures that only one diameter is assigned to each pipe:
∑
, |
[12]
This formulation was implemented in the program Xpress IVE. The Xpress-
Optimizer features sophisticated, robust multi-threaded algorithms to quickly and
accurately solve linear problems (LP).
After this step the designer will have two different designs, the design obtained from
Sag 0 (D
1
) and the design obtain from Sag 0.25 (D
2
). It is important to mention that,
the design D
1
will be more expensive than the design D
2
; but on the other hand, the
design D
1
will be feasible hydraulically and D
2
probably won’t. This is verified in the
next step.

[8]
4.3 Hydraulic execution with pressure driven demands
As explained before, the designs D
1
and D
2
were obtained from constant demands, so
it is necessary to verify their hydraulic behavior when they are modeled with
pressure driven demands. In case that the design D
2
results in a feasible design the
algorithm ends and the final design will be D
2
, otherwise the process continue to next
step.
The flows for each node calculated with the hydraulic execution of D
1
and D
2
considering pressure-driven demands are stored. For D
1
the flow is Flow1
i
and for D
2
is Flow2
i
,
is the node ID.
4.4 Iteration process
1. Using the flows for each design (Flow1
i
and Flow2
i
) after hydraulic execution, a
new estimation of the flow for each node is calculated with Equation 13 for each
node
.
[13]
where
corresponds to the new flow in the node i for the next design called
Dm
(the middle design).
2. Assign
as a constant demand on each node.
3. Design the new middle system with LP using steps described at section 4.4.
4. Verify the hydraulic performance for design D
m
obtaining the actual heads and
total flow in each node
.
5. Restore D
1
or D
2
: The designer gets to this step due to the unfeasibility of D
m
and/or because a cheaper design is expected by reducing even more the supposed
flow for each node. In this step the designer has to observe the number of nodes
under the minimum pressure in D
m
:
In the presented conditional of this step, it can be observed that it starts a bisection
process. After replacing D
m
in D
2
or D
1
, the designer has to go back to step 1 and
repeat the process until the differences between the flows supposed by the last D
m
and the actual D
m
are negligible.
5.
RESULTS
The proposed methodology was tested on 4 systems with a similar layout (15 pipes
in series) but with differences in topography and base demand on the nodes. Network
1, has no base demand and flat topography, Network 2 has a 240 Lps based demand
[9]
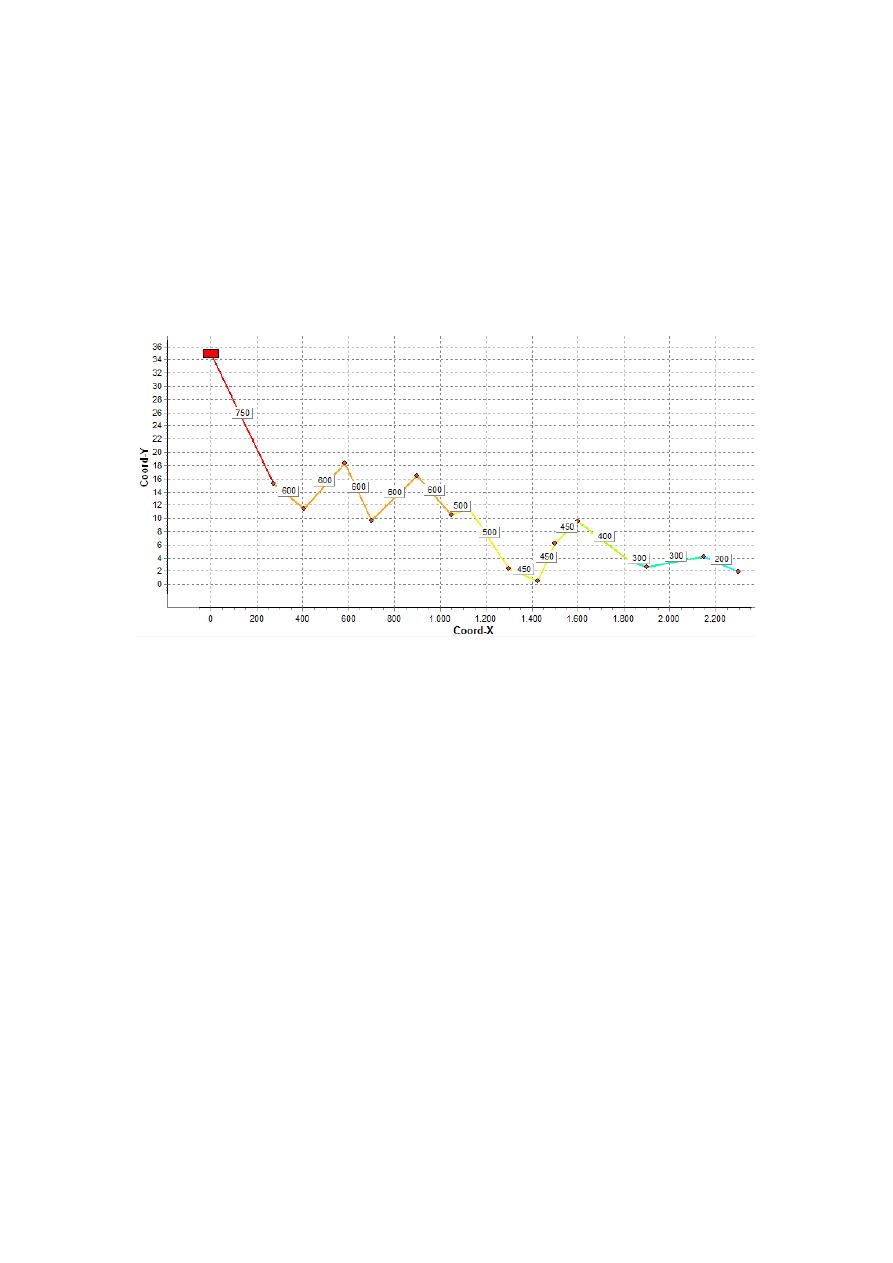
and flat topography, Network 3 has no base demand and a topography presented on
Figure 2, and Network 4 has the same topography and a 240 Lps base demand. The
total head at the reservoir is 35.0 m and the minimum allowable pressure for the
nodes is 10.0 m. The available diameters are 50, 75, 100, 150, 200, 250, 300, 350,
400, 450, 500, 600, 750, 800 and 1000 mm for networks 1 and 3 but considering the
base demand of networks 2 and 4, diameters of 1200, 1400 and 1500 were added to
the list. The roughness of the pipes is
m and cost parameters were
and . There were no minor losses considered on these networks.
Figure 2. Topography configuration for Network 3 and Network 4 and pipes’ lengths for the
four study cases.
The comparison was made with the SOGH methodology proposed by Ochoa (2009)
which is the methodology that presents the criterion of parabolic HGL to minimize
constructive costs. As the Sag mentioned above is a free parameter of the parabolic
equation, a design was made for different sag values.
On the other hand, the proposed methodology was implemented in REDES software
for hydraulic executions developed by CIACUA as well as Xpress-IVE for ILP
problems’ solution. The results are presented on the following figures:
[10]
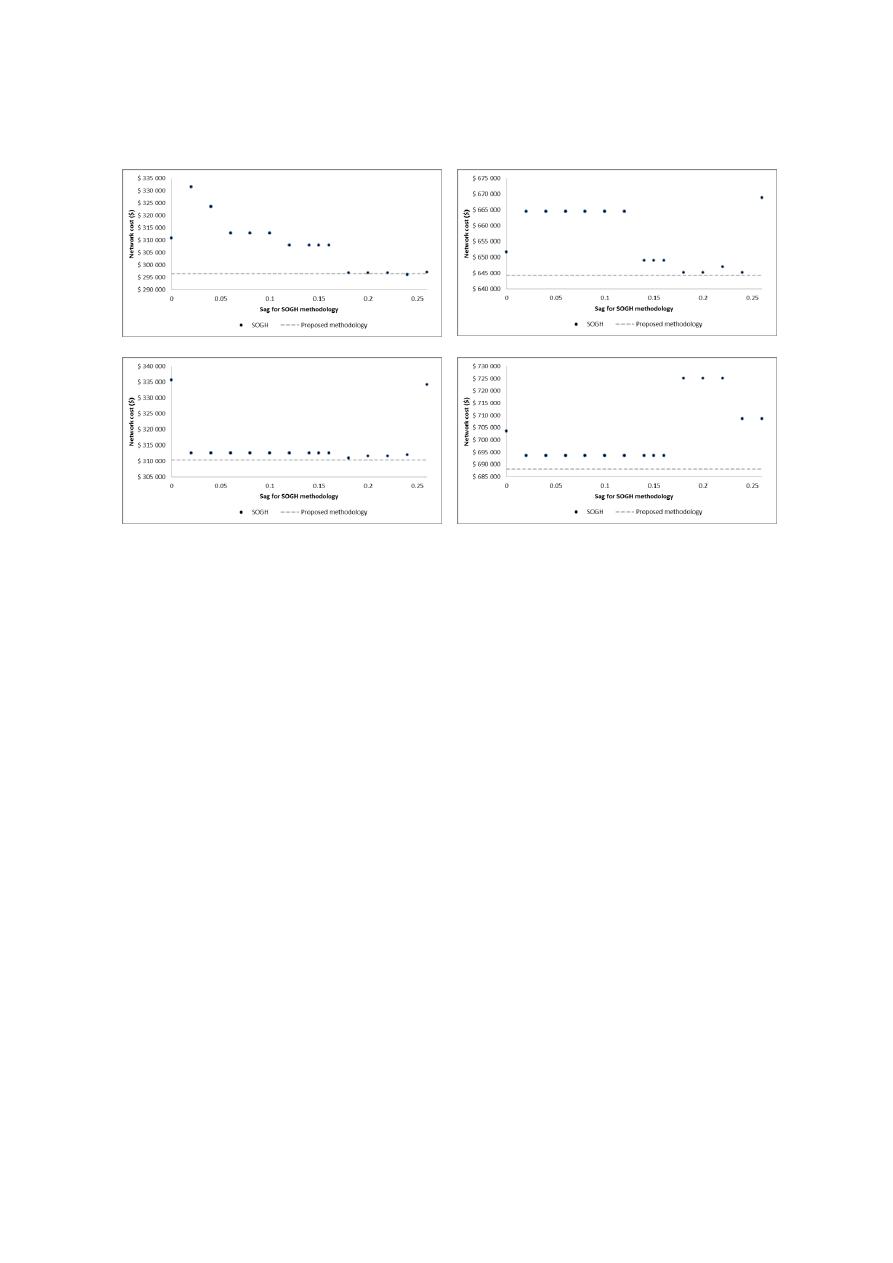
a)
b)
c)
d)
Figure 3. Costs results for the four study cases. a) Network 1, b) Network 2, c) Network 3 and d)
Network 4.
It can be seen that the proposed methodology achieves designs with less constructive
costs than SOGH for three of the four study cases, and for the Network 1, a design
that costs 0.13% more than the better result found with SOGH. That means that the
ILP methodology is actually finding near optimal solutions in all the networks.
The next criterion that is compared is the computational time required to find that
designs. For the Network 1 the best design found by SOGH (sag = 0.24) required 43
hydraulic executions of the system; for Network 2 the best design can be achieved
with the sag values 0.18, 0.2 and 0.24 requiring 40 hydraulic executions; for Network
3 the minimum cost sag was 0.18 with 88 hydraulic executions; and finally the
Network 4 best design with SOGH required 71 hydraulic executions with a 0.02 sag
but that same design can be found using sags between 0.02 and 0.16, each value
requiring different number of hydraulic executions.
It should be noticed that the previous number of executions required by SOGH
methodology are actually the executions required if you know a priori the optimal
sag, but it is a difficult task as it depends on the demand distribution among the
system, and as it is pressure-driven it is not known before the design. Therefore the
SOGH methodology required actually 568 hydraulic executions for Network 1, 591
for Network 2, 1019 for Network 3 and 1345 for Network 4, which were used in 14
different designs for each network with sags varying from 0.02 to 0.26.
On the other hand the computational time spent by the ILP methodology is composed
by the time assigning the HGL, which is negligible, the time defining each ILP
formulation, which requires the calculation of each
(total head losses that

[11]
occurs in pipe from node
to when a diameter is assigned), the ILP
problems’ solving and the hydraulic executions required after each ILP formulation.
The
computing can be done by assigning to the entire system the diameter
and then executing the hydraulics reading the head losses on the pipes, and repeating
that process for each available diameter. The ILP solving lasted less than 0.1 seconds
on a Intel Core i5 processor with 3.0 GB RAM Memory using Xpress-IVE software,
so it is also negligible when compared with the hydraulic executions.
Therefore the proposed methodology required 80 hydraulic executions for the
Network 1, but 75 of those were executions with constant demand on the nodes as
there were used just for the computing of the
and only 5 executions were
actually done with the system with pressure-driven demands. Considering the way in
which the pressure-driven demand models are executed with the Gradient Method
programmed in EPANET (Rossman, 2000) and also in REDES software, the 75
hydraulic executions with constant demand plus the 5 executions with pressure-
driven demands are barely more time demanding than the 43 executions with
pressure driven demand spent by SOGH.
In the case of Network 2, the ILP methodology required 36 hydraulic executions
with constant demands and 2 executions with pressure-driven demands, resulting in
fewer executions than the best design accomplished by SOGH. For Network 3, 60
hydraulic executions with constant demands and 4 executions with pressure-driven
demands were required. Finally for Network 4 were spent 54 hydraulic executions
with constant demands and 3 executions with pressure-driven demands.
It means that the proposed methodology can achieve near optimal designs in a
reduced amount of time considering pressure-driven demands using hydraulic criteria
for the definition of the HGL and ILP for the consequent diameters selection.
6.
CONCLUSIONS
A design methodology that uses hydraulic criteria to predefine an objective hydraulic
grade line and Integer Linear Programming to design a pressure-driven system, was
presented and tested on four study cases with a pipes’ in series topology, showing its
benefits in terms of the quality of the solutions (reduced constructive cost) and the
amount of computational time required (reduced number of hydraulic executions).
This study is a first step to develop further methodologies that solves the WDS
optimal design problem for pressure driven demands in more complex networks. It
can be especially useful for fire water networks design, WDSs design considering
leakage, residential and non-residential plumbing systems design among others.

[12]
7.
REFERENCES
Cunha, M. a. (1999). Water distribution network design optimization: Simulated
annealing approach. J. Water Resour. Plan. Manage. , 215-221
Farmani, R, Abadia, R. and Savic, D. (2007) “Optimum Design and Management of
Pressurized Branched Irrigation Networks” J. Irrig. Drain Eng., 133(6), 528–
537.
Geem, Z. K. (2002). Harmony search optimization: Application to pipe network
design. Int. J. Model. Simulat. , 125-133.
Geem, Z. K. (2009). Particle-swarm harmony search for water network design.
Engineering Optimization, Vol.41, No.4, pp. 297-311.
González-Cebollada, C., Macarulla, B., and Sallán, D. (2011). ”Recursive Design of
Pressurized Branched Irrigation Networks.” J. Irrig. Drain Eng., 137(6), 375–
382.
Ochoa, S. (2009). Optimal design of water distribution systems based on the optimal
hydraulic gradient surface concept. MSc Thesis, dept. of Civil and
Environmental Engineering, Universidad de los Andes, Bogotá, Col. (In
Spanish).
Ostfeld, A. and Tubaltzev, A. (2008). ”Ant Colony Optimization for Least-Cost
Design and Operation of Pumping Water Distribution Systems.” J. Water
Resour. Plann. Manage., 134(2), 107–118.
Reca, J. and Martínez, J. (2006). Genetic algorithms for the design of looped
irrigation water distribution networks. Water Resources Research, Vol.44,
W05416
Reca, J., Martínez, J., Gil, C. and Baños, R. (2007). Application of several meta-
heuristic techniques to the optimization of real looped water distribution
networks. Water Resources Management, Vol.22, No.10, pp. 1367-1379.
Saldarriaga, J. (2007). “Hidráulica de Tuberías. Abastecimiento de Agua, Redes,
Riego”. Bogotá: Alfaomega.
Savic, D. and Walters, G. (1997). Genetic algorithms for least cost design of water
distribution networks. J. Water Resour. Plan. Manage , 67-77.
Spiliotis, M. and Tsakiris, G. (2007). ”Minimum Cost Irrigation Network Design
Using Interactive Fuzzy Integer Programming.” J. Irrig. Drain Eng., 133(3),
242–248.
Wu, I. (1975). Design of drip irrigation main lines. Journal of Irrigation and
Drainage Division, Vol.101, No.4, pp. 265-278.
Wu, Z. and Simpson, A. (2001). ”Competent Genetic-Evolutionary Optimization of
Water Distribution Systems.” J. Comput. Civ. Eng., 15(2), 89–101.
Zecchin, A., Simpson, A., Maier, H., Leonard, M., Roberts, A., and Berrisfors, M.
(2006) Application of two ant colony optimization algorithms to water
distribution system optimization. Mathematical and Computer Modeling,
Vol.44, No. 5-6, pp. 451-468
