
Battle of Postdisaster Response and Restoration
Diego Paez
1
; Yves Filion, M.ASCE
2
; Mario Castro-Gama
3
; Claudia Quintiliani
4
; Simone Santopietro
5
;
Chris Sweetapple
6
; Fanlin Meng
7
; Raziyeh Farmani
8
; Guangtao Fu
9
; David Butler
10
; Qingzhou Zhang
11
;
Feifei Zheng
12
; Kegong Diao
13
; Bogumil Ulanicki
14
; Yuan Huang
15
; Jochen Deuerlein
16
; Denis Gilbert
17
;
Edo Abraham
18
; Olivier Piller
19
; Alicja Ba
łut
20
; Rafa
ł Brodziak
21
; J
ędrzej Bylka
22
; Przemys
ław Zakrzewski
23
;
Yuanzhe Li
24
; Jinliang Gao
25
; Cai Jian
26
; Chenhao Ou
27
; Shiyuan Hu
28
; Sophocles Sophocleous
29
;
Eirini Nikoloudi
30
; Herman Mahmoud
31
; Kevin Woodward
32
; Michele Romano
33
;
Giovanni Francesco Santonastaso
34
; Enrico Creaco
35
; Armando Di Nardo
36
; Michele Di Natale, F.ASCE
37
;
Attila Bibok
38
; Camilo Salcedo
39
; Andrés Aguilar
40
; Paula Cuero
41
; Sebastián González
42
; Sergio Mu
˜noz
43
;
Jorge Pérez
44
; Alejandra Posada
45
; Juliana Robles
46
; Kevin Vargas
47
; Marco Franchini
48
;
Stefano Galelli, M.ASCE
49
; Joong Hoon Kim
50
; Pedro Iglesias-Rey, A.M.ASCE
51
; Zoran Kapelan
52
;
Juan Saldarriaga, A.M.ASCE
53
; Dragan Savic, A.M.ASCE
54
; and Thomas Walski, F.ASCE
55
Abstract: The paper presents the results of the Battle of Postdisaster Response and Restoration (BPDRR) presented in a special session at the
first International water distribution systems analysis & computing and control in the water industry (WDSA/CCWI) Joint Conference, held
in Kingston, Ontario, Canada, in July 2018. The BPDRR problem focused on how to respond and restore water service after the occurrence of
five earthquake scenarios that cause structural damage in a water distribution system. Participants were required to propose a prioritization
schedule to fix the damages of each scenario while following restrictions on visibility/nonvisibility of damages. Each team/approach was
evaluated against six performance criteria: (1) time without supply for hospital/firefighting, (2) rapidity of recovery, (3) resilience loss,
(4) average time of no user service, (5) number of users without service for eight consecutive hours, and (6) water loss. Three main types
of approaches were identified from the submissions: (1) general-purpose metaheuristic algorithms, (2) greedy algorithms, and (3) ranking-
based prioritizations. All three approaches showed potential to solve the challenge efficiently. The results of the participants showed that for
this network, the impact of a large-diameter pipe failure on the network is more significant than several smaller pipes failures. The location of
isolation valves and the size of hydraulic segments influenced the resilience of the system during emergencies. On average, the interruptions
to water supply (hospitals and firefighting) varied considerably among solutions and emergency scenarios, highlighting the importance
of private water storage for emergencies. The effects of damages and repair work were more noticeable during the peak demand periods
(morning and noontime) than during the low-flow periods; and tank storage helped to preserve functionality of the network in the first few
hours after a simulated event.
DOI:
10.1061/(ASCE)WR.1943-5452.0001239
. © 2020 American Society of Civil Engineers.
1
Former Ph.D. Candidate, Dept. of Civil Engineering, Queen
’s Univ.,
58 University Ave., Kingston, Ontario, Canada K7L 3N9 (correspond-
ing author). ORCID: https://orcid.org/0000-0003-4586-8025. Email:
da.paez270@gmail.com
2
Associate Professor, Dept. of Civil Engineering, Queen
’s Univ., 58
University Ave., Kingston, Ontario, Canada K7L 3N9.
3
Researcher, KWR Watercycle Research Institute, Groningenhaven 7,
3433 PE Nieuwegein, Netherlands. ORCID: https://orcid.org/0000-0002
-9081-2672
4
Researcher, KWR Watercycle Research Institute, Groningenhaven 7,
3433 PE Nieuwegein, Netherlands. ORCID: https://orcid.org/0000-0002
-0841-1360
5
Ph.D. Candidate, Dipartimento di Ingegneria Civile e Meccanica,
Univ. of Cassino and Southern Lazio, Via Gaetano Di Biasio 43, 03043
Cassino, Italy.
6
Research Fellow, Centre for Water Systems, Univ. of Exeter, North
Park Rd., Exeter EX4 4QF, UK.
7
Associate Research Fellow, Centre for Water Systems, Univ. of Exeter,
North Park Rd., Exeter EX4 4QF, UK.
8
Associate Professor, Centre for Water Systems, Univ. of Exeter, North
Park Rd., Exeter EX4 4QF, UK. ORCID: https://orcid.org/0000-0001
-8148-0488
Note. This manuscript was submitted on June 14, 2019; approved on
January 31, 2020; published online on June 10, 2020. Discussion period
open until November 10, 2020; separate discussions must be submitted for
individual papers. This paper is part of the Journal of Water Resources
Planning and Management, © ASCE, ISSN 0733-9496.
9
Senior Lecturer, Centre for Water Systems, Univ. of Exeter, North Park
Rd., Exeter EX4 4QF, UK. ORCID: https://orcid.org/0000-0003-1045
-9125
10
Professor, Centre for Water Systems, Univ. of Exeter, North Park Rd.,
Exeter EX4 4QF, UK.
11
Postdoctoral Fellow, College of Civil Engineering and Architecture,
Zhejiang Univ., 866 Yuhangtang Rd., Hangzhou 310027, China. ORCID:
https://orcid.org/0000-0003-3267-8441
12
Professor, College of Civil Engineering and Architecture, Zhejiang
Univ., 866 Yuhangtang Rd., Hangzhou 310027, China.
13
Lecturer, School of Engineering and Sustainable Development,
De Montfort Univ., Gateway House, Leicester LE1 9BH, UK.
14
Professor, School of Engineering and Sustainable Development,
De Montfort Univ., Gateway House, Leicester LE1 9BH, UK.
15
Postdoctoral Fellow, College of Civil Engineering and Architecture,
Zhejiang Univ., 866 Yuhangtang Rd., Hangzhou 310027, China.
16
Senior Researcher, 3S Consult GmbH, Albtalstrasse 13, 76137
Karlsruhe, Germany.
17
Research Engineer, L
’unité de recherche Environnement, territoires
et infrastructures, Water Dept., Irstea, Bordeaux Regional Centre, Cestas
F-33612, France. ORCID: https://orcid.org/0000-0002-3554-1419
18
Assistant Professor, Faculty of Civil Engineering and Geosciences,
Delft Univ. of Technology, Stevinweg 1, 2628 CN, Delft, Netherlands.
ORCID: https://orcid.org/0000-0003-0989-5456
19
Senior Research Scientist, L
’unité de recherche Environnement, ter-
ritoires et infrastructures, Water Dept., Irstea, Bordeaux Regional Centre,
Cestas F-33612, France. ORCID: https://orcid.org/0000-0002-3625-7639
© ASCE
04020067-1
J. Water Resour. Plann. Manage.
J. Water Resour. Plann. Manage., 2020, 146(8): 04020067
Downloaded from ascelibrary.org by Universidad de los Andes on 03/08/22. Copyright ASCE. For personal use only; all rights reserved.

Introduction
A water distribution network (WDN) is one of the critical lifeline
systems in a city. Its vulnerability to earthquakes and other natural
disasters not only threatens residential, commercial, and industrial
activities, but also can affect the capacity to attend to subsequent
emergencies. Two of the most analyzed examples in the literature
are the January 17, 1994, Northridge earthquake (Los Angeles,
California) and the January 17, 1995, Kobe earthquake (Japan). The
first case resulted in more than 450,000 people losing water service
and at least eight hospitals evacuated due to water and power dam-
ages, whereas for the second case, the earthquake affected the sup-
ply to more than 1.5 million people and required more than 30 h to
extinguish the fires due to water unavailability in many hydrants
(
PAHO 1998
).
Considering the potential vulnerability and key role played by
WDN during seismic events, researchers have focused on three
main topics: (1) how to assess the reliability of WDNs and other
lifelines after extreme seismic events (e.g.,
Hwang et al. 1998
;
Wang and O
’Rourke 2006
;
Shi and O
’Rourke 2006
,
Fragiadakis
et al. 2013
;
Liu et al. 2015
); (2) how to reinforce the systems to
minimize the impact of a given event (e.g.,
Cimellaro et al. 2015
;
Yoo et al. 2016
); and (3) how to quickly restore the systems to
normal/acceptable conditions after the event (e.g.,
Bonneau and
O
’Rourke 2009
;
Wang et al. 2010
;
Mahmoud et al. 2018
). From
these, the restoration problem has been the least studied, leaving
the prioritization of resources to recover the functionality of the
system to the expertise and criteria of utility operators. Considering
that lives of people are at stake due to vitality of the supply for
firefighting or healthcare purposes, among other considerations,
it is imperative to better characterize this problem and evaluate
if current knowledge of WDNs can be of use in such circumstances.
The Battle of Postdisaster Response and Restoration (BPDRR)
was the eighth call for academic and nonacademic professionals
to address a common problem in the water distribution field.
Dating back to the first Battle in 1985, this series of competitions
have focused on WDNs optimization (1985 and 2012), sensor
placement for contaminant intrusion detection in WDNs (2006);
WDNs model calibration (2010); leakage assessment in WDNs
(2014); district-metered-area sectorization of WDNs (2016); and
detection of cyberattacks on WDNs (2017). For this version, the
Battle competition focused on the how to respond and restore
the service in an existing WDN after the occurrence of five differ-
ent earthquake scenarios that damaged part of the distribution
20
Institute of Environmental Engineering, Pozna
ń Univ. of Technology,
Berdychowo 4, 60-101 Pozna
ń, Poland. ORCID: https://orcid.org/0000
-0002-2106-1051
21
Institute of Environmental Engineering, Pozna
ń Univ. of Technology,
Berdychowo 4, 60-101 Pozna
ń, Poland. ORCID: https://orcid.org/0000
-0002-7320-355X
22
Institute of Environmental Engineering, Pozna
ń Univ. of Technology,
Berdychowo 4, 60-101 Pozna
ń, Poland. ORCID: https://orcid.org/0000
-0001-8471-4315
23
Institute of Computing Science, Pozna
ń Univ. of Technology,
Piotrowo 3A, 60-965 Pozna
ń, Poland.
24
Dept. of Fluid Control and Automation, Harbin Institute of Technol-
ogy, Harbin 150090, China.
25
School of Municipal and Environmental Engineering, Harbin Institute
of Technology, Harbin 150090, China.
26
Dipartimento di Ingegneria Civile e Architettura, Harbin Institute of
Technology, Harbin 150090, China.
27
Dipartimento di Ingegneria Civile e Architettura, Harbin Institute of
Technology, Harbin 150090, China.
28
Dipartimento di Ingegneria Civile e Architettura, Harbin Institute of
Technology, Harbin 150090, China.
29
Research Engineer, Centre for Water Systems, Univ. of Exeter, North
Park Rd., Exeter EX4 4QF, UK.
30
Ph.D. Candidate, Centre for Water Systems, Univ. of Exeter, North
Park Rd., Exeter EX4 4QF, UK. ORCID: https://orcid.org/0000-0002
-6482-184X
31
Ph.D. Candidate, College of Engineering, Univ. of Duhok, Zakho St.
38, 1006 AJ Duhok, Kurdistan Region 99454, Iraq.
32
Strategy Lead, United Utilities Group PLC, Lingley Green Ave.,
Warrington WA5 3LP, UK.
33
Senior Engineer, United Utilities Group PLC, Lingley Green Ave.,
Warrington WA5 3LP, UK.
34
Ph.D. Candidate, Università della Campania
“L. Vanvitelli”, Via
Roma, 29, 81031 Aversa, Italy.
35
Associate Professor, Dipartimento di Ingegneria Civile e Architettura,
Università di Pavia, Via Ferrata 3, 27100 Pavia, Italy. ORCID: https://orcid
.org/0000-0003-4422-2417
36
Professor, Università della Campania
“L. Vanvitelli”, Via Roma, 29,
81031 Aversa, Italy.
37
Professor, Università della Campania
“L. Vanvitelli”, Via Roma, 29,
81031 Aversa, Italy.
38
Technical Development Engineer, Budapest Univ. of Technology
and Economics, M
űegyetem rkp, 3 Budapest, Hungary. ORCID: https://
orcid.org/0000-0003-3992-2881
39
Lecturer, Water Distribution and Sewer Systems Research Center
(CIACUA), Universidad de los Andes, Bogotá 111711018, Colombia.
ORCID: https://orcid.org/0000-0002-0248-7276
40
Research Engineer, Water Distribution and Sewer Systems Research
Center (CIACUA), Universidad de los Andes, Bogotá 111711018,
Colombia. ORCID: https://orcid.org/0000-0001-9209-7388
41
Research Engineer, Water Distribution and Sewer Systems Research
Center (CIACUA), Universidad de los Andes, Bogotá 111711018,
Colombia.
42
Research Engineer, Water Distribution and Sewer Systems Research
Center (CIACUA), Universidad de los Andes, Bogotá 111711018,
Colombia. ORCID: https://orcid.org/0000-0002-3208-9172
43
Research Engineer, Water Distribution and Sewer Systems Research
Center (CIACUA), Universidad de los Andes, Bogotá 111711018,
Colombia. ORCID: https://orcid.org/0000-0002-9746-3452
44
Research Engineer, Water Distribution and Sewer Systems Research
Center (CIACUA), Universidad de los Andes, Bogotá 111711018,
Colombia.
45
Research Engineer, Water Distribution and Sewer Systems Research
Center (CIACUA), Universidad de los Andes, Bogotá 111711018,
Colombia. ORCID: https://orcid.org/0000-0002-7062-1086
46
Research Engineer, Water Distribution and Sewer Systems Research
Center (CIACUA), Universidad de los Andes, Bogotá 111711018,
Colombia. ORCID: https://orcid.org/0000-0002-8643-7830
47
Research Engineer, Water Distribution and Sewer Systems Research
Center (CIACUA), Universidad de los Andes, Bogotá 111711018,
Colombia.
48
Professor, Engineering Dept., Università di Ferrara, Via Saragat, 1,
44122 Ferrara, Italy.
49
Assistant Professor, Pillar of Engineering Systems and Design,
Singapore Univ. of Technology and Design, 8 Somapah Rd., Singapore
487372.
50
Professor, School of Civil, Environmental and Architectural Engineer-
ing, Korea Univ., Seoul 02841, South Korea.
51
Associate Professor, Departamento de Ingeniería Hidráulica y Medio
Ambiente, Universidad Politécnica de Valencia, Camino de Vera s/n-46022
(Valencia), Spain. ORCID: https://orcid.org/0000-0001-8300-3255
52
Professor, Faculty of Civil Engineering and Geosciences, Delft Univ.
of Technology, Stevinweg 1, 2628CN Delft, Netherlands.
53
Professor, Dept. of Civil and Environmental Engineering, Universidad
de los Andes, Carrera 1 Este No. 19A-40. Bogotá, Colombia.
54
Chief Executive Officer, KWR Watercycle Research Institute,
Groningenhaven 7, 3433 PE Nieuwegein, Netherlands. ORCID: https://
orcid.org/0000-0001-9567-9041
55
Bentley Fellow, Bentley Systems, 3 Brians Pl., Nanticoke, PA 18634.
© ASCE
04020067-2
J. Water Resour. Plann. Manage.
J. Water Resour. Plann. Manage., 2020, 146(8): 04020067
Downloaded from ascelibrary.org by Universidad de los Andes on 03/08/22. Copyright ASCE. For personal use only; all rights reserved.
network. The results of the BPDRR were presented in a special
session in the first water distribution systems analysis & comput-
ing and control in the water industry (WDSA/CCWI) Joint
Conference, held in Kingston, Ontario, Canada, in July 2018.
This paper summarizes the challenge and results and makes rec-
ommendations for future research of the topic.
Problem Formulation
The challenge addressed in the Battle is the one of identifying the
best operational response in terms of restoration interventions to
return a water distribution network to fully functioning precata-
strophic event condition.
After an earthquake, damages to a WDN can degrade the water
service in a city. There can be different approaches for prioritization
of available resources in order to restore the water service. To evalu-
ate the performance of the different approaches, a set of five post-
disaster damage scenarios was generated on a model of the B-City
water distribution network, and participants were invited to propose
responses and restoration methods to return the system to pre-
earthquake conditions. These damage scenarios, along with a cali-
brated EPANET model of the network, and a description of the
performance criteria, were provided to the participants. The prob-
lem description has been given by Paez et al. (
2018a
).
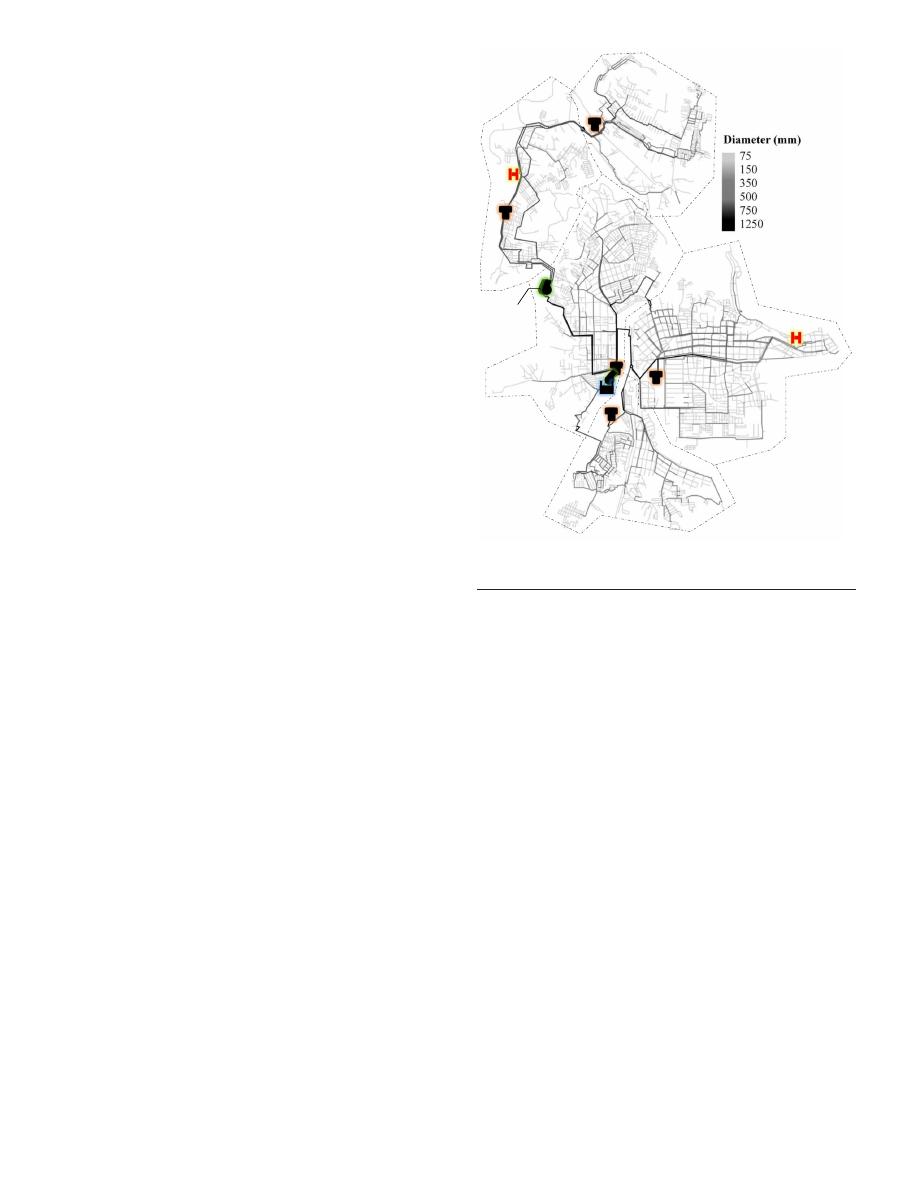
B-City
B-City is a water distribution network model of a real system in
an undisclosed location. The network consists of 4,909 junctions,
6,064 pipes, 1 reservoir, 4 pumps divided between two pump
stations, and 5 district metered areas (DMAs), each with one water
tank (Fig.
1
). A total of 5,963 isolation valves are also distributed
along the pipes of the network, delimiting 2,451 segments as defined
by Walski (
1993
). The calibrated model also includes 24-h demand
patterns for residential and commercial/industrial consumers. The
daily mean consumption on a typical day is
1,023.8 L=s.
For precatastrophic conditions, the minimum pressure during
the day among all demand nodes is 24.5 m, which means that
the demand is fully supplied (the minimum required pressure is
20.0 m). Additionally, the tanks do not get emptied at any point,
and their minimum levels vary from 0.62 to 1.09 m.
Damage Scenarios
One important assumption required to develop the problem was to
consider that out of all network elements, only pipes were damaged
during the events. In other words, facilities like pump stations,
tanks, and the source reservoir were assumed to remain operational
at all times. This assumption is consistent with remarks by
Tabucchi et al. (
2010
), and even though PAHO (
1998
) mentioned
examples of tanks and pump stations structurally affected by earth-
quakes or disconnected temporally from the electric grid, they are
significantly less common than damages in pipelines (
Tabucchi
et al. 2010
).
To stochastically generate pipe damage scenarios, a Poisson
process was used (
Shi and O
’Rourke 2006
). Therefore, the prob-
ability that a pipe was damaged during the earthquake is given by
Eq. (
1
)
Pðx
i
Þ ¼ 1 − e
−λ
i
L
i
ð1Þ
where x
i
= event that pipe i is damaged
ði ∈ f1; : : : ; 6,064gÞ; L
i
=
length of the pipe i (m); and
λ
i
= average number of seismic-
induced damages per meter for that type of pipe. The values of
λ
i
were assumed as
0.0003 damages=m for pipes with diameter
under 300 mm and
0.00005 damages=m for larger-diameter pipes,
which is a simplification within the ranges presented by the Ameri-
can Lifelines Alliance (
2001
). This means that the effect of other
factors mentioned in the previous studies, like type of soil, pipe
material, pipe age, and type of joints, on the probability of damage
was assumed homogeneous for all pipes.
According to Ballantyne et al. (
1990
) and Hwang et al. (
1998
),
the damages in pipes can be classified as leaks, which are minor
damages that can be fixed by installing clamps or welding cracks,
and breaks, which are more serious damages that require a replace-
ment of entire pipe sections. The conditional probability that a dam-
age was a break was taken as 0.20 for all pipes according to the
assumption by Hazards United States (HAZUS) (
NIBS 1997
)
for damages generated by propagation of seismic waves
Pðy
i
jx
i
Þ ¼ 0.20
ð2Þ
where y
i
= event that pipe i is broken. It is worth mentioning that
according to the HAZUS method, when the damages are caused by
a permanent ground displacement, the probability of a break is con-
siderably higher.
After an earthquake disaster, fires are also expected; therefore,
firefighting flows must also be supplied. To include them in the
model, two nodes per scenario were randomly selected and as-
signed a fire flow demand of
35 L=s that would only stop until
the delivered/supplied water reached 756,000 L (corresponding
to a 6 h-duration fire if the flow was fully supplied). The number
of fire flow nodes was arbitrarily chosen, and the flow rate was
suggested by members of the Committee (Franchini, Galelli,
3 pumps
Fig. 1. B-City water distribution network. Dotted lines delimit DMAs
and H represents the hospitals.
© ASCE
04020067-3
J. Water Resour. Plann. Manage.
J. Water Resour. Plann. Manage., 2020, 146(8): 04020067
Downloaded from ascelibrary.org by Universidad de los Andes on 03/08/22. Copyright ASCE. For personal use only; all rights reserved.
Kim, Iglesias-Rey, Kapelan, Saldarriaga, Savic, and Walski, Battle
of the Network Models Committee, unpublished report).
Using these assumptions, a set of five deterministic postdisaster
damage scenarios was generated and provided to the participants,
and a likelihood based on the probability of the state of each pipe
was assigned to each scenario as a weight for the performance
evaluation (computed as the logarithm of the normalized product
of individual probabilities for the pipes). Fig.
2
shows one of the
five postdisaster damage scenarios as an example.
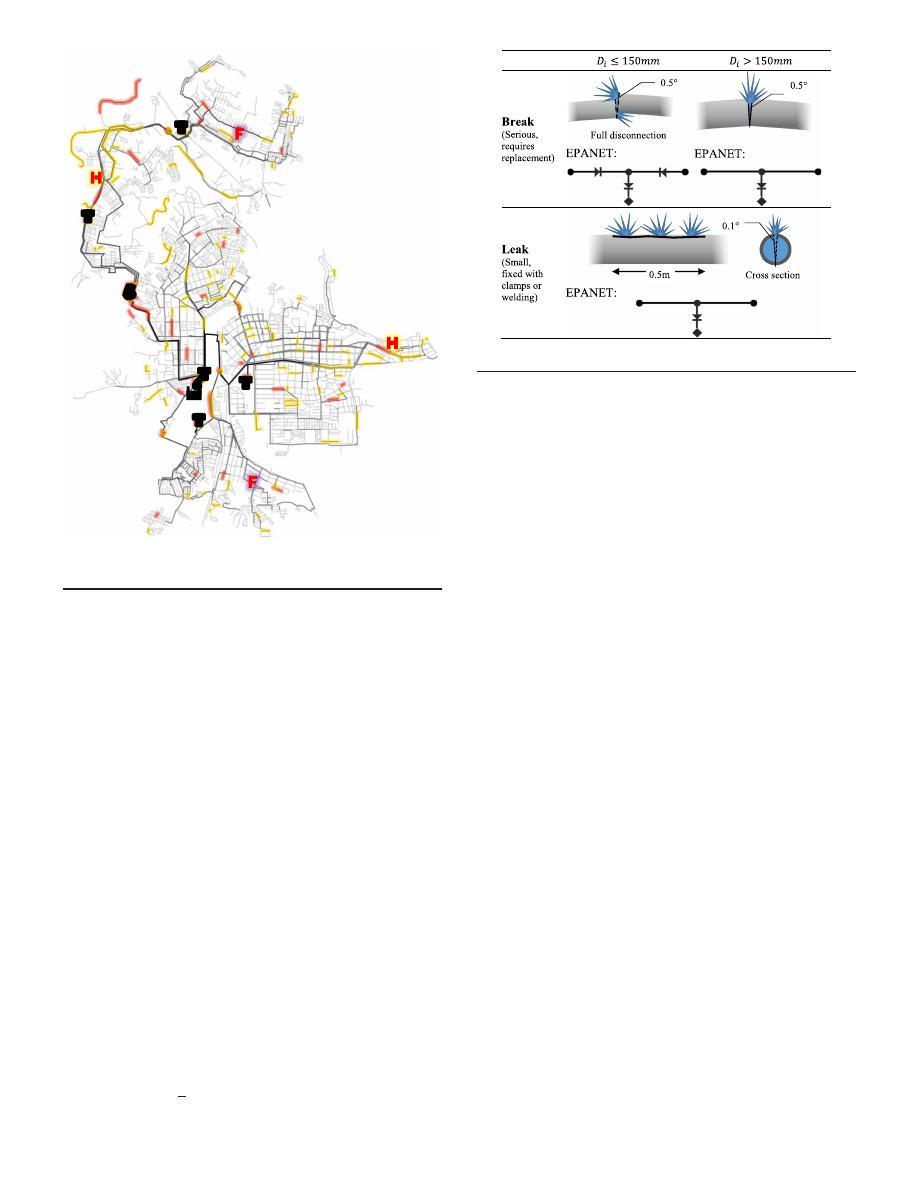
Damages Modeling
To model the hydraulic effect of damages in the network, an emitter
was located at the midpoint of the damaged pipe to simulate its
water losses. In order to avoid reverse flows at the emitter (i.e., in-
flows) caused by negative pressures, a dummy check valve was also
included upstream of the emitter. One additional assumption was
that breaks in pipes with diameters under 150 mm were assumed
to produce a full disconnection between the two ends of the pipe;
therefore, the two halves of the pipe were modeled as check valves.
The emitters used to simulate water losses followed Eq. (
3
), with
Eqs. (
4
) and (
5
) for the emitter coefficients (
Shi and O
’Rourke
2006
)
Q
i
ðtÞ ¼ K
i
·
ðh
i
ðtÞÞ
0.5
ð3Þ
K
i
¼ 0.5 m · 0.1° · D
i
·
ffiffiffiffiffi
2g
p
for leaks
ð4Þ
K
i
¼ π
2
·
0.5° · D
2
i
·
ffiffiffiffiffi
2g
p
for breaks
ð5Þ
where Q
i
ðtÞ = outflow from the emitter i at time t; h
i
ðtÞ = pressure
head at the midpoint of pipe i at time t; D
i
= diameter of pipe i; and
K
i
= emitter coefficient that represents a 0.5-m longitudinal
crack with an angle of 0.1° for leaks and a 0.5° round crack for
breaks (Fig.
3
).
To consider that not all damages are immediately detected by the
water utilities, some of them were considered nonvisible, meaning
that they could not be detected, and therefore fixed, only until some
time after the event. Leaks in pipes with a diameter under 300 mm
and breaks in pipes with diameter under 150 mm were assumed
nonvisible unless they reached an outflow higher than
2.5 L=s
(values based on the experience of some members of the Com-
mittee). However, 48 h after the event, it was assumed that some
pressure tests and inspections would be carried out, making all
damages visible after that time. Visibility of damages was impor-
tant from the network restoration point of view (discussed in the
next section).
Response and Network Restoration
After the occurrence of an earthquake, the water utility would re-
quire some reaction time (assumed 30 min here) before the crews
can be dispatched to begin the restoration works. There were as-
sumed to be three crews able to work 24 h independently of the
turns of each worker, and they could perform four basic tasks: iso-
late, repair, replace, and reopen.
Both leaking and broken pipes could be isolated by sending a
crew to the damage location (even though it is strictly necessary
for broken pipes only). It was assumed that the water utility
knows the location of all isolation valves in the network, and
therefore, isolating a pipe consists of closing all the valves in
the hydraulic segment that contains it. Isolation of pipes serves
two main purposes: stop water leaking from the network at a cer-
tain damage location, and dry the pipes in the segment so they can
be replaced if required.
Leaking pipes must be repaired. To repair a leaking pipe, a crew
must be sent to the pipe location where they need to locate the
leakage, excavate, repair the pipe either with a clamp or by welding,
and restore trench conditions. Broken pipes must be replaced.
To replace a broken pipe, it must first be isolated, excavated, re-
placed, and trench conditions must be restored (disinfection and
pressure tests are assumed to be omitted in an emergency scenario).
Fig. 3. Schematic representation of breaks and leaks.
T1
Fig. 2. Damage scenario 01. Breaks and leaks are highlighted, and fire
flows marked with an F.
© ASCE
04020067-4
J. Water Resour. Plann. Manage.
J. Water Resour. Plann. Manage., 2020, 146(8): 04020067
Downloaded from ascelibrary.org by Universidad de los Andes on 03/08/22. Copyright ASCE. For personal use only; all rights reserved.

Finally, an isolation valve could be reopened to restore supply to the
affected area, once damages were fixed.
The time each crew was assumed to take to isolate, repair and
replace a pipe is given in Table
1
, where some simplified relations
have been adjusted to the data presented by Porter (
2016
). Trans-
portation times and times for reopening of valves are assumed to be
included in the figures and expressions in Table
1
.
Participants were required to propose a prioritization schedule
for the three crews for each scenario, indicating in which order to
isolate, repair or replace damages in the network while following
two restrictions: (1) only visible damages could be fixed (details on
visible/nonvisible damages have been given in the previous sec-
tion), and (2) only pipes whose hydraulic segment had been pre-
viously isolated could be replaced. Table
2
offers an example of the
schedules given by participant teams.
Performance Criteria
Because the system is working under low-pressure conditions, the
pressure-driven method of Paez et al. (
2018b
) was used to compute
nodal supplied flows (Q
i
) and compare them with demand
ðQD
i
Þ as
follows:
Q
i
ðp
i
Þ ¼
8
>
>
>
<
>
>
>
:
0
if p
i
≤ 0
→ enforced by a check valve
QD
i
p
i
p
req
n
0 < p
i
≤ p
req
→ enforced by a throttle control valve
QD
i
p
i
> p
req
→ enforced by a flow control valve
ð6Þ
where p
i
= actual pressure head at node i; and p
req
= minimum
required pressure head to ensure full supply (assumed 20 m here).
The functionality of the system at a certain time t is then defined
as the percentage of the total demand that is supplied by the net-
work according to the pressure-driven model [based on the serv-
iceability index discussed by Shi and O
’Rourke (
2006
)]:
Functionality
ðtÞ ¼ 100% ·
X
Demand
nodes
Q
i
ðtÞ
, X
Demand
nodes
DQ
i
ðtÞ
ð7Þ
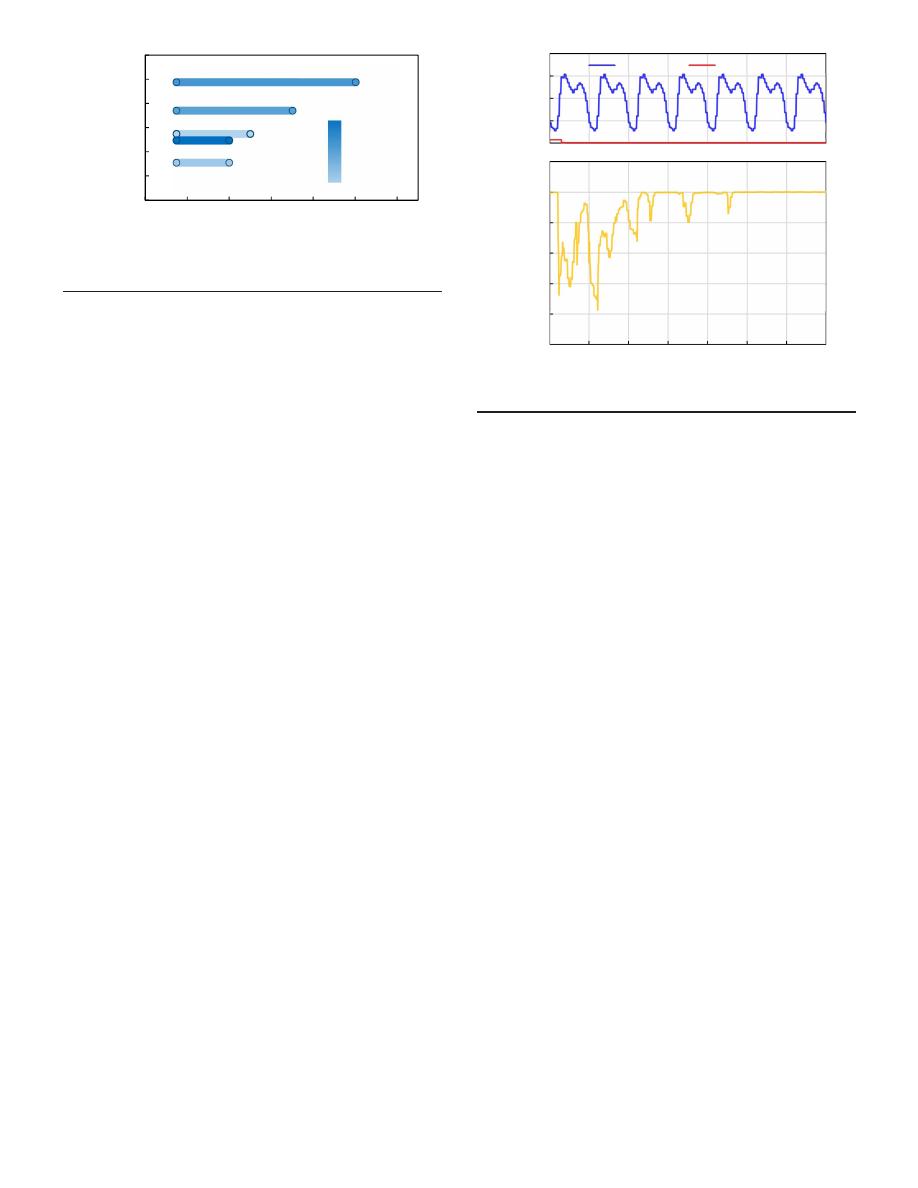
Fig.
4
shows the expected behavior of the functionality as the
network gets gradually fixed. Because the demand varies in time, it
is likely that the system can fulfill a higher percentage of the
demand during nights, whereas during mornings, when demand
increases, the supplied percentage decreases, producing these peaks
and troughs in the functionality trend.
For each scenario, the schedules proposed by the participants
were evaluated according to six main criteria:
1. Time that the hospitals and the firefighting flows are without
supply (Fire & hosp.), calculated as the time step of the simu-
lation times the number of time steps in which the supply/
demand ratio for the hospitals and firefighting flows was less
than 0.5
Fire
& hosp:
¼ Δt ·
X
Hospitals and
Firefight nodes
count
t∈T
ftjQ
i
ðtÞ=DQ
i
ðtÞ ≤ 0.5g ðminÞ
ð8Þ
Table 1. Tasks duration times per pipe
Task
Duration time per pipe
Isolate
15 min=valve
Repair
a
0.223 · D
0.577
i
Replace
a
0.156 · D
0.719
i
a
D
i
in mm and resulting times in hours (rounded to the lowest hour).
Table 2. Example of prioritization schedule
Crew
List of tasks
(ordered chronologically)
Crew 01
Isolate P136
Isolate P283
Repair P206
Replace P152
Repair P242
...
Crew 02
Isolate P367
Isolate P152
Replace P367
Replace P136
Repair P154
...
Crew 03
Isolate P105
Replace P105
Repair P254
Repair P221
Isolate P133
...
Fu
ncti
o
n
ality
(Water su
pp
ly
r
ate)
100%
0%
Occu
rren
ce time
t
0
t
95
t
100
Reaction time
Resilience Loss
95%
Fig. 4. Time variation of functionality as the system is gradually
fixed.
© ASCE
04020067-5
J. Water Resour. Plann. Manage.
J. Water Resour. Plann. Manage., 2020, 146(8): 04020067
Downloaded from ascelibrary.org by Universidad de los Andes on 03/08/22. Copyright ASCE. For personal use only; all rights reserved.

where T = set of all 15-min time steps starting on Day 01 at
6:00 a.m. and ending at Day 07 at 6:00 a.m.; and
Δt ¼ 15 min.
2. Time until the system recovers permanently 95% of its function-
ality (rapidity of recovery, t
95
), calculated as the last (maximum)
time step in which the functionality is lower than 95% (Fig.
4
)
t
95
¼ max
t∈T
ftjFunctionality ðtÞ ≤ 95%g ðminÞ
ð9Þ
3. Accumulated loss of functionality from the occurrence of the
disaster until full recovery [Resilience loss (Res. loss)], calcu-
lated as the area between the 100% line and the functionality
time series (Fig.
4
)
Res
: loss ¼ Δt ·
X
t∈T
ð100% − Functionality ðtÞÞ ð% × minÞ
ð10Þ
4. Average time across demand nodes, each consumer (network
node) is without service (Time no serv.), calculated by multiply-
ing the time step and the number of time steps in which the
supply/demand ratio was less than 0.5 for each node, and then
dividing by the total number of demand nodes (DN
¼ 4,201):
Time no serv
:
¼ Δ
t
DN
·
X
Demand
nodes
count
t∈T
ftjQ
i
ðtÞ=DQ
i
ðtÞ ≤ 0.5g ðminÞ
ð11Þ
5. Number of consumers (network nodes) without service for more
than eight consecutive hours (Nodes no serv.), calculated by
counting the number of nodes with more than one time step
in which the next 8 h had always a supply/demand ratio lower
than 0.5
Nodes no serv
: ¼ count
Demand
nodes
ijcount
t∈T
t
Q
i
ðt − ΔtÞ
DQ
i
ðt − ΔtÞ
≤ 0.5
∀Δt ∈ ð0; 8 hÞ
≥ 1
ðnodesÞ
ð12Þ
6. Volume of water lost during the 7 days after the event (Water
loss), calculated as the sum of the outflows across all damages in
the network times the time step
Water loss
¼ Δt ·
X
i∈Damages
X
t∈T
Q
i
ðtÞ ðLÞ
ð13Þ
Because there were five scenarios, a total of 30 values had to be
reported by each team. To assess an approach, each of the six
criteria was averaged among the five scenarios using the likeli-
hoods previously described in the
“Damage Scenarios” section
as weights, giving as a result one average performance per criteria
per team.
For this version of the Battle, it was a deliberate decision
not to provide a unified metric to rank the solutions. Instead, it
was left to the participants
’ engineering judgment to prioritize
the six criteria as they considered appropriate for the city. This
decision was taken by the Committee (Franchini, Galelli, Kim,
Iglesias-Rey, Kapelan, Saldarriaga, Savic, and Walski, Battle of
the Network Models Committee, unpublished report) as a way to
allow different approaches including nonoptimization frameworks
in the competition.
Postdisaster Response and Restoration Algorithms
Ten teams participated in the BPDRR and submitted their ap-
proaches, prioritization schedules, results, and recommendations.
This section briefly describes each approach.
Castro-Gama et al. (
2018
) proposed an implementation based on
a preliminary graph theory analysis of the network required to iden-
tify neighboring pipes. Second, an
ε-multiobjective evolutionary
(
ε-MOEA) algorithm (
Deb et al. 2005
) from an optimization library
for Python: Platypus was used to obtain the Pareto front for the six
criteria. Decision variables were set as a permutation of the possible
interventions. The procedure took into account a constant time
of displacement between locations (30 min), which increased the
operation time of each crew from the values in Table
1
. From the six-
dimensional (6D) Pareto front, a single solution per scenario was
selected based on a visual analytics approach (
Castro-Gama et al.
2017
). The
ε-MOEA solution was also compared with the one
obtained using a greedy algorithm. Both methods showed similar
outcomes with different prioritization of interventions, although
the latter had the advantage of requiring only 30% of the computa-
tional time of the former. Finally, four engineering interventions
(to increase/decrease the storage capacity or the pump flow) were
evaluated for each selected solution and damage scenario.
Sweetapple et al. (
2018
) developed an approach based upon
graph theory and heuristic methodologies. First, graph theory
was used to enable identification of hydraulic segments (
Meng
et al. 2018
), and subsequently, the valve operations required to iso-
late each pipe break. Next, a single performance indicator incorpo-
rating all six objectives was developed to enable the problem to be
reformulated as a single objective (assuming equal weights). Lastly,
actions (i.e., isolations, replacements, and repairs) were allocated to
each crew using an adaptation of the nearest neighbor algorithm
(
Cover and Hart 1967
), a greedy optimization heuristic. In this ap-
proach, performance was evaluated starting with no actions and
adding subsequent actions. Each new action was assigned to the
first crew that finished the previously assigned actions. At each
stage, the next action selected was the one that provided the greatest
performance benefit (represented by the single objective value),
given the specified prior actions and not accounting for future
actions.
Zhang et al. (
2018
) proposed a dynamic optimization frame-
work with the objective function consisting of six different met-
rics summed by introducing weights. To identify an optimal
sequencing of recovery actions for each postearthquake scenario,
a tailored genetic algorithms
–based optimization algorithm was
used, where the algorithm operators were modified to identify the
optimal sequencing of recovery actions for postdisaster WDNs.
The most important feature of the proposed method was that the
total number of the decision variables (damaged segments) and
the decision variables themselves (e.g., pipes that need to be re-
paired) could both vary when the hydraulic status of the WDN
was updated. That updating process was carried out at the com-
pletion of each intervention to the postdisaster WDN, and the final
sequencing of recovery actions for each crew was identified. The
results provided some insights on how to propose an optimal re-
covery plan. For instance, certain broken pipes were fixed be-
tween particular time stamps to avoid negative effects on the
service level at some critical locations.
Deuerlein et al. (
2018
) proposed greedy heuristics to schedule
isolation, repairs, and replacement by minimizing a weighted sum
© ASCE
04020067-6
J. Water Resour. Plann. Manage.
J. Water Resour. Plann. Manage., 2020, 146(8): 04020067
Downloaded from ascelibrary.org by Universidad de los Andes on 03/08/22. Copyright ASCE. For personal use only; all rights reserved.

of the objectives. In the disaster response, the trade-off between
water loss and the other criteria was explored. The method used
graph decomposition techniques to identify the valves that isolated
a hydraulic segment for replacement (
Deuerlein 2008
). The authors
also analyzed the network hydraulics and how the depletion of
tanks affected service levels. Using these and systematic engineer-
ing judgement (
Gilbert et al. 2017
), recommendations were made
for improving the capacity of the system and its absorptive and
restorative resilience by design. This included the improvement
of pumping stations, installation of control valves, and some pipe
reinforcement. The same greedy task-scheduling algorithm was
then used under these alternative network improvements to evaluate
the improvements with respect to all criteria.
Balut et al. (
2018
) proposed a ranking-based approach where
water network pipes
’ importance was prioritized and applied in
a pipe repair schedule. Several approaches to define the importance
and create the rankings were proposed based on hydraulic analyzes
(using model under normal operating conditions). Expert knowl-
edge was used, collected via conducted surveys, to define the
rankings. Authors surveyed 46 managers, consultants, information
technology (IT) specialists, and water distribution modelers from
utilities, asking them to list the main criteria that influenced the
sequence of repair scheduling, in their opinion. For each disaster
scenario, all types of rankings developed (diameter, diameter and
distance from the source, diameter and velocity, flow with and
without strategic points, and impact of pipes
’ closure on network’s
hydraulics) were applied to schedule tasks for all repair teams.
Additionally, experts were also asked in the surveys to assign
weights to four criteria that addressed the rapidity of recovery, num-
ber of nodes without service, and volume of water lost. Results
from the rankings were evaluated with use of Visual Promethee,
a multicriteria decision aid software, and weights based on the rec-
ommendation by the experts. Calculation of hydraulic parameters
and evaluation of the final solution based on the six predefined cri-
teria were performed using the EPANET-MATLAB toolkit (
Eliades
et al. 2016
).
Li et al. (
2018
) proposed a two-stage WDN restoration method
based on the EPANET-MATLAB toolkit (
Eliades et al. 2016
). In
the first stage, a shortest-path algorithm and greedy algorithm were
used to gain the top priority recovery action for a quick response to
the disaster. Firstly, the Dijkstra algorithm was used to calculate the
shortest path from water source to hospital and fire point. The flow
could be guaranteed to these locations by repairing the damaged
point on the path and closing the valves of the damaged pipeline
closest to the path. Then the greedy algorithm was used to obtain
the restoration order of the remaining pipes. In the second stage, the
particle swarm optimization algorithm was used to minimize the
total amount of water loss during the restoration process.
Sophocleous et al. (
2018
) developed a simulation-based re-
sponse and restoration framework divided into three stages:
(1) preprocessing, where the possible interventions for each crew
were defined together with the time required to complete each in-
tervention, (2) optimization, where an optimized schedule for fix-
ing each damage was established using the nondominated sorting
genetic algorithm II (NSGA-II) and a simplified version of weight-
ing objectives, and (3) restoration planning, where an action plan
(i.e., table of interventions ranked by priority) for each crew was
identified using the optimum solution from Stage 2. The proposed
framework developed a methodology to identify the minimum
number of links required to isolate a damaged pipe and enabled
simplifying the complexity of the optimization problem by
(1) solving two subproblems in sequence (i.e., 2- and 7-day sub-
problems, based on the visibility of the damages); and (2) allocating
to each crew a particular part of the WDN and a specific number of
interventions. This was done through the use of a K-means cluster-
ing
–based approach (
MacQueen 1967
) and engineering judgement
(allowing the assumption that in real-life a crew would not be asked
to deal with damages spread across the whole network). Simula-
tions were run using the EPANET Programmer
’s Toolkit linked
with the MATLAB optimization tool.
Santonastaso et al. (
2018
) adopted a strategy to restore the water
service after an earthquake following two phases: (1) identification
of hydraulic segments, which identified the valves that had to be
closed to isolate the pipe that needed to be repaired (
Creaco et al.
2010
); (2) prioritization of the broken pipes according to a topo-
logical metric, based on the idea of primary network (
Di Nardo
et al. 2017
) in order to organize the maintenance interventions
after the earthquake. The proposed procedure to rank the pipes to
be maintained was stated as follows: (1) compute the betweenness
for all pipes in the network; (2) repair or replace leaking or broken
pipes with high values of edge betweenness; and (3) repeat Step 2
until no pipes remain to be replaced or repaired.
Bibok (
2018
) proposed a two-stage approach to the problem.
A criticality analysis of network segments was carried out using
Bentley System
’s WaterGEMS. It highlighted critical segments
whose size could be reduced by installing additional isolation
valves. The visible leaks were determined by an initial hydraulic
simulation considering the first 30 min. In the second stage, the
optimization problem was reduced to a sorting task, which was car-
ried out by a sorting genetic algorithm. The algorithm
’s genome
was the ordered list of sequentially executed repair events. A swap-
ping operator during mutation was utilized to preserve the consis-
tency of the visible and nonvisible leak lists.
Salcedo et al. (
2018
) proposed a decision support model based
upon a prioritization methodology described as follows. Initially, a
diagnosis of the network was done, including the assessment of the
impact of each pipe within the network based on its reliability
(
Luong and Nagarur 2005
). Then, a prioritization list was devel-
oped considering the weighted sum of seven alternative criteria
to assign the maintenance activities to each crew. These alternative
criteria included the pressure head at hospitals and fire flow nodes,
the functionality of the network after rehabilitating a pipe, water
losses, and the time needed to rehabilitate each damaged pipe. The
weighted list was evaluated at the end of each time step of the
simulation using MATLAB and EPANET Programmer
’s Toolkit.
Finally, the final weights of the decision model were determined
using a sensitivity analysis.
Results and Discussion
Algorithm Performance
Three main types of approaches can be identified from the submis-
sions. The first type of approach was based on using general-
purpose optimization methods, like MOEA, NSGA-II, and genetic
algorithms (
Castro-Gama et al. 2018
;
Zhang et al. 2018
;
Sophocleous et al. 2018
;
Bibok 2018
). In these approaches, the
problem was expressed as an optimal sorting task in which the
decision variables were the order in which each damage on the net-
work was fixed. The solution space was all possible permutations
of the damages, and the objective functions were either the six
criteria from Eqs. (
8
)
–(
13
), a normalized sum of the six criteria
(i.e., a single-objective optimization problem), or a combination
of normalization and weighting of the six criteria. The normaliza-
tion references were the computed range of each criterion (defined
by the maximum and minimum values found), or a reference value
based on an initial solution. The weights, on the other hand, were
© ASCE
04020067-7
J. Water Resour. Plann. Manage.
J. Water Resour. Plann. Manage., 2020, 146(8): 04020067
Downloaded from ascelibrary.org by Universidad de los Andes on 03/08/22. Copyright ASCE. For personal use only; all rights reserved.

mostly based on engineering judgment and sense of importance of
each criterion after a natural disaster.
The second type of approaches was ranking-based prioritiza-
tions, in which different metrics were used to define which pipes
should be fixed first according to their importance (
Balut et al.
2018
;
Santonastaso et al. 2018
;
Salcedo et al. 2018
). In these
approaches, one or various metrics to measure how important is
a pipe with respect to the criteria were proposed and tested (the
number of metrics tested is shown in parentheses in the second col-
umn of Table
3
). The nature of proposed metrics included hydraulic
properties of the pipes, hydraulic consequences of individual
damages, and graph theory metrics. The objective functions used
to evaluate a metric were (1) weighted and normalized sum of the
six criteria for Balut et al. (
2018
); (2) a weighted and normalized
sum of scores developed to simplify computation of the six cri-
teria for Salcedo et al. (
2018
); and (3) the six given criteria for
Santonastaso et al. (
2018
).
Finally, the third type of approaches was based on algorithms
that made local optimum choices aiming to find near-optimal so-
lutions (
Sweetapple et al. 2018
;
Deuerlein et al. 2018
;
Li et al.
2018
). In these approaches, which could be viewed as greedy al-
gorithms, an objective function was defined either as a weighted
and normalized sum of the six criteria or as one of the six criteria
depending on the stage of the optimization. Then, starting at the
initial time of the simulation, all possible actions (damage fixing)
were evaluated, and the one or ones that produced the highest
marginal gain in the objective function were selected to be carried
out. That process was repeated every time an action was com-
pleted until no more actions remained. Li et al. (
2018
) used this
third type of approach in a first stage of their optimization, fol-
lowed by an application of a metaheuristic [particle swarm opti-
mization (PSO)].
Table
3
summarizes the reported results for the six criteria, aver-
aged among the five damage scenarios (using the likelihoods as
weights), for each team. The top three performance values for each
criterion are in bold, with the best performance highlighted with
bold italics.
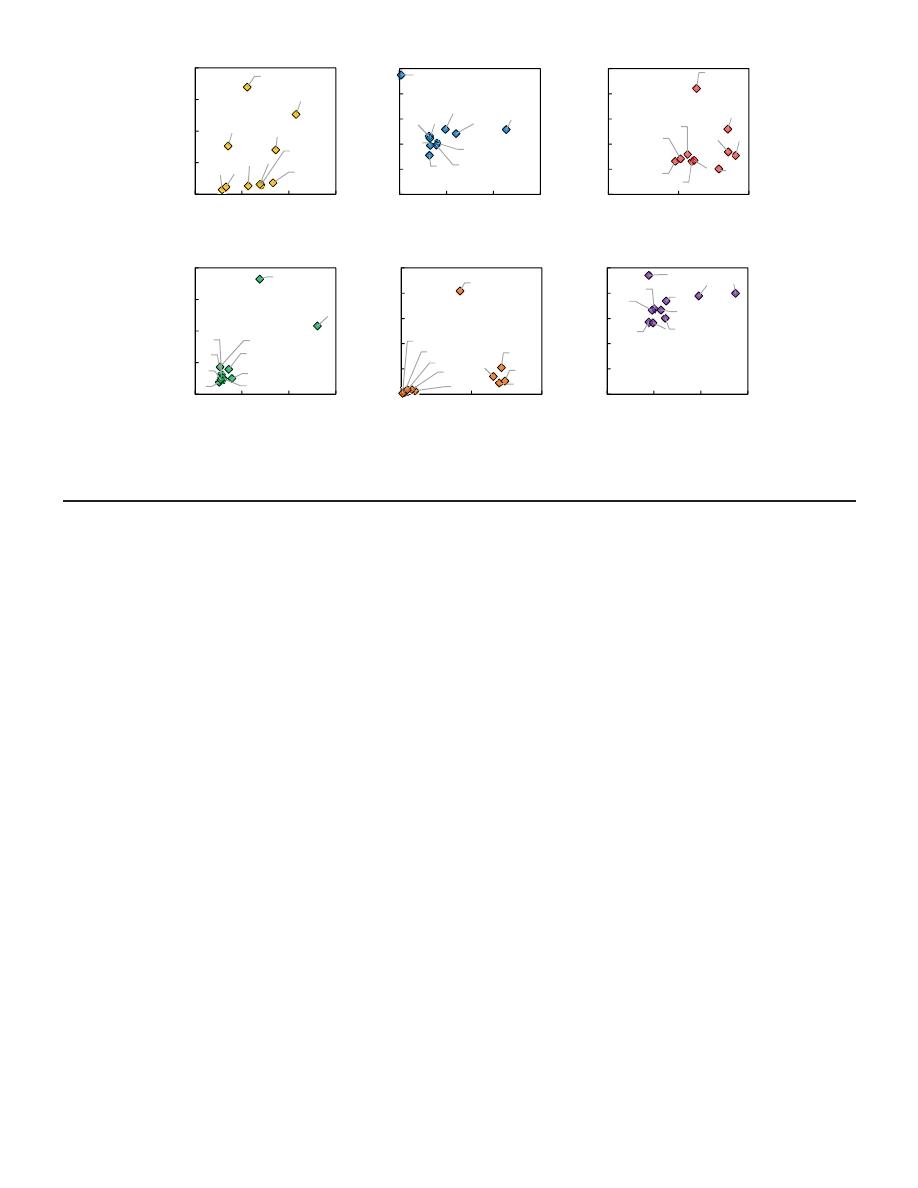
Fig.
5
presents graphically the results of each team in each cri-
terion compared with the average among all teams. Values outside
the dotted line (average), outperformed the average of the 10 teams.
Three teams (
Zhang et al. 2018
;
Deuerlein et al. 2018
;
Salcedo et al.
2018
), one from each type of approach, had all six criteria outper-
forming against the average (all their areas are outside the average
circle), showing that all three approaches have potential in solving
the response and restoration challenge.
Participants
’ Remarks
Participants were also encouraged to suggest some mitigation mea-
sures that the city could take in order to improve the response and
restoration process for other possible scenarios. One factor on
which almost all participants seemed to agree was that installing
more isolation valves would reduce the size of the hydraulic seg-
ments and therefore reduce the impact on the supply of the isola-
tions required to replace a broken pipe.
Castro-Gama et al. (
2018
) also evaluated the effect of increasing
or decreasing the storage and pumping capacity in the network and
found that increasing the storage and pumping capacity reduces the
initial impact of the event (before the interventions). However, once
the fixing schedule is optimized, there is little improvement in the
performance criteria. Sweetapple et al. (
2018
) evaluated the effect
of the disconnection of all hydraulic segments in the network and
suggested the separation of the most upstream segment to avoid
having both Tank T1 and the reservoir isolated simultaneously
Table
3.
Performance
of
participant
teams
in
the
six
def
ined
criteria
T
eam
Algorithm
Optimization/ranking
criteria
Fire
&
hosp.
(min)
t
95
(min)
Res.
loss
(%
×
min)
T
ime
no
serv
.
(min)
Nodes
no
serv
.
(nodes)
W
ater
loss.
(ML)
Castro-Gama
et
al.
(
2018
)
Platypus
ε-MOEA
6
(original
criteria)
1,411
4,094
13,271
38.8
17.9
67,760
Sweetapple
et
al.
(
2018
)
Nearest
neighbo
r
search
1
(weighted
and
normalized
original
criteria)
365
5,154
15,472
49.6
90.0
79,982
Zhang
et
al.
(
2018
)
Impro
ve
d
genetic
algorithm
1
(weighted
and
normalized
original
criteria)
147
3,106
10,195
64.1
28.6
60,380
Deuerlein
et
al.
(
2018
)
Greedy
algorithm
1
(weighted
relati
v
e
increase
of
5
original
criteria)
301
3,918
13,250
54.4
140.3
57,278
Balut
et
al.
(
2018
)
Pipe/damage
rankings
(×
6)
+
Expert
surv
ey
1
(weighted
and
normalized
original
criteria)
3,396
5,184
25,988
79.4
212.1
66,580
Li
et
al.
(
2018
)
Greedy
algorithm
+
PSO
1
(Fire
&
Hosp.
for
stage
1
and
Res.
Loss
for
stage
2)
1,532
3,902
13,574
364.7
818.0
56,624
Sophocleous
et
al.
(
2018
)
NSGA-II
1
(normalized
original
criteria)
2,528
9,510
42,129
86.5
37.6
94,116
Santonastaso
et
al.
(
2018
)
Pipe/damage
ranking
(×
1)
6
(original
criteria)
315
4,845
16,958
50.0
104.9
77,881
Bibok
(
2018
)
Genetic
algorithm
1
(normalized
original
criteria)
234
4,638
15,944
216.6
8.4
73,923
Salcedo
et
al.
(
2018
)
Pipe/damage
rankings
(×
5+)
1
(weighted
and
normalized
modif
ied
criteria)
270
4,471
14,235
46.0
35.6
66,799
A
v
erage
1,050
4,882
18,102
105.0
149.3
70,132
Note:
T
o
p
three
performance
v
alues
for
each
criterion
are
in
bold,
with
the
best
performance
highlighted
with
bold
italics;
MOEA
=
multiobjecti
v
e
ev
o
lutionary
algorithm;
PSO
=
particle
swarm
optimization;
and
NSGA-II
=
nonsorted
genetic
algorithm.
© ASCE
04020067-8
J. Water Resour. Plann. Manage.
J. Water Resour. Plann. Manage., 2020, 146(8): 04020067
Downloaded from ascelibrary.org by Universidad de los Andes on 03/08/22. Copyright ASCE. For personal use only; all rights reserved.

in case pipe damage or a contaminant intrusion occurred in that
segment. Li et al. (
2018
) used pipe damage statistics of the real
Wenchuan earthquake in 2008 to suggest pipeline renewals to avoid
concrete and gray iron pipes, which seemed to be more vulnerable
to this kind of events, while increasing the pipe burial depths to
reduce pipe displacement. Finally, Bibok (
2018
) suggested running
in advance combinations of simultaneous hydraulic segments iso-
lation to reduce in advance search space and ease the computation
of recommended schedules once the event occurs.
General Observations
After analyzing the results and recommendations of all participants,
the main insights are summarized as follows:
• All six criteria used to evaluate performance of solutions
[Eqs. (
8
)
–(
13
)] were defined as desirable objectives of a re-
sponse and restoration method and as metrics that would con-
tribute to better understand the consequences of extreme seismic
events. However, the fact that only 1 out of 10 teams used a
multiobjective optimization approach using the six criteria
would suggest that it is necessary to prioritize some of them,
with engineering judgment, according to the perspective and
policies of the city in order to make it a mathematically tractable
problem that actually provides suitable solutions.
• Different types of approaches presented in this Battle have all
potential to find satisfactory solutions to the problem. The use of
metaheuristics requires in general more computational effort
and, therefore, are useful to develop, in advance, plans to react
in the moment a disaster occurs. Greedy algorithms are, in gen-
eral, fast enough to be run at the moment a disaster occurs, mak-
ing use of that reaction time mentioned before and adapting to
new information on damages easily. Finally, ranking-based ap-
proaches are straightforward and quick to use, allowing an al-
most immediate reaction and an instantaneous reordering when
given updated information but, unlike optimization-based ap-
proaches, rely on subjective, expert generated list of intervention
options to consider.
• The run times for the participants’ solutions were not reported
because it was not a requirement for the submission (in order to
allow the use of any available resource and technique), but
the computational requirements of metaheuristic algorithms
were mentioned by some participants as a drawback for this
type of approach. As explained by Castro-Gama et al. (
2018
),
the use of alternatives like greedy algorithms can reduce the
0.2x
0.4x
0.8x
1.6x
3.2x
6.4x
Fire &
Hosp.
t_95
Res. Loss
Time
no serv.
Nodes
no serv.
Water
Loss
(a)
0.2x
0.4x
0.8x
1.6x
3.2x
6.4x
Fire &
Hosp.
t_95
Res. Loss
Time
no serv.
Nodes
no serv.
Water
Loss
(b)
0.2x
0.4x
0.8x
1.6x
3.2x
6.4x
Fire &
Hosp.
t_95
Res. Loss
Time
no serv.
Nodes
no serv.
Water
Loss
(c)
0.2x
0.4x
0.8x
1.6x
3.2x
6.4x
Fire &
Hosp.
t_95
Res. Loss
Time
no serv.
Nodes
no serv.
Water
Loss
(d)
0.2x
0.4x
0.8x
1.6x
3.2x
6.4x
Fire &
Hosp.
t_95
Res. Loss
Time
no serv.
Nodes
no serv.
Water
Loss
(e)
0.2x
0.4x
0.8x
1.6x
3.2x
6.4x
Fire &
Hosp.
t_95
Res. Loss
Time
no serv.
Nodes
no serv.
Water
Loss
(f)
0.2x
0.4x
0.8x
1.6x
3.2x
6.4x
Fire &
Hosp.
t_95
Res. Loss
Time
no serv.
Nodes
no serv.
Water
Loss
(g)
0.2x
0.4x
0.8x
1.6x
3.2x
6.4x
Fire &
Hosp.
t_95
Res. Loss
Time
no serv.
Nodes
no serv.
Water
Loss
(h)
0.2x
0.4x
0.8x
1.6x
3.2x
6.4x
Fire &
Hosp.
t_95
Res. Loss
Time
no serv.
Nodes
no serv.
Water
Loss
(i)
0.2x
0.4x
0.8x
1.6x
3.2x
6.4x
Fire &
Hosp.
t_95
Res. Loss
Time
no serv.
Nodes
no serv.
Water
Loss
(j)
Fig. 5. Performance comparison of each team with respect to the average (dotted line). Better performance indicated by larger shaded areas: (a) results
from Castro-Gama et al. (
2018
); (b) results from Sweetapple et al. (
2018
); (c) results from Zhang et al. (
2018
); (d) results from Deuerlein et al. (
2018
);
(e) results from Balut et al. (
2018
); (f) results from Li et al. (
2018
); (g) results from Sophocleous et al. (
2018
); (h) results from Santonastaso et al.
(
2018
); (i) results from Bibok (
2018
); and (j) results from Salcedo et al. (
2018
).
© ASCE
04020067-9
J. Water Resour. Plann. Manage.
J. Water Resour. Plann. Manage., 2020, 146(8): 04020067
Downloaded from ascelibrary.org by Universidad de los Andes on 03/08/22. Copyright ASCE. For personal use only; all rights reserved.
computational time to 30% of the time required by metaheur-
istics. However, the potential use of parallelization is expected
to make the use of this type of optimization algorithms more
suited and faster in future.
• Fig.
6
shows the average Res. loss among all participants versus
the range of diameters of broken pipes in each scenario. It also
shows how, for this particular network, the WDN gets more af-
fected in its functionality by the size of the largest broken pipe,
rather than by the number of breaks in the scenario. For exam-
ple, Scenario 05 has 10 more pipe breaks than Scenario 03, but
because Scenario 03 has a
250-mm pipe broken, it has on aver-
age higher resilience loss than Scenario 05, which has all its
breaks in pipes with diameters under 200 mm.
• One important factor that drives the resilience of the WDN to
these emergency scenarios is the location of isolation valves and
the size of hydraulic segments relative to affected areas. All par-
ticipants agree that having more isolation valves would reduce
the impact of repairs and replacement works in the supply.
• On average, the interruptions in the supply to emergencies
(hospitals and firefighters) was 17.5 h, although considerable
variability was seen among participants and scenarios (in some
scenarios, some participants were able to maintain continuous
water supply to the emergency nodes, whereas in other cases,
the interruption accumulated nearly 72 h). Because most of that
demand occurred in hospitals, this suggests the need to install or
increase their private storage to autonomously cope with their
demand for longer periods of time.
• The functionality time series follows a peaks-and- troughs shape
driven by the highs and lows of diurnal water demand in the
system. Fig.
7
shows an example of a functionality time series
[Scenario 01 by Zhang et al. (
2018
)] as well as the demand time
series. During evenings, the supplied water was more closely
matched to the demands, whereas during mornings and noon-
time, the effects of the damages and the ongoing repair work
were more noticeable. Additionally, water stored in the tanks
offered an initial cushion on the functionality, which allowed full
supply of the demand during the first few hours after the event.
• Regarding the criteria used to evaluate the performance of
each team, a correlation analysis allowed to identify that only
the pair t
95
–Res. loss has a strong positive correlation (0.92),
suggesting that algorithms that minimize one would indirectly
minimize the other. This was difficult to know in advance, but it
would indicate that in an optimization framework, only five ob-
jective functions were necessary to solve the challenge. All
other computed correlations were below 0.55, with negative val-
ues for the four pairs between Nodes no serv. or Water loss, and
t
95
or Res. loss.
• A Pareto ranking of the 10 teams showed that six solutions were
nondominated (
Castro-Gama et al. 2018
;
Zhang et al. 2018
;
Deuerlein et al. 2018
;
Li et al. 2018
;
Bibok 2018
;
Salcedo
et al. 2018
), with Salcedo et al. (
2018
) dominating three of
the four other solutions, followed by Zhang et al. (
2018
) domi-
nating two, and Deuerlein et al. (
2018
) and Castro-Gama et al.
(
2018
) dominating one.
• To evaluate the robustness of the approaches, the standard
deviation across the five scenarios was computed for each cri-
terion and each team. Fig.
8
compares the standard deviations
with the averages (an ideal approach would be closer to the
bottom-left corner indicating good average performance and
low variability in its results). It can be seen that generally, teams
with good performance in a criterion (small average value) also
had a small standard deviation in that criterion, indicating that
their approaches are also robust (with consistently good results
for all five scenarios). Exceptions to this remark are mostly in the
Resilience loss criteria, where Teams 1, 6, and 3 (
Castro-Gama
et al. 2018
;
Li et al. 2018
;
Zhang et al. 2018
), in that order, had
comparatively good average performances, but with high varia-
tion between scenarios.
• The coefficients of variation for the six criteria were computed
(across the 10 teams). The Nodes no serv., Fire & hosp., and
Time no serv. were, in that order, the criteria with highest vari-
ability, which would suggest that these might be criteria more
difficult to attain.
Conclusions
The paper summarizes the competition challenge and the results
of the BPDRR held in Kingston, Ontario, Canada, in July 2018
as part of the first International WDSA/CCWI Joint Conference.
Participants in the BPDRR were tasked with identifying the
best strategies to respond and restore water service following five
hypothetical earthquake scenarios. A total of 10 teams developed
approaches that fell into three broad categories of metaheuristic
methods, ranking-based prioritization methods, and near-optimal
optimization methods. Six performance criteria were used to
evaluate the solutions of the 10 teams: (1) time without supply for
75%
80%
85%
90%
95%
100%
105%
0
24
48
72
96
120
144
168
Functionality
Time (hr)
0
500
1,000
1,500
2,000
Demand (L/s)
Demand
Firefight demand
Fig. 7. Functionality time series for scenario 01 by Zhang et al. (
2018
).
5000
10000
15000
20000
25000
30000
35000
0
100
200
300
400
500
600
A
v
erage
R
es
. L
o
ss
(
%
*
m
in
)
Broken pipes diameter (mm)
No. of breaks
30
25
20
Scenario 01
Scenario 04
Scenario 03
Scenario 05
Scenario 02
Fig. 6. Average resilience loss versus pipe breaks range per damage
scenario.
© ASCE
04020067-10
J. Water Resour. Plann. Manage.
J. Water Resour. Plann. Manage., 2020, 146(8): 04020067
Downloaded from ascelibrary.org by Universidad de los Andes on 03/08/22. Copyright ASCE. For personal use only; all rights reserved.
hospital/firefighting, (2) rapidity of recovery, (3) resilience loss,
(4) average time of no user service, (5) number of users without
service for eight consecutive hours, and (6) water loss.
The key findings from the Battle are summarized as follows:
• Even though the six performance measures taken together were
used to characterize the appropriateness of the response and re-
storation solutions, the positive correlation found between some
of the criteria suggests that in an optimization framework, it
might not be necessary to include all of them.
• All three categories of approaches proved to be appropriate to find
satisfactory response and restoration solutions despite important
differences in computational requirements among approaches.
Metaheuristics, on one hand, seem to be suitable to develop plans
beforehand the occurrence of the event because their computa-
tional cost limits their application during reaction times. Greedy
algorithms, on the other hand, are faster to compute and can
also adapt easily to new available information, making them
more applicable in the case of an emergency. Finally, ranking-
based approaches condense expert knowledge and intuitive cri-
teria to suggest swiftly the recommended interventions to follow.
• The location of isolation valves and the size of hydraulic seg-
ments relative to areas affected was found to drive the opera-
tional resilience of the system. This highlights the importance
of having an adequate location and mapping of isolation valves,
as well as a regular maintenance to keep them operational in
disaster scenarios.
• The average period of interruption to water supply for hospitals
and firefighting flows was 17.5 h and varied considerably across
participants and emergency scenarios. This highlights the impor-
tance of private water storage for emergency response entities.
• Tank storage helped to preserve functionality in the network but
only in the first few hours after an emergency event. This may be
specific for the system analyzed, i.e., other WDNs may be able
to provide water for longer periods of time.
One important point to mention is that extending the results and
conclusions of this Battle to practice requires that the list of as-
sumptions remains valid in the specific systems. This implies that
utilities need to have updated models of their networks, with good
mapping of their isolation valves, and with trained crews that can
perform the required tasks in periods close to the assumed. More-
over, they need to keep sufficient resources and parts to fix the dam-
ages and communicate efficiently with their crews. Only then
should a risk assessment and evaluation of alternatives based on
the methods presented in this competition be performed.
Future Research
Areas for further consideration are identified as follows:
• One aspect that was not explored further was the demand varia-
tion that can occur after an earthquake. Depending on the mag-
nitude of the event, commercial and industrial demands can be
affected because some businesses would close temporarily
while normal conditions are re-established.
• Similarly to the previous point, other important simplification
for the problem was not to consider damages to other network
elements (e.g., pumps or tanks). Power grids energizing the
pumping stations and generators may also be damaged during
an earthquake. Communication networks that might be used for
monitoring and control operations can also be affected in such
scenarios. The effect of this type of damages, as well as their
probability of occurrence and the times to fix them, are worth
further investigation.
• The relationship between demand and functionality (Fig.
7
) sug-
gests that there can be better and worst times to fix damages,
especially breaks that require isolation, and therefore might
be good to explore idle times for crews where they do not fix
anything and wait until a low demand time, as noted by Bibok
(
2018
).
i
ii
iii
iv
v
vi
vii
viii
ix
x
0
1000
2000
3000
4000
0
500
1000
1500
A
v
erage (m
in
)
Standard Deviation (min)
Fire & Hosp.
i
ii
iii
iv
v
vi
vii
viii
ix x
0
2000
4000
6000
8000
10000
0
1000
2000
3000
A
v
erage (m
in
)
Standard Deviation (min)
t
95
i
ii
iii
iv
v
vi
vii
viii
ix
x
0
10000
20000
30000
40000
50000
0
5000
10000
A
v
erage (%*
m
in)
Standard Deviation (%*min)
Res. Loss
i
ii
iii
iv
v
vi
vii
viii
ix
x
0
100
200
300
400
0
100
200
300
A
v
erage (m
in
)
Standard Deviation (min)
Time no serv.
i
ii
iii
iv
v
vi
vii
viii
ix
x
0
200
400
600
800
1000
0
200
400
A
v
erage (n
o
d
es)
Standard Deviation (nodes)
Nodes no serv.
i
ii
iii
iv
v
vi
vii
viii
ix
x
0
20000
40000
60000
80000
100000
0
10000
20000
30000
A
v
erage (M
L
)
Standard Deviation (ML)
Water loss
i. Castro-Gama et al. (2018) ii. Sweetapple et al. (2018) iii. Zhang et al. (2018) iv. Deuerlein et al. (2018) v. Balut et al. (2018)
vi. Li et al. (2018) vii. Sophocleous et al. (2018) viii. Santonastaso et al. (2018) ix. Bibok (2018) x. Salcedo et al. (2018).
Fig. 8. Average and standard deviation per criteria per team.
© ASCE
04020067-11
J. Water Resour. Plann. Manage.
J. Water Resour. Plann. Manage., 2020, 146(8): 04020067
Downloaded from ascelibrary.org by Universidad de los Andes on 03/08/22. Copyright ASCE. For personal use only; all rights reserved.

• The impact of catastrophic events such as an earthquake may
have a more profound impact on the water quality, which needs
to be explored further. If this is the case, then partial water sup-
ply during the restoration may be of use for specific water uses
only (e.g., toilet flushing), and additional measures may have to
be considered (e.g., supply of bottled water).
• Usually, important earthquakes produce collapse of buildings
and roads, making some streets unfit due to rubbles. These as-
pects affect mobility and possibility of working of the crews
activated for repairing water pipes. These aspects were not con-
sidered in the current Battle but might have a significant impact
on actual restoring and repairing actions.
• The simplification of transportation times in Table
1
can not ap-
ply in many real cases, especially large cities, because fixing two
close damages can be less time consuming than fixing two very
separate damages. Future studies could attempt to discard this
simplification.
• Other practical assumptions made in the competition included the
full availability of spare parts and resources to conduct the inter-
ventions to all damages. However, this might not be the case in
many cities, and therefore, the impact of limited/unavailable re-
sources on the problem could be explored in future.
• Smart water technologies, such as pressure sensors, hydro-
phones, and flow meters (
Hill et al. 2014
), provide a large
amount of information on the state of a WDN. Going forward,
it would be interesting to understand how these data could aid
water utilities in the design of response solutions to earthquakes
as well as other catastrophic events.
• Recent Battles have focussed on various events that strongly
threaten the performance of a WDN, such as contamination
events (
Ostfeld et al. 2008
), cyber-physical attacks (
Taormina
et al. 2018
), or earthquakes (BPDRR). Although these Battles
provide enhanced understanding on the performance of engi-
neering solutions to specific events, there seems to be a lack
of knowledge on how these solutions should be merged and
implemented into joint contingency plans.
• Due to organizational limitations, this Battle used a disclosed/
open set of five scenarios used by the participant teams to de-
velop, adjust, and evaluate their approaches, instead of a bigger,
concealed set of predefined scenarios to be tested after the sub-
mission of their methods/algorithms. This implies that some
methodologies might not have been oriented to a generic solu-
tion of the problem, but to the specific solution of these five
scenarios. Future research in the topic could benefit from using
training scenarios to feedback and adjust the approaches, and
test scenarios to evaluate the approaches
’ actual performance.
Data Availability Statement
Some or all data, models, or code generated or used during
the study, including the EPANET models and the results for each
team, are available from the corresponding author by request.
Additionally, requests regarding code used by the participants to
solve the problem will be directed by the corresponding author
to the developers of the code. The supplemental files of this manu-
script can be found with the problem description (
Paez et al. 2018a
)
in the website:
https://www.queensu.ca/wdsa-ccwi2018/problem
-description-and-files
.
References
American Lifelines Alliance. 2001. Seismic fragility formulations for water
systems: Guideline. Washington, DC: American Lifelines Alliance.
Ballantyne, D. B., E. Berg, J. Kennedy, R. Reneau, and D. Wu. 1990.
Earthquake loss estimation modeling of the Seattle water system. Tech.
Rep. Federal Way, WA: USGS.
Balut, A., R. Brodziak, J. Bylka, and P. Zakrzewski. 2018.
“Battle of post-
disaster response and restauration (BPDRR).
” In Proc., 1st Int. WDSA/
CCWI 2018 Joint Conf., 14. Kingston, Canada: Open Journal Systems.
Bibok, A. 2018.
“Near-optimal restoration scheduling of damaged drinking
water distribution systems using machine learning.
” In Proc., 1st Int.
WDSA/CCWI 2018 Joint Conf., 14. Kingston, Canada: Open Journal
Systems.
Bonneau, A. L., and T. D. O
’Rourke. 2009. Vol. 234 of Water supply
performance during earthquakes and extreme events. Buffalo, NY:
Multidisciplinary Center for Earthquake Engineering Research.
Castro-Gama, M. 2017. Visual analytics for multi-objective optimization
solutions (VAMOS): A MATLAB open library. Genève: ZENODO.
Castro-Gama, M., C. Quintiliani, and S. Santopietro. 2018.
“After earth-
quake post-disaster response using a many-objective approach, a greedy
and engineering interventions.
” In Proc., 1st Int. WDSA/CCWI 2018
Joint Conf., 14. Kingston, Canada: Open Journal Systems.
Cimellaro, G. P., A. Tinebra, C. Renschler, and M. Fragiadakis. 2015.
“New resilience index for urban water distribution networks.” J. Struct.
Eng. 142 (8): C4015014.
https://doi.org/10.1061/(ASCE)ST.1943
-541X.0001433
.
Cover, T. M., and P. E. Hart. 1967.
“Nearest neighbour pattern classifica-
tion.
” IEEE Trans. Inf. Theory 13 (1): 21–27.
https://doi.org/10.1109
/TIT.1967.1053964
.
Creaco, E., M. Franchini, and S. Alvisi. 2010.
“Optimal placement of iso-
lation valves in water distribution systems based on valve cost and
weighted average demand shortfall.
” Water Resour. Manage. 24 (15):
4317
–4338.
https://doi.org/10.1007/s11269-010-9661-5
.
Deb, K., M. Mohan, and S. Mishra. 2005.
“Evaluating the ε-domination
based multi-objective evolutionary algorithm for a quick computation
of Pareto-optimal solutions.
” Evol. Comput. 13 (4): 501–525.
https://doi
.org/10.1162/106365605774666895
.
Deuerlein, J., D. Gilbert, E. Abraham, and O. Piller. 2018.
“A greedy sched-
uling of post-disaster response and restoration using pressure-driven
models and graph segment analysis.
” In Proc., 1st Int. WDSA/CCWI
2018 Joint Conf., 14. Kingston, Canada: Open Journal Systems.
Deuerlein, J. W. 2008.
“Decomposition model of a general water supply
network graph.
” J. Hydraul. Eng. 134 (6): 822–832.
https://doi.org/10
.1061/(ASCE)0733-9429(2008)134:6(822)
.
Di Nardo, A., M. Di Natale, C. Giudicianni, G. F. Santonastaso, and D.
Savic. 2017.
“Simplified approach to water distribution system manage-
ment via identification of a primary network.
” J. Water Resour. Plann.
Manage. 144 (2): 04017089.
https://doi.org/10.1061/(ASCE)WR.1943
-5452.0000885
.
Eliades, D. G., M. Kyriakou, S. Vrachimis, and M. M. Polycarpou.
2016.
“EPANET-MATLAB toolkit: An open-source software for inter-
facing EPANET with MATLAB.
” In Proc. 14th Int. Conf. on Comput-
ing and Control for the Water Industry (CCWI), 8. The Hague, The
Netherlands: International Water Conferences.
https://doi.org/10.5281
/zenodo.831493
.
Fragiadakis, M., S. E. Christodoulou, and D. Vamvatsikos. 2013.
“Reliabil-
ity assessment of urban water distribution networks under seismic
loads.
” Water Resour. Manage. 27 (10): 3739–3764.
https://doi.org/10
.1007/s11269-013-0378-0
.
Gilbert, D., E. Abraham, I. Montalvo, and O. Piller. 2017.
“Iterative multi-
stage method for a large water network sectorization into DMAs under
multiple design objectives.
” J. Water Resour. Plann. Manage. 143 (11):
04017067.
https://doi.org/10.1061/(ASCE)WR.1943-5452.0000835
.
Hill, D., B. Kerkez, A. Rasekh, A. Ostfeld, B. Minsker, and M. K. Banks.
2014.
“Sensing and cyberinfrastructure for smarter water management:
The promise and challenge of ubiquity.
” J. Water Resour. Plann.
Manage. 140 (7): 01814002.
https://doi.org/10.1061/(ASCE)WR.1943
-5452.0000449
.
Hwang, H. H., H. Lin, and M. Shinozuka. 1998.
“Seismic performance
assessment of water delivery systems.
” J. Infrastruct. Syst. 4 (3):
118
–125.
https://doi.org/10.1061/(ASCE)1076-0342(1998)4:3(118)
.
Li, Y., J. Gao, C. Jian, C. Ou, and S. Hu. 2018.
“A two-stage post-disaster
response and restoration method for the water distribution system.
”
© ASCE
04020067-12
J. Water Resour. Plann. Manage.
J. Water Resour. Plann. Manage., 2020, 146(8): 04020067
Downloaded from ascelibrary.org by Universidad de los Andes on 03/08/22. Copyright ASCE. For personal use only; all rights reserved.

In Proc., 1st Int. WDSA/CCWI 2018 Joint Conf., 14. Kingston, Canada:
Open Journal Systems.
Liu, W., Y. Zhao, and J. Li. 2015.
“Seismic functional reliability analysis of
water distribution networks.
” Struct. Infrastruct. Eng. 11 (3): 363–375.
https://doi.org/10.1080/15732479.2014.887121
.
Luong, H. T., and N. N. Nagarur. 2005.
“Optimal maintenance policy and
fund allocation in water distribution networks.
” J. Water Resour. Plann.
Manage. 131 (4): 299
–306.
https://doi.org/10.1061/(ASCE)0733-9496
(2005)131:4(299)
.
MacQueen, J. B. 1967.
“Some methods for classification and analysis of
multivariate observations.
” In Vol. 1 of Proc., 5th Berkeley Symp. on
Mathematical Statistics and Probability, 281
–297. Berkeley: University
of California Press.
Mahmoud, H., Z. Kapelan, and D. Savic. 2018.
“Real-time operational re-
sponse methodology for reducing failure impacts in water distribution
systems.
” J. Water Resour. Plann. Manage. 144 (7): 04018029.
https://
doi.org/10.1061/(ASCE)WR.1943-5452.0000956
.
Meng, F., G. Fu, R. Farmani, C. Sweetapple, and D. Butler. 2018.
“Topo-
logical attributes of network resilience: A study in water distribution
systems.
” Water Res. 143 (Oct): 376–386.
https://doi.org/10.1016/j
.watres.2018.06.048
.
NIBS (National Institute of Building Sciences). 1997. Earthquake loss es-
timation methodology HAZUS 97: Technical manual. Washington DC:
FEMA.
Ostfeld, A., et al. 2008.
“The battle of the water sensor networks (BWSN):
A design challenge for engineers and algorithms.
” J. Water Resour.
Plann. Manage. 134 (6): 556
–568.
https://doi.org/10.1061/(ASCE)
0733-9496(2008)134:6(556)
.
Paez, D., Y. Filion, and M. Hulley. 2018a.
“Battle of post-disaster response
and restoration (BPDRR)
—Problem description and rules.” Accessed
June
14,
2019.
https://www.queensu.ca/wdsa-ccwi2018/problem
-description-and-files
.
Paez, D., C. R. Suribabu, and Y. Filion. 2018b.
“Method for extended
period simulation of water distribution networks with pressure driven
demands.
” Water Resour. Manage. 32 (8): 2837–2846.
https://doi.org
/10.1007/s11269-018-1961-1
.
PAHO (Pan American Health Organization). 1998. Natural disaster miti-
gation in drinking water and sewerage systems. Washington, DC:
PAHO.
Porter, K. A. 2016. Damage and restoration of water supply systems in an
earthquake sequence. Boulder, CO: Structural Engineering and Struc-
tural Mechanics Program, Univ. of Colorado, Boulder.
Salcedo, C., A. Aguilar, P. Cuero, S. Gonzalez, S. Mu
˜noz, J. Pérez, A.
Posada, J. Robles, and K. Vargas. 2018.
“Determination of the hydraulic
restoration capacity of b-city involving a multi-criteria decision support
model.
” In Proc., 1st Int. WDSA/CCWI 2018 Joint Conf., 14. Kingston,
Canada: Open Journal Systems.
Santonastaso, G. F., E. Creaco, A. Di Nardo, and M. Di Natale. 2018.
“Post-disaster response and restauration of B-town network based on
primary network.
” In Vol. 1 of Proc., 1st Int. WDSA/CCWI 2018 Joint
Conf. Kingston, Canada: Open Journal Systems.
Shi, P., and T. D. O
’Rourke. 2006. Seismic response modeling of water
supply systems. Technical Rep. No. MCEER-08-0016. Buffalo, NY:
Univ. at Buffalo.
Sophocleous, S., E. Nikoloudi, H. A. Mahmoud, K. Woodward, and M.
Romano. 2018.
“Simulation-based framework for the restoration of
earthquake-damaged water distribution networks using a genetic algo-
rithm.
” In Proc., 1st Int. WDSA/CCWI 2018 Joint Conf., 14. Kingston,
Canada: Open Journal Systems.
Sweetapple, C., F. Meng, R. Farmani, G. Fu, and D. Butler. 2018.
“A heu-
ristic approach to water network post-disaster response and restoration.
”
In Proc., 1st Int. WDSA/CCWI 2018 Joint Conf., 14. Kingston, Canada:
Open Journal Systems.
Tabucchi, T., R. Davidson, and S. Brink. 2010.
“Simulation of post-
earthquake water supply system restoration.
” Civ. Eng. Environ. Syst.
27 (4): 263
–279.
https://doi.org/10.1080/10286600902862615
.
Taormina, R., et al. 2018.
“The battle of the attack detection algorithms:
Disclosing cyber attacks on water distribution networks.
” J. Water
Resour. Plann. Manage. 144 (8): 04018048.
https://doi.org/10.1061
/(ASCE)WR.1943-5452.0000969
.
Walski, T. M. 1993.
“Water distribution valve topology for reliability
analysis.
” Reliab. Eng. Syst. Saf. 42 (1): 21–27.
https://doi.org/10
.1016/0951-8320(93)90051-Y
.
Wang, Y., S. K. Au, and Q. Fu. 2010.
“Seismic risk assessment and mit-
igation of water supply systems.
” Earthquake Spectra 26 (1): 257–274.
https://doi.org/10.1193/1.3276900
.
Wang, Y., and T. D. O
’Rourke. 2006. Seismic performance evaluation
of water supply systems. Buffalo, NY: Multidisciplinary Center for
Earthquake Engineering Research.
Yoo, D. G., D. Kang, and J. H. Kim. 2016.
“Optimal design of water supply
networks for enhancing seismic reliability.
” Reliab. Eng. Syst. Saf.
146 (Feb): 79
–88.
https://doi.org/10.1016/j.ress.2015.10.001
.
Zhang, Q., F. Zheng, K. Diao, B. Ulanicki, and Y. Huang. 2018.
“Solving
the battle of post-disaster response and restauration (BPDRR) problem
with the aid of multi-phase optimization framework.
” In Proc., 1st Int.
WDSA/CCWI 2018 Joint Conf., 14. Kingston, Canada: Open Journal
Systems.
© ASCE
04020067-13
J. Water Resour. Plann. Manage.
J. Water Resour. Plann. Manage., 2020, 146(8): 04020067
Downloaded from ascelibrary.org by Universidad de los Andes on 03/08/22. Copyright ASCE. For personal use only; all rights reserved.
