
Non-deposition self-cleansing models for large sewer
pipes
Carlos Montes, Sergio Vanegas, Zoran Kapelan, Luigi Berardi
and Juan Saldarriaga
ABSTRACT
Multiple models from the literature and experimental datasets have been developed and collected to
predict sediment transport in sewers. However, all these models were developed for smaller sewer
pipes, i.e. using experimental data collected on pipes with diameters smaller than 500 mm. To
address this issue, new experimental data were collected on a larger, 595 mm pipe located in a
laboratory at the University of los Andes. Two new self-cleansing models were developed using this
dataset. Both models predict the sewer self-cleansing velocity for the cases of non-deposition with
and without deposited bed. The newly developed and existing models were then evaluated and
compared on the basis of the most recently collected and previously published datasets. Models
were compared in terms of prediction accuracy measured by the root mean squared error and mean
absolute percentage error. The results obtained show that in the existing literature, self-cleansing
models tend to be over
fitted, i.e. have a rather high prediction accuracy when applied to the data
collected by the authors, but this accuracy deteriorates quickly when applied to the datasets
collected by other authors. The newly developed models can be used for designing both small and
large sewer pipes with and without deposited bed condition.
Carlos Montes (corresponding author)
Department of Civil and Environmental
Engineering,
Universidad de los Andes,
Bogotá,
Colombia
E-mail: cd.montes1256@uniandes.edu.co
Sergio Vanegas
Department of Civil and Environmental
Engineering,
Universidad de los Andes,
Bogotá,
Colombia
Zoran Kapelan
Department of Water Management,
Delft University of Technology,
Delft,
The Netherlands
Luigi Berardi
Dipartimento di Ingegneria e Geologia,
Università degli Studi Gabriele d
’Annunzio Chieti e
Pescara,
Pescara,
Italy
Juan Saldarriaga
Department of Civil and Environmental
Engineering,
Universidad de los Andes,
Bogotá,
Colombia
Key words
|
bedload, deposited bed, non-deposition, sediment transport, self-cleansing
INTRODUCTION
Understanding sediment transport is important for design-
ing self-cleansing sewer systems. Sewer deposits are the
source of several problems, such as the reduction of
hydraulic capacity, blockage and premature over
flows
(
Shirazi et al.
;
Ebtehaj et al.
;
Torres et al.
;
Kargar et al.
;
Montes et al.
;
Safari
). Tradition-
ally, conventional minimum velocities and shear stress
values have been suggested to de
fine self-cleansing con-
ditions, both in academic literature (
Yao
;
Ackers
et al.
) and industry design manuals (
British Standard
Institution
;
Great Lakes
). Several authors (
Yao
;
Nalluri & Ab Ghani
) have shown that the use
of these traditional criteria and conventional values is
likely to lead to overdesigning the slope for small diameter
pipes (i.e. pipes with diameter D smaller than 500 mm).
To address this issue, laboratory investigations have been
carried out (e.g.
May et al.
;
Ab Ghani
;
Vongvisessomjai et al.
;
Safari et al.
a
;
Alihosseini
& Thamsen
). These studies focused on estimating the
self-cleansing conditions and developing corresponding
predictive models in which the minimum self-cleansing
velocity (V
l
) is a function of several input variables,
such as the mean particle diameter (d), the hydraulic
radius (R), the speci
fic gravity of sediments (SG), the dimen-
sionless grain size (D
gr
) or the volumetric sediment
concentration (C
v
).
According to
Safari et al. (
)
, the above and similar
experimental works have studied two self-cleansing design
606
© IWA Publishing 2020
Water Science & Technology
|
81.3
|
2020
doi: 10.2166/wst.2020.154
Downloaded from http://iwaponline.com/wst/article-pdf/81/3/606/767607/wst081030606.pdf
by guest
on 08 March 2022

criteria: (i) criteria for bed sediment motion and (ii) criteria
for sediment non-deposition in sewer pipes. Both criteria are
useful for predicting the self-cleansing conditions. In this
paper, the non-deposition design criterion is studied using
an experimental approach.
Traditionally, non-deposition self-cleansing design cri-
teria
have
been
classi
fied in two general groups
(
Vongvisessomjai et al.
;
Safari et al.
): (i) non-depo-
sition without deposited bed and (ii) non-deposition with
deposited bed of sediments.
The
first group, non-deposition without deposited bed, is
a conservative and frequently used criterion for designing
self-cleansing sewer systems. In this context,
Robinson &
Graf (
)
de
fined critical mean velocity (or minimum
self-cleansing velocity, as presented in this study) as the con-
dition in which particles begin deposition and form a
stationary deposit at the bottom of the sewer pipe, i.e. the
particles do not form a permanent deposit.
Several studies have been carried out in this
field, in
which models are proposed for the prediction of a minimum
self-cleansing velocity that guarantees the non-deposition of
particles in sewer pipes. In this context,
Mayerle (
)
ana-
lysed the sediment transport in a 152 mm diameter pipe
using uniform sand ranging from 0.50 mm to 8.74 mm,
and sediment concentration between 20 and 1,275 ppm.
May et al. (
)
analysed sediment transport in a 300 mm
diameter concrete pipe using non-cohesive material with a
mean particle diameter of 0.72 mm.
May (
)
used a
450 mm diameter concrete pipe to study the transport of
sands with a mean particle diameter of 0.73 mm.
Ab
Ghani (
)
studied the non-deposition sediment transport
without deposited bed in three sewer pipes of 154 mm,
305 mm and 450 mm, varying the particle diameter from
0.46 mm to 8.3 mm.
Ota (
)
carried out experiments in
a 305 mm sewer pipe varying the particle diameter from
0.714 mm to 5.612 mm.
Vongvisessomjai et al. (
)
devel-
oped two models for bedload transport and two models for
suspended load transport using data collected in two pipes
of 100 mm and 150 mm diameter.
Safari et al. (
a
) con-
ducted experiments in a trapezoidal channel and proposed
an equation which includes the cross-section shape factor
(
β). Recently,
Montes et al. (
)
collected experimental
data from
Ab Ghani (
)
and using an evolutionary
polynomial regression multi-objective genetic algorithm
(EPR-MOGA) developed new self-cleansing models.
The above studies resulted in a series of predictive
models for the estimation of self-cleansing velocity but
none of them analysed self-cleansing velocity in the context
of larger sewer pipes. As a result, all non-deposition
self-cleansing models are only useful for designing small
sewer pipes (D
< 500 mm).
Usually, the equations reported in the literature for
non-deposition without deposited bed criterion are in the
form of:
V
l
ffiffiffiffiffiffiffiffiffiffiffiffiffiffiffiffiffiffiffiffiffiffiffiffi
gd
(SG
1)
p
¼ aC
b
v
d
R
or
d
D
c
1
D
c
2
gr
λ
c
3
(1)
where g the gravitational acceleration;
λ the Darcy’s friction
factor; D
gr
the dimensionless grain size
¼ d
SG
1
ν
2
1
3
!
;
SG
the speci
fic gravity of sediments; ν the kinematic vis-
cosity of water; D the pipe diameter; and a, b, c
1
, c
2
, c
3
are coef
ficients, which vary with each study. For example,
in the
Ab Ghani (
)
model, a
¼ 3.08, b ¼ 0.21, c
1
¼ 0.53,
c
2
¼ 0.09 and c
3
¼ 0.21:
V
l
ffiffiffiffiffiffiffiffiffiffiffiffiffiffiffiffiffiffiffiffiffiffiffiffi
gd
(SG
1)
p
¼ 3:08C
0
:21
v
d
R
0:53
D
0:09
gr
λ
0:21
(2)
The second group, non-deposition with deposited bed, is
a less conservative criterion used for the design of large self-
cleansing sewer systems (D
> 500 mm) (
Safari et al.
). In
this criterion, a small permanent sediment bed is allowed at
the bottom of the pipe. Several investigations (
May et al.
;
El-Zaemey
;
Ab Ghani
;
Butler et al.
)
have found that a permanent sediment bed, with mean pro-
portional sediment depth (y
s
=D) close to 1.0%, increases the
sediment transport capacity. However, strong supervision of
the systems is required because it is close to critical con-
dition (
Vongvisessomjai et al.
).
Based on the aforementioned, several studies have been
carried out for describing this phenomenon using predictive
numerical models based on experimental data. Experiments
by
El-Zaemey (
)
were carried out in a 305 mm diameter
pipe using bed sediment thicknesses of 47 mm, 77 mm and
120 mm, and granular sediments ranging from 0.53 mm to
8.4 mm in size.
Perrusquía (
)
studied the sediment trans-
port in a 225 mm diameter concrete pipe using uniform-
sized sands of 0.9 mm and 2.5 mm.
May (
)
conducted
experiments in a 450 mm diameter pipe using two uniform
sands with a mean particle diameter of 0.73 mm and
0.47 mm.
Ab Ghani (
)
used a 450 mm diameter pipe
varying the deposited bed width (W
b
) from 47 mm to
384 mm.
Nalluri et al. (
)
used the data collected from
El-Zaemey (
)
and modi
fied the
May et al. (
)
model
to predict self-cleansing conditions in deposited bed
607
C. Montes et al.
|
Non-deposition self-cleansing models for large sewer pipes
Water Science & Technology
|
81.3
|
2020
Downloaded from http://iwaponline.com/wst/article-pdf/81/3/606/767607/wst081030606.pdf
by guest
on 08 March 2022
sewers.
Safari et al. (
b)
used the particle swarm optimiz-
ation (PSO) algorithm to improve the
May (
)
model;
good results were obtained with this new model. Recently,
Safari & Shirzad (
)
de
fined an optimum deposited bed
thickness, and proposed a new self-cleansing model for
sewers with deposited bed.
Models found in the literature to predict the non-depo-
sition bedload transport with deposited bed are in terms of
the deposited bed width or the mean proportional sediment
bed. As an example, a model was outlined by
El-Zaemey
(
)
in the following form, where Y is the water level and
W
b
the deposited bed width:
V
l
ffiffiffiffiffiffiffiffiffiffiffiffiffiffiffiffiffiffiffiffiffiffiffiffi
gd
(SG
1)
p
¼ 1:95C
0
:17
v
W
b
Y
0:40
d
D
0:57
λ
0
:10
(3)
As can be seen from the aforementioned, several
authors have studied the sediment transport modes to
develop new self-cleansing criteria. Each author has devel-
oped predictive models which are useful for designing new
sewer infrastructure. However, various limitations have
been identi
fied in the use of self-cleansing models. For
example,
Safari et al. (
)
pointed out that non-deposition
without deposited bed is useful only in small sewers; for
large pipe diameters, the non-deposition with deposited
bed criterion must be applied. However, models developed
for deposited bed conditions present poor accuracy when
different datasets are used (
Nalluri et al.
). Recently,
Safari et al. (
)
highlighted the poor performance of the
equations found in this criterion and recommend further
experimental research in this
field. In addition,
Perrusquía
(
)
suggested further experimental work, especially in
large sewer pipe diameters (i.e. pipe diameter large than
500 mm).
In this study, new self-cleansing models for non-
deposition without deposited bed and deposited bed were
developed. A 595 mm diameter PVC was used to collect
experimental data. The aim was to improve sediment trans-
port prediction in large sewer pipes, based on a new
experimental dataset.
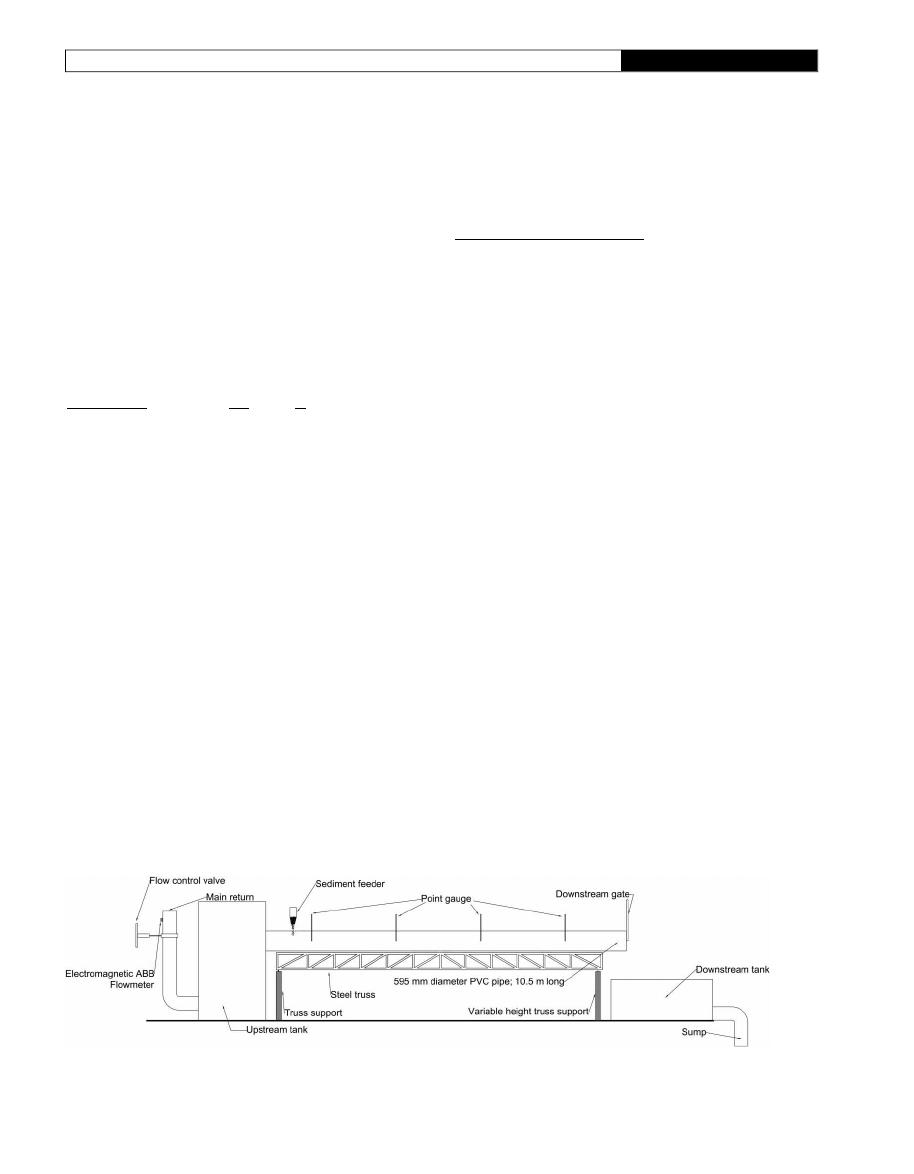
EXPERIMENTAL METHODS
Experimental data were collected on a 595 mm diameter
and 10.5 m long PVC pipe, located in the Hydraulics
Laboratory of the University of los Andes, Colombia. This
pipe was supported on a variable steel truss, allowing pipe
slopes between 0.042% and 3.44%. The pipe was directly
connected to a 30 m
3
upstream tank which was supplied
through a 40 HP pump. The
flow rate was controlled
using a manually operated valve, allowing it to vary from
0.6 L s
1
to 67.3 L s
1
. The pipe had four-point gauges to
measure the water depth along the entire length of the
flume. A sediment feeder was used to supply granular
material with a mean particle diameter ranging from
0.35 mm to 2.60 mm to the PVC pipe. The speci
fic gravity
of sediments varied from 2.64 to 2.67, which was calculated
using the pycnometer method, according to ASTM D854-10
(
ASTM D
-
).
Figure 1
shows the general scheme of
the experimental setup.
The experiments were carried out under uniform
flow
conditions, i.e. no variations in
flowrate and water depth,
for both non-deposition criteria. The data collection strat-
egies were similar for both cases; however, the main
difference related to the sediment supply to the PVC pipe,
which depended on the criterion to be studied. In this con-
text, for the non-deposition without deposited bed criterion,
the sediment feeder supplied the material until the particles
barely moved with the water and did not form a permanent
deposit at the bottom of the pipe. In contrast, for non-depo-
sition with deposited bed, sediment was supplied to form a
deposited loose bed along the entire length of the
flume.
Figure 1
|
Schematic diagram of the experimental setup.
608
C. Montes et al.
|
Non-deposition self-cleansing models for large sewer pipes
Water Science & Technology
|
81.3
|
2020
Downloaded from http://iwaponline.com/wst/article-pdf/81/3/606/767607/wst081030606.pdf
by guest
on 08 March 2022

This methodology followed the guidelines of several pre-
vious experimental works carried out by different authors
(e.g.
Novak & Nalluri
;
Ota
;
Perrusquía
;
Ab
Ghani
;
Vongvisessomjai et al.
;
Safari et al.
a
;
Alihosseini & Thamsen
). The methodology used to col-
lect the data in both cases is described below.
Non-deposition without deposited bed
The
first case considered in this paper is the non-depo-
sition without deposited bed condition. The collection of
experimental data was as follows. Firstly, the pipe slope
was mechanically adjusted and the value was measured
using a dumpy level. Secondly, the
flow control valve
was opened and a constant
flow of water was supplied
to the pipe. The
flowrate was measured with a real-time
electromagnetic
flowmeter which was connected directly
to the pipe feeding the upstream tank. Thirdly, the water
levels were measured using the four-point gauges. The
downstream tailgate was adjusted until the water depth
varied less than
±2 mm between the four-point gauges,
which is the condition in which uniform
flow conditions
could be assumed (
Ab Ghani
). Using the values
recorded of
flowrate and water level, the mean velocity
was computed. Fourthly, when uniform
flow conditions
were achieved, the sediment was supplied to the pipe.
The sediment feeder was slowly opened until the non-
deposition condition was obtained. This condition, also
known as
‘flume traction’, (i.e. no separated dunes present
and no deposition of stationary material at the bottom of
the pipe) was checked by visual inspection. Finally, the
sediment supply rate (
€
m
) was estimated by weighing
the amount of material that passed in a given time at
the outlet of the sediment feeder. The sediment discharge
was estimated as Q
s
¼ €
m
=ρ
s
, where
ρ
s
is the particle den-
sity. The calculated sediment discharge was used to
compute
the
volumetric
sediment
concentration
(C
v
¼ Q
s
=Q).
The experimental procedure above was repeated for sev-
eral
flowrates, pipe slopes and sediment sizes. A total of 107
data for the non-deposition without deposited bed condition
were collected using above experimental approach, as
shown in
Table 1
.
Non-deposition with deposited bed
The methodology used to collect the experimental data for
the non-deposition with deposited bed case was similar
Table 1
|
Non-deposition without deposited bed experimental data collected in the
595 mm PVC pipe
Run no.
d
SG
C
v
R
S
o
V
l
(mm)
(
)
(ppm)
(mm)
(%)
(m/s)
1
1.51
2.66
10,119
9.88
1.78
0.61
2
1.51
2.66
11,609
7.27
1.78
0.51
3
1.51
2.66
3,940
11.83
1.57
0.67
4
1.51
2.66
3,803
14.41
1.57
0.84
5
1.51
2.66
3,892
18.89
1.22
1.02
6
1.51
2.66
3,681
14.41
0.96
0.77
7
1.51
2.66
19,957
7.92
3.43
0.63
8
1.51
2.66
14,854
9.23
3.43
0.77
9
1.51
2.66
16,731
10.53
3.43
0.97
10
1.51
2.66
13,608
12.48
2.74
0.75
11
1.51
2.66
13,841
10.53
2.74
0.75
12
0.35
2.65
8,720
9.88
2.70
0.80
13
0.35
2.65
6,431
10.53
1.43
0.73
14
0.35
2.65
588
14.41
0.25
0.45
15
0.35
2.65
736
16.98
0.25
0.56
16
0.35
2.65
700
20.16
0.25
0.62
17
0.35
2.65
726
23.32
0.68
0.71
18
0.35
2.65
1,227
25.82
0.68
0.77
19
0.35
2.65
2,499
19.53
1.23
0.85
20
0.35
2.65
2,280
20.79
0.89
0.93
21
0.35
2.65
1,909
27.38
0.89
0.93
22
0.35
2.65
4,155
14.41
1.36
0.71
23
0.35
2.65
3,279
18.89
1.36
0.84
24
0.35
2.65
2,498
22.06
1.36
0.97
25
0.35
2.65
2,051
25.51
1.36
1.02
26
0.47
2.66
4,012
13.77
1.36
0.74
27
0.47
2.66
2,804
18.89
1.36
0.88
28
0.47
2.66
3,153
22.06
1.36
0.98
29
0.47
2.66
3,410
25.20
1.36
1.02
30
0.47
2.66
1,837
27.07
0.89
0.91
31
0.47
2.66
1,658
24.26
0.89
0.84
32
0.47
2.66
1,668
20.16
0.89
0.80
33
0.47
2.66
3,276
14.41
0.89
0.66
34
0.47
2.66
796
28.93
0.42
0.82
35
0.47
2.66
667
33.85
0.42
0.87
36
0.47
2.66
913
40.80
0.42
0.98
37
0.47
2.66
1
79.69
0.04
0.45
38
0.47
2.66
17
95.27
0.04
0.56
39
0.47
2.66
20
107.70
0.04
0.65
40
0.47
2.66
47
119.29
0.08
0.73
(continued)
609
C. Montes et al.
|
Non-deposition self-cleansing models for large sewer pipes
Water Science & Technology
|
81.3
|
2020
Downloaded from http://iwaponline.com/wst/article-pdf/81/3/606/767607/wst081030606.pdf
by guest
on 08 March 2022

to the one used for the non-deposition without deposited
bed case. The main difference related to the supply of sedi-
ment into the pipe, as the non-deposition with deposited
bed case required constant sediment thickness throughout
the entire length of the test. The whole data collection strat-
egy was as follows. Firstly, an initial pipe slope was
mechanically adjusted, and the
flow control valve was
opened. As a result, a constant water
flow was supplied to
the pipe, and its value was recorded with the real-time elec-
tromagnetic
flowmeter. Secondly, the sediment feeder was
slowly opened until the material formed a permanent depos-
ited loose bed, which was continuously monitored by visual
inspection. Thirdly, the water levels were recorded using the
four-point gauges, and uniform conditions were checked for.
If non-uniform conditions were observed, the downstream
Table 1
|
continued
Run no.
d
SG
C
v
R
S
o
V
l
(mm)
(
)
(ppm)
(mm)
(%)
(m/s)
41
0.47
2.66
43
100.77
0.17
0.79
42
0.47
2.66
6
88.37
0.17
0.60
43
1.22
2.67
955
22.37
0.68
0.77
44
1.22
2.67
1,043
25.20
0.68
0.81
45
1.22
2.67
1,150
28.00
0.68
0.85
46
1.22
2.67
1,341
30.78
0.68
0.91
47
1.22
2.67
1,130
33.24
0.68
0.90
48
1.22
2.67
1,421
38.40
0.68
1.02
49
1.22
2.67
943
39.90
0.42
0.96
50
1.22
2.67
826
33.85
0.42
0.86
51
1.22
2.67
745
24.89
0.42
0.71
52
1.22
2.67
13
72.82
0.17
0.50
53
1.22
2.67
14
88.12
0.17
0.62
54
1.22
2.67
20
93.57
0.08
0.60
55
1.22
2.67
44
106.11
0.08
0.67
56
1.22
2.67
30
103.58
0.08
0.58
57
1.22
2.67
1,748
28.93
0.89
1.01
58
1.22
2.67
1,639
25.82
0.89
0.94
59
1.22
2.67
1,099
19.84
0.89
0.83
60
1.22
2.67
3,322
18.89
1.10
0.90
61
1.22
2.67
2,123
14.41
1.10
0.71
62
1.22
2.67
2,185
23.00
1.10
1.02
63
1.22
2.67
2,645
22.69
1.40
1.04
64
1.22
2.67
2,791
18.25
1.40
0.95
65
1.22
2.67
3,692
14.41
1.40
0.71
66
2.60
2.64
83
80.73
0.21
0.75
67
2.60
2.64
129
90.37
0.21
0.87
68
1.51
2.66
21
90.86
0.04
0.60
69
1.51
2.66
62
89.12
0.04
0.79
70
1.51
2.66
44
87.37
0.04
0.74
71
1.51
2.66
68
86.36
0.13
0.75
72
1.51
2.66
54
74.69
0.13
0.66
73
1.51
2.66
70
72.02
0.21
0.70
74
1.51
2.66
96
78.91
0.21
0.76
75
1.51
2.66
66
84.84
0.21
0.78
76
1.51
2.66
76
86.61
0.04
0.76
77
1.51
2.66
80
88.37
0.04
0.78
78
1.51
2.66
2,729
17.62
1.19
1.10
79
1.51
2.66
1,701
20.48
0.72
0.87
80
1.51
2.66
2,086
18.89
0.93
0.99
81
1.51
2.66
4,066
9.23
1.19
0.62
(continued)
Table 1
|
continued
Run no.
d
SG
C
v
R
S
o
V
l
(mm)
(
)
(ppm)
(mm)
(%)
(m/s)
82
1.51
2.66
6,869
7.92
1.91
0.78
83
1.51
2.66
6,253
7.92
1.78
0.78
84
2.60
2.64
18
92.83
0.04
0.59
85
2.60
2.64
23
101.71
0.04
0.64
86
2.60
2.64
527
48.77
0.47
1.14
87
2.60
2.64
903
38.10
0.47
1.00
88
2.60
2.64
1,068
29.55
0.47
0.88
89
2.60
2.64
541
57.39
0.47
1.24
90
2.60
2.64
1,373
41.69
1.23
1.41
91
2.60
2.64
2,800
33.24
1.23
1.22
92
0.35
2.65
83
42.88
0.04
0.41
93
0.35
2.65
86
50.52
0.04
0.57
94
0.35
2.65
176
55.97
0.04
0.64
95
0.35
2.65
188
63.01
0.04
0.74
96
0.35
2.65
32
82.28
0.04
0.61
97
0.35
2.65
85
103.34
0.04
0.80
98
0.35
2.65
500
54.55
2.54
1.21
99
0.35
2.65
843
42.88
2.54
1.09
100
0.35
2.65
963
33.85
2.54
1.00
101
2.60
2.64
3,025
11.51
0.89
0.61
102
2.60
2.64
1,945
19.53
0.89
0.88
103
2.60
2.64
1,869
26.14
0.89
1.06
104
2.60
2.64
1,726
31.71
0.89
1.11
105
2.60
2.64
999
32.93
0.59
1.05
106
2.60
2.64
994
40.20
0.59
1.13
107
2.60
2.64
824
48.77
0.59
1.19
610
C. Montes et al.
|
Non-deposition self-cleansing models for large sewer pipes
Water Science & Technology
|
81.3
|
2020
Downloaded from http://iwaponline.com/wst/article-pdf/81/3/606/767607/wst081030606.pdf
by guest
on 08 March 2022

tailgate was varied until water level differences were smaller
than
±2 mm between the four-point gauges. In this step, if
the non-deposition with deposited bed condition changed
(because a permanent deposit or dunes formed by the
change in water level), the pipe slope and the tailgate were
iteratively adjusted until uniform
flow conditions and a con-
stant sediment width had been observed for at least 15 min.
Fourthly, the water level, the pipe slope and the sediment
width values were recorded, and the sediment thickness
(using the sediment width value) and
flow velocity (using
flowrate and water level) were calculated. Finally, the
sediment supply rate was measured at the outlet of the
pipe. The sediment that passed in a given time was collected,
dried and weighed, and the sediment discharge was calcu-
lated, as described in the
‘Non-deposition without deposited
bed
’ section. Five samples of sediments were collected to vali-
date that the sediment supply rate was constant during the
entire test. The volumetric sediment concentration was com-
puted using the sediment discharge and the
flowrate.
The experimental procedure described was repeated for
several
flowrates, pipe slopes and sediment sizes. A total of
54 experiments were carried out to collect data for the non-
deposition with deposited bed case. The experimental data
collected this way is presented in
Table 2
.
Literature data
Other datasets were collected from the literature for the self-
cleansing models shown in
Table 3
. A total of 483 and 400
data for non-deposition without deposited bed and with
deposited bed, respectively, were collected. These data
were used to evaluate the performance of the self-cleansing
models proposed in this study.
NEW SELF-CLEANSING MODELS
The least absolute shrinkage and selection operator
(LASSO) (
Tibshirani
) regression method was used in
this study to develop new self-cleansing models. The
LASSO method can be seen as an extension of ordinary
least squares (OLS), because it minimizes the value of the
residual sum of squares (RSS). However, this is a shrinkage
method for feature selection which itself solves the problem
of multicollinearity by increasing the bias of the regression
in search of decrease in the variance. Additionally, it uses
the absolute value of the coef
ficients in the shrinkage pen-
alty, which allows this method to reduce some of the
regression coef
ficients to an exact value of zero. This helps
to avoid problems related to model interpretation and over-
fitting (
James et al.
). The LASSO method coef
ficients
minimize the following expression:
min
X
n
i
¼1
y
i
β
0
þ
X
p
j
¼1
β
j
x
ij
0
@
1
A
0
@
1
A
2
þ λ
L
X
p
j
¼1
jβ
j
j
2
6
4
3
7
5
¼ min RSS þ λ
L
X
p
j
¼1
jβ
j
j
2
4
3
5
(4)
where y
i
are the observed values; n the number of data;
β
0
the intercept value;
β
j
the model parameter j; x
ij
the input
variable set and
λ
L
P
p
j
¼1
jβ
j
j the shrinkage penalty (
James
et al.
).
Selection of model input variables to represent the particle
Froude number are made based on the variables that have the
greatest impact on sediment transport. Several authors (
May
et al.
;
Ebtehaj & Bonakdari
a
,
b
) found that the
size and roughness of the pipe (represented by the Darcy fric-
tion factor and the pipe diameter), the relative
flow depth, the
diameter of particle size, the speci
fic gravity of sediments and
the volumetric sediment concentration are the input variables
that best predict sediment transport. These input variables
can be divided into four dimensionless groups called: (i) trans-
port: de
fined by the volumetric sediment concentration; (ii)
sediment: de
fined by the dimensionless grain size, the specific
gravity of sediments and the d
=D variable; (iii) transport
mode: de
fined by d=R, D
2
=A, y
s
=D, W
b
=Y and R=D; and (iv)
flow resistance: defined by the Darcy friction factor. Based on
these, the input variables vector x
ij
should include the previous
variables to predict the particle Froude number.
Two new self-cleansing models were developed for the
two sediment non-deposition conditions already mentioned.
The R package
‘glmnet’ (
Friedman et al.
) was used to
apply the LASSO method. In both cases the model output
variable was the threshold particle Froude number F
Ri
and
the model input variables were selected automatically
from the set x
ij
by solving the following regression problem:
min
X
n
i
¼1
ln (F
Roi
)
ln β
0
þ
X
p
j
¼1
β
j
x
ij
0
@
1
A
0
@
1
A
2
þ λ
L
X
p
j
¼1
jβ
j
j
2
6
4
3
7
5
¼ min
X
n
i
¼1
(ln (F
Roi
)
ln (F
Ri
))
2
þ λ
L
X
p
j
¼1
jβ
j
j
2
4
3
5
(5)
x
ij
¼
Y
D
, D
gr
,
λ,
d
R
,
d
D
,
d
A
,
D
2
A
, C
v
,
W
b
Y
,
y
s
D
(6)
611
C. Montes et al.
|
Non-deposition self-cleansing models for large sewer pipes
Water Science & Technology
|
81.3
|
2020
Downloaded from http://iwaponline.com/wst/article-pdf/81/3/606/767607/wst081030606.pdf
by guest
on 08 March 2022

Table 2
|
Non-deposition with deposited bed data experimentally collected in the 595 mm PVC pipe
Run no.
d
SG
C
v
R
S
o
V
l
y
s
=D
W
b
(mm)
(-)
(ppm)
(mm)
(%)
(m/s)
(%)
(mm)
1
1.51
2.66
786
23.46
0.975
0.73
0.94
115
2
1.51
2.66
763
22.76
0.720
0.80
0.13
43
3
1.51
2.66
744
26.57
0.763
0.83
0.25
60
4
1.51
2.66
982
28.63
0.763
0.96
0.21
55
5
1.51
2.66
389
35.25
0.508
0.86
0.38
73
6
1.51
2.66
702
32.62
0.763
0.93
1.12
125
7
1.51
2.66
939
39.54
0.805
1.05
0.86
110
8
1.51
2.66
632
51.01
0.720
0.90
0.58
90
9
1.51
2.66
1,214
20.87
0.975
0.87
0.61
93
10
1.51
2.66
3,283
14.96
1.822
0.82
0.51
85
11
1.51
2.66
9,596
20.34
2.076
1.12
1.03
120
12
1.51
2.66
4,419
22.08
1.992
1.15
0.51
85
13
1.51
2.66
10,275
9.63
5.424
0.87
0.30
65
14
1.51
2.66
2,980
29.03
1.525
1.16
0.86
110
15
1.51
2.66
2,249
23.84
1.525
1.00
0.30
65
16
1.51
2.66
6,227
15.90
2.500
1.06
0.58
90
17
1.51
2.66
2,128
35.73
0.847
1.06
1.12
125
18
1.51
2.66
7,400
22.25
2.034
1.21
0.71
100
19
1.51
2.66
3,702
23.67
2.034
1.11
0.45
80
20
1.51
2.66
4,172
25.03
2.034
1.21
0.78
105
21
2.6
2.64
2,951
28.40
1.525
1.16
0.86
110
22
2.6
2.64
4,435
23.02
1.992
1.23
0.58
90
23
2.6
2.64
4,962
20.49
2.119
1.04
0.45
80
24
2.6
2.64
9,101
14.96
2.585
1.07
0.51
85
25
2.6
2.64
2,213
40.97
1.314
1.18
0.58
90
26
2.6
2.64
4,995
33.33
1.568
1.21
0.64
95
27
2.6
2.64
3,432
36.12
1.398
1.24
0.58
90
28
2.6
2.64
2,408
44.25
1.271
1.39
1.12
125
29
2.6
2.64
1,968
52.01
1.059
1.26
0.86
110
30
2.6
2.64
1,615
55.59
1.017
1.29
0.71
100
31
1.22
2.67
2,327
15.26
1.653
0.90
0.35
70
32
1.22
2.67
4,759
17.26
1.653
1.11
0.45
80
33
1.22
2.67
3,162
22.01
1.653
1.17
0.64
95
34
1.22
2.67
1,710
30.22
1.229
0.97
0.40
75
35
1.22
2.67
987
31.51
1.229
1.17
0.51
85
36
1.22
2.67
1,052
20.90
0.890
0.81
0.38
73
37
1.22
2.67
1,660
31.19
0.466
0.80
0.45
80
38
1.22
2.67
488
27.58
0.636
0.89
0.55
88
39
1.22
2.67
3,365
9.01
1.525
0.88
0.18
50
40
1.22
2.67
2,527
29.46
1.144
1.28
0.67
97
41
1.22
2.67
652
34.59
0.720
1.01
0.51
85
(continued)
612
C. Montes et al.
|
Non-deposition self-cleansing models for large sewer pipes
Water Science & Technology
|
81.3
|
2020
Downloaded from http://iwaponline.com/wst/article-pdf/81/3/606/767607/wst081030606.pdf
by guest
on 08 March 2022

where F
Roi
and F
Ri
are the observed and estimated particle
Froude number, de
fined as:
F
Roi
¼
V
L
ffiffiffiffiffiffiffiffiffiffiffiffiffiffiffiffiffiffiffiffiffiffiffiffi
gd
(SG
1)
p
(7)
F
Ri
¼ β
0
þ
X
p
j
¼1
β
j
x
ij
(8)
where V
L
is the self-cleansing velocity, g is gravitational con-
stant, SG is the speci
fic gravity of the sediment, S
o
the pipe
slope, D the pipe diameter, A the wetted area, R the hydraulic
radius, D
gr
the dimensionless grain size,
λ the Darcy friction
factor, d is mean particle diameter, Y the water level, C
v
the
volumetric sediment concentration and W
b
the bed sediment
width. By applying the LASSO method to 107 experimental
data collected, the following model was obtained for the
non-deposited conditions (linearized version shown in
Equation (9) and non-linear in Equation (10)):
ln (F
Ri
)
¼ 1:566 þ 0:058 ln (λ) 0:593 ln
d
R
þ 0:209 ln (C
v
)
(9)
F
Ri
¼ 4:79λ
0
:058
d
R
0:593
C
0
:209
v
(10)
The same analysis was carried out for the non-depo-
sition with deposited bed condition. The 54 data collected
in the laboratory were used as observed information. The
model obtained was similar to the one for non-deposition
without deposited bed condition (see Equations (9) and
(10)) with the difference being that the input variables
y
s
=D and D
gr
appear in the
final expression:
ln (F
Ri
)
¼ 1:764 0:169 ln (D
gr
)
þ 0:144 ln (C
v
)
0:104 ln
y
s
D
0:305 ln
d
R
0:059 ln (λ)
(11)
F
Ri
¼ 5:83D
0:169
gr
C
0
:144
v
y
s
D
0:104
d
R
0:305
λ
0:059
(12)
VALIDATION OF SELF-CLEANSING MODELS
The self-cleansing models shown in Equations (10) and (12)
were tested with the datasets obtained from the literature (as
shown in
Table 3
) with the aim of (a) further evaluating the
accuracy of the self-cleansing models shown here and (b)
comparing these to literature models, all under the different
hydraulic conditions and sediment characteristics, used in
the literature. In addition, the literature self-cleansing
models shown in
Table 3
, all of which were developed
with the data collected on smaller pipes (i.e. less than
500 mm), were tested with the data collected on the
595 mm PVC pipe to further assess their prediction accuracy
under these conditions.
Table 2
|
continued
Run no.
d
SG
C
v
R
S
o
V
l
y
s
=D
W
b
(mm)
(-)
(ppm)
(mm)
(%)
(m/s)
(%)
(mm)
42
1.22
2.67
460
37.32
0.678
0.90
0.45
80
43
1.22
2.67
1,504
17.05
1.059
0.75
0.25
60
44
1.22
2.67
5,697
12.11
2.203
1.20
0.33
68
45
0.47
2.66
2,516
8.43
1.398
1.39
0.49
83
46
0.47
2.66
2,594
9.46
1.610
1.20
0.33
68
47
0.47
2.66
8,522
10.34
2.373
1.05
0.29
64
48
0.47
2.66
6,424
14.12
2.373
1.53
0.32
67
49
0.47
2.66
5,317
15.06
1.822
1.36
0.71
100
50
0.47
2.66
2,572
17.63
1.314
1.10
0.39
74
51
0.47
2.66
547
19.78
0.847
0.92
0.35
70
52
0.47
2.66
764
27.60
0.890
0.89
0.30
65
53
0.47
2.66
1,918
24.86
1.229
1.05
0.35
70
54
0.47
2.66
5,131
21.53
1.780
1.30
0.38
73
613
C. Montes et al.
|
Non-deposition self-cleansing models for large sewer pipes
Water Science & Technology
|
81.3
|
2020
Downloaded from http://iwaponline.com/wst/article-pdf/81/3/606/767607/wst081030606.pdf
by guest
on 08 March 2022
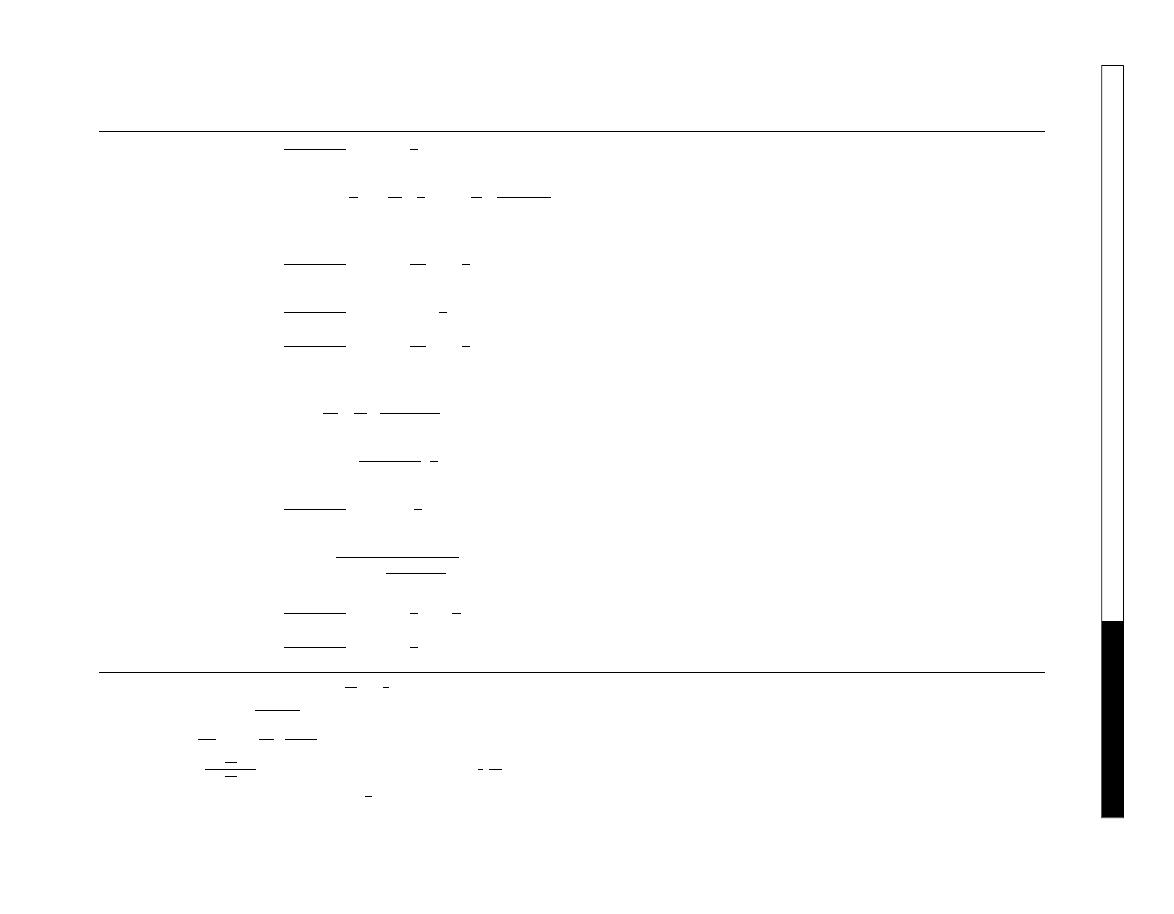
Table 3
|
Literature self-cleansing models for predicting the non-deposition sediment conditions in sewer pipes
Reference
Model
Non-deposition criterion
No.
data
Pipe diameter
(mm)
Particle
diameter (mm)
Sediment
concentration (ppm)
Mayerle (
)
. Data collected from
Safari et al. (
)
V
l
ffiffiffiffiffiffiffiffiffiffiffiffiffiffiffiffiffiffiffiffiffiffiffiffi
gd
(SG
1)
p
¼ 4:32C
0
:23
v
d
R
0:68
Without deposited bed
106
152
0.50
–8.74
20
–1,275
May et al. (
)
C
v
¼ 0:0211
Y
D
0
:36
D
2
A
d
R
0
:60
1
V
t
V
l
4
V
2
l
gD
(SG
1)
1
:5
Without deposited bed
48
298.8
0.72
0.31
–443
Perrusquía (
)
Only experimental data
With deposited bed
38
225
0.9
18.7
–408
El-Zaemey (
)
V
l
ffiffiffiffiffiffiffiffiffiffiffiffiffiffiffiffiffiffiffiffiffiffiffiffi
gd
(SG
1)
p
¼ 1:95C
0
:17
v
W
b
Y
0:40
d
D
0:57
λ
0
:10
With deposited bed
290
305
0.53
–8.4
7.0
–917
Ab Ghani (
)
V
l
ffiffiffiffiffiffiffiffiffiffiffiffiffiffiffiffiffiffiffiffiffiffiffiffi
gd
(SG
1)
p
¼ 3:08C
0
:21
v
D
0:09
gr
d
R
0:53
λ
0:21
s
Without deposited bed
221
154, 305 and
450
0.46
–8.30
0.76
–1,450
Ab Ghani (
)
V
l
ffiffiffiffiffiffiffiffiffiffiffiffiffiffiffiffiffiffiffiffiffiffiffiffi
gd
(SG
1)
p
¼ 1:18C
0
:16
v
W
b
Y
0:18
d
D
0:34
λ
0:31
With deposited bed
26
450
0.72
21
–1,269
May (
)
Only experimental data
Without deposited bed
27
450
0.73
2
–38
May (
)
η ¼ C
v
D
W
b
A
D
2
λ
g
θ
f
V
2
l
8g(SG
1)D
1
With deposited bed
46
450
0.47
–0.73
3.5
–8.23
Ota (
)
C
v
¼ 0:001965
V
l
ffiffiffiffiffiffiffiffiffiffiffiffiffiffiffiffiffiffiffiffiffiffiffiffi
gd
(SG
1)
p
d
R
2
=3
"
#
3
:645
Without deposited bed
36
305
0.71
–5.6
4.2
–59.4
Vongvisessomjai et al. (
)
V
l
ffiffiffiffiffiffiffiffiffiffiffiffiffiffiffiffiffiffiffiffiffiffiffiffi
gd
(SG
1)
p
¼ 4:31C
0
:226
v
d
R
0:616
Without deposited bed
45
100 and 150
0.20
–0.43
4
–90
Safari et al. (
b
)
η ¼ 0:95
2
:83
exp 8
:36
λ
g
θ
f
V
2
l
8g(SG
1)D
With deposited bed
Data from
May (
)
Safari & Shirzad (
)
V
l
ffiffiffiffiffiffiffiffiffiffiffiffiffiffiffiffiffiffiffiffiffiffiffiffi
gd
(SG
1)
p
¼ 3:66C
0
:16
v
d
R
0:40
y
s
Y
0:10
With deposited bed
Data from
El-Zaemey (
)
,
Perrusquía (
)
,
May (
)
and
Ab
Ghani (
)
Montes et al. (
)
V
l
ffiffiffiffiffiffiffiffiffiffiffiffiffiffiffiffiffiffiffiffiffiffiffiffi
gd
(SG
1)
p
¼ 3:35C
0
:20
v
d
R
0:60
Without deposited bed
Data from
Ab Ghani (
)
λ
s
: Darcy
’s friction factor with sediment, λ
s
¼ 0:0014C
0:04
v
W
b
Y
0
:34
R
d
0
:24
D
0
:54
gr
.
D
gr
: Dimensionless grain size, D
gr
¼
gd
3
(SG
1)
ν
2
1
=3
.
λ
g
: Grain friction factor,
1ffiffiffiffiffi
λ
g
p ¼ 2 log
d
12R
þ
0
:6275ν
V
l
R
ffiffiffiffiffi
λ
g
p
"
#
, where
ν is the kinematic viscosity of fluid.
θ
f
: Transition factor,
θ
f
¼
exp
Re
12
:5
1
exp
Re
12
:5
þ 1
, where Re
is the particle Reynolds number, Re
¼
ffiffiffi
λ
8
r
V
l
d
ν
.
V
t
: Incipient motion threshold velocity, V
t
¼ 0:125(gd(SG 1))
0
:5
Y
d
0
:47
.
η: Dimensionless parameter of transport.
614
C.
Montes
et
al.
|
Non-deposition
self-cleansing
models
for
large
sew
er
pipes
Wa
ter
Science
&
Technology
|
81.3
|
2020
Downloaded from http://iwaponline.com/wst/article-pdf/81/3/606/767607/wst081030606.pdf
by guest
on 08 March 2022

Model prediction accuracy is estimated using two per-
formance indicators, root mean squared error (RMSE) and
mean absolute percentage error (MAPE):
RMSE
¼
ffiffiffiffiffiffiffiffiffiffiffiffiffiffiffiffiffiffiffiffiffiffiffiffiffiffiffiffiffiffiffiffiffiffiffiffiffiffi
P
n
i
¼1
(F
Roi
F
Ri
)
2
n
s
(13)
MAPE
¼
100
n
X
n
i
¼1
F
Roi
F
Ri
F
Roi
(14)
Note that a value of RMSE and MAPE close to 0 indi-
cates high model prediction accuracy, i.e. good
fit between
the observed and predicted data. The RMSE and MAPE
values obtained for the case of non-deposition without
deposited bed are presented in
Table 4
.
The following observations can be made from
Table 4
:
•
The
Mayerle (
)
model seems to be over
fitted as it has
high
prediction
accuracy
(RMSE
¼ 4.119; MAPE ¼
10.079) only for the data collected in their own exper-
iments. When this model is applied to other datasets, the
results are not satisfactory. For example, when the
Mayerle
(
)
model is applied to the data collected in our exper-
iments, poor performance is obtained (as shown in
Figure 2
). This is due to the inability of this model to extrap-
olate predictions beyond the range of data that was used for
its development.
•
Results obtained by using the
May et al. (
)
model
were similar to the
Mayerle (
)
model results. If the
May et al. (
)
model is used for designing large self-
cleansing sewer pipes, the model tends to overestimate
the minimum velocity required to avoid particle depo-
sition. Additionally, an incipient motion threshold
velocity is required to use this model. This value needs
to be estimated on the basis of experimental data and
regression equations obtained for certain sediment
characteristics which is not pragmatic. In this context,
Safari et al. (
)
outlined several studies that attempt
to predict incipient motion threshold velocity using
equations based on experimental data.
•
The
Ab Ghani (
)
model presents better results in
comparison with
Mayerle (
)
and
May et al. (
)
models. The model includes two additional input vari-
ables (the dimensionless grain size and the Darcy
friction factor) to predict the particle Froude number.
However, the value of the exponent related to the dimen-
sionless grain size is low (
0.09), which shows that this
variable is not a signi
ficant input for this model. In
addition, this model has good prediction performance
when the 595 mm pipe diameter data (for F
Roi
< 8.0) is
used (as shown in
Figure 2
), for the same abovemen-
tioned previously.
•
The
Ota (
)
model uses a similar group of input vari-
ables to estimate the self-cleansing velocity. This model
Table 4
|
Performance of models found in the literature and the new self-cleansing model (Equation (10)) obtained for non-deposition without deposited bed criterion
Dataset
Performance
index
Self-cleansing model
Mayerle
(1988)
May et al.
(1989)
Ab Ghani
(1993)
Ota
(1999)
Vongvisessomjai
et al. (2010)
Montes et al.
(2018)
New model,
Equation (10)
Mayerle (
)
RMSE
4.119
3.273
3.376
3.502
3.310
3.170
3.147
MAPE
10.079
15.194
9.636
10.439
10.762
14.500
12.504
May et al. (
)
RMSE
4.321
3.433
3.545
3.652
3.472
3.330
3.302
MAPE
12.400
17.822
16.637
16.593
17.657
21.657
21.810
May (
)
RMSE
4.151
3.291
3.392
3.511
3.328
3.189
3.167
MAPE
37.349
9.706
10.738
8.110
9.536
9.226
8.331
Ab Ghani (
)
RMSE
1.598
0.567
0.603
0.762
0.569
0.500
0.510
MAPE
26.965
9.338
10.350
11.930
10.278
8.730
9.435
Ota (
)
RMSE
4.068
3.210
3.306
3.424
3.234
3.093
3.066
MAPE
19.632
12.396
9.644
10.313
7.461
7.174
6.807
Vongvisessomjai et al.
(
)
RMSE
3.956
3.132
3.222
3.332
3.159
3.031
3.007
MAPE
24.764
8.274
6.748
4.626
2.036
5.337
2.012
Current study
RMSE
4.041
3.177
3.276
3.387
3.208
3.072
3.047
MAPE
40.327
29.304
23.307
28.990
19.203
15.639
14.471
Values in bold type show the best performing model in each dataset analysed.
615
C. Montes et al.
|
Non-deposition self-cleansing models for large sewer pipes
Water Science & Technology
|
81.3
|
2020
Downloaded from http://iwaponline.com/wst/article-pdf/81/3/606/767607/wst081030606.pdf
by guest
on 08 March 2022
has similar prediction results to the
Mayerle (
)
and
May et al. (
)
models, with acceptable accuracy for
small particle Froude numbers and poor prediction accu-
racy for larger particle Froude number values (F
Ri
> 7.0),
as shown in
Figure 2
.
•
The
Vongvisessomjai et al. (
)
model shows good per-
formance in general for all datasets. However, when this
equation is applied to the 595 mm PVC pipe diameter
data, the model tends to overestimate the particle
Froude number (as shown in
Figure 2
). In comparison
with the
Ab Ghani (
)
model, this model is simpler
and does not consider the dimensionless grain size
and the Darcy friction factor in the estimation of the
modi
fied Froude number (structure is similar to
Ota
(
)
equation) which is an advantage. This model
seems to be more general and good in the prediction
on self-cleansing conditions for pipe diameters of less
than 500 mm.
•
The
Montes et al. (
)
model tends to represent the
observed data for all the datasets evaluated better than
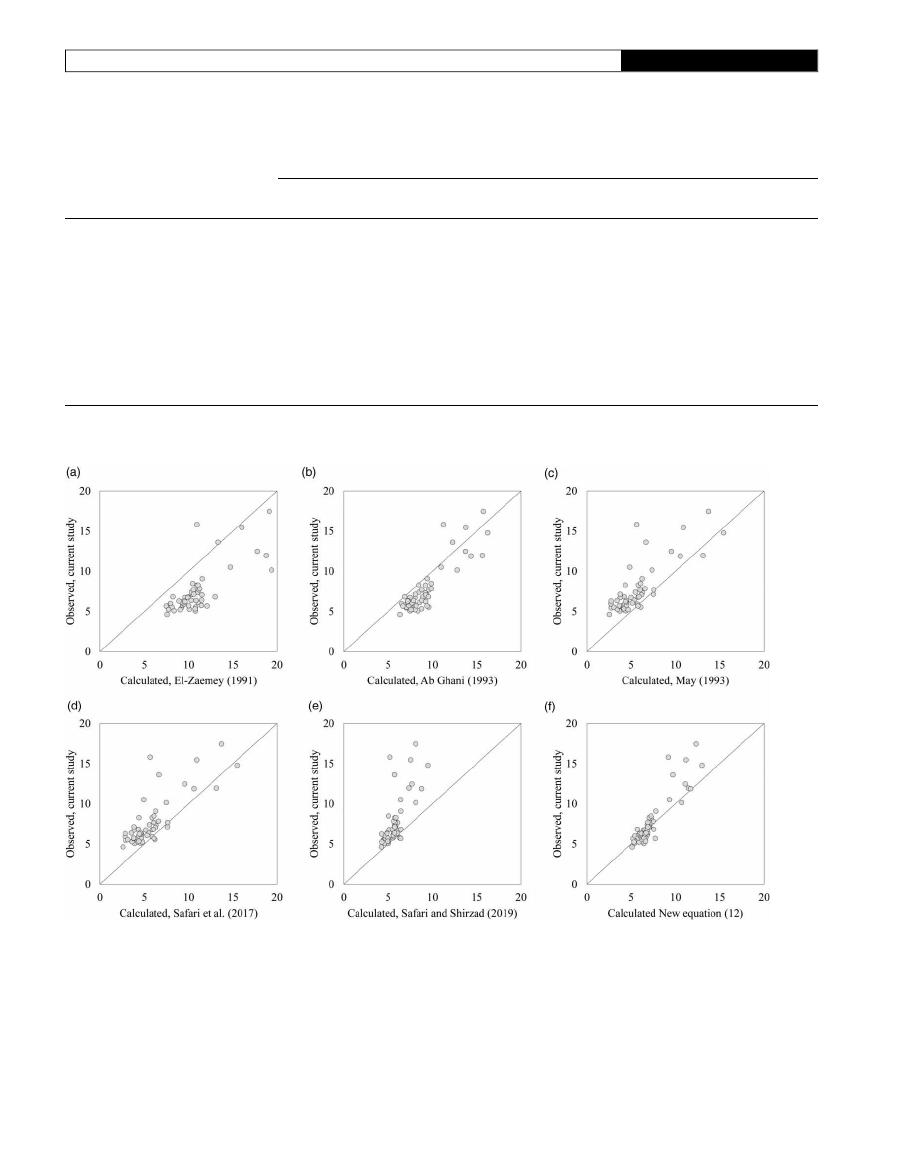
Figure 2
|
Comparison of performance of non-deposition without deposited bed models using the experimental data collected for the 595 mm PVC pipe. (a)
Mayerle (1988)
; (b)
May et al.
(1989)
; (c)
Ab Ghani (1993)
; (d)
Ota (1999)
; (e)
Vongvisessomjai et al. (2010)
; (f)
Montes et al. (2018)
; and (g) Equation (10).
616
C. Montes et al.
|
Non-deposition self-cleansing models for large sewer pipes
Water Science & Technology
|
81.3
|
2020
Downloaded from http://iwaponline.com/wst/article-pdf/81/3/606/767607/wst081030606.pdf
by guest
on 08 March 2022
previous self-cleansing models. This model has the same
structure as the
Vongvisessomjai et al. (
)
and
Ota
(
)
models, with values of exponents of different
input variables being slightly different. The model
shows high accuracy for all datasets but is still inferior
to the new model shown in Equation (10) (see below).
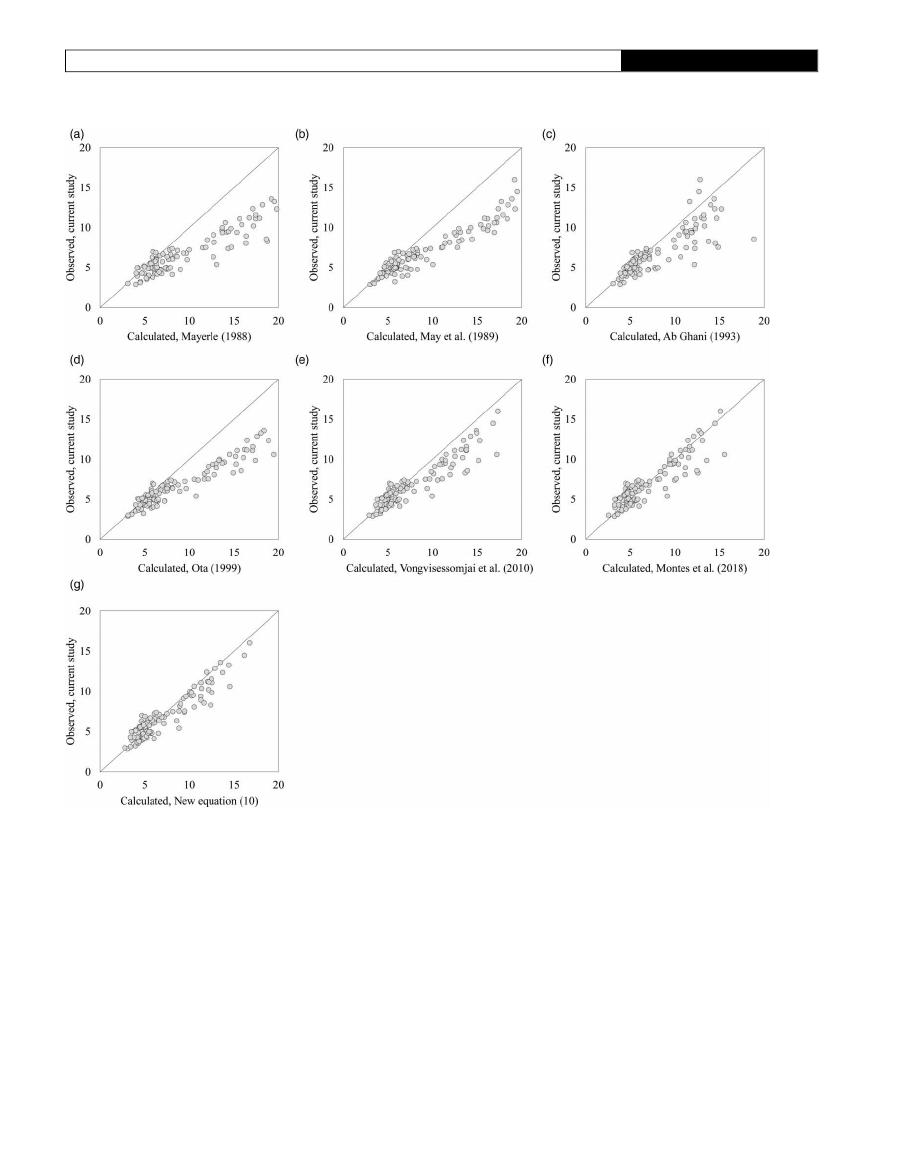
•
The new model shown in Equation (10) has high predic-
tion accuracy for all datasets, especially for the data
collected using larger sewer pipes. Even when this
model is applied to existing data in the literature, better
results are obtained than those obtained using literature
self-cleaning models (as shown in
Figure 3
and
Table 4
).
This model has a similar structure to the
Vongvisessomjai
et al.
(
)
and
Montes et al. (
)
equations.
As the previous results show, all the traditional self-
cleansing models found in the literature presents poor
performance/accuracy when tested with the new exper-
imental dataset. As
Figure 2
shows, all the models tend to
overestimate the threshold velocity. This con
firms the
assumption that traditional self-cleansing models can make
accurate predictions only for small sewer pipes, i.e. pipes
with diameter
<500 mm.
The results obtained for the case of non-deposition with
deposited bed data are shown in
Table 5
.
The following can be observed from
Table 5
:
•
The
El-Zaemey (
)
model tends to correctly represent
the self-cleansing conditions for
Perrusquía (
)
data
and their own data. However, for
Ab Ghani (
)
and
our data collected on the 595 mm PVC pipe, this
model
’s performance is poor, with low fitting levels
obtained (as shown in
Figure 4
). This model tends to over-
estimate the minimum self-cleansing velocity, which
leads to installing steeper and hence more costly pipes.
•
The
Ab Ghani (
)
model has the same structure as the
El-Zaemey (
)
model, as both models consider the
same group of input variables to calculate the threshold
self-cleansing velocity. The results obtained tend to pre-
sent good accuracy for all datasets. The
Ab Ghani
(
)
model has acceptable accuracy even on our data
collected on the 595 mm PVC pipe (as shown in
Figure 4
),
with RMSE and MAPE values of 2.117 and 27.483,
respectively. Having said that, this model is still inferior
to the new model shown in Equation (12) for the data col-
lected on a large diameter pipe.
Figure 3
|
Comparison of performance of Equation (10) using the experimental data collected in the literature. Data from: (a)
Mayerle (1988)
; (b)
May et al. (1989)
; (c)
Ab Ghani (1993)
;
(d)
May (1993)
; (e)
Ota (1999)
; and (f)
Vongvisessomjai et al. (2010)
.
617
C. Montes et al.
|
Non-deposition self-cleansing models for large sewer pipes
Water Science & Technology
|
81.3
|
2020
Downloaded from http://iwaponline.com/wst/article-pdf/81/3/606/767607/wst081030606.pdf
by guest
on 08 March 2022
•
The
May (
)
model tends to underestimate the mini-
mum self-cleansing values on large sewer pipes, as
shown in
Figure 4(c)
. As a result, particle deposition pro-
blems could arise in real sewer systems. Additionally, this
model has as an input the dimensionless transport par-
ameter (
η), which was calculated for limited sediment
and hydraulic conditions. Based on the above, this trans-
port parameter is dif
ficult to estimate, and its prediction
Table 5
|
Performance of models found in the literature and the new self-cleansing model (Equation (12)) obtained for non-deposition with deposited bed criterion
Dataset
Performance index
Self-cleansing model
El-Zaemey (1991)
Ab Ghani (1993)
May (1993)
Safari et al. (2017b)
Safari & Shirzad (2019)
New model,
Equation (12)
Perrusquía (
)
RMSE
0.786
0.576
2.669
2.883
0.521
0.464
MAPE
17.411
10.833
63.261
71.279
10.550
10.348
El-Zaemey (
)
RMSE
0.494
0.814
2.580
2.749
0.757
0.659
MAPE
10.436
13.408
60.744
71.963
14.251
11.922
May (
)
RMSE
3.409
1.153
3.561
3.562
1.409
1.014
MAPE
49.757
11.702
45.381
47.177
18.734
11.154
Ab Ghani (
)
RMSE
5.105
2.407
3.724
3.722
1.316
1.161
MAPE
72.772
33.614
47.580
48.831
16.544
14.178
Current study
RMSE
4.217
2.117
2.753
2.696
3.059
1.565
MAPE
54.510
27.483
27.487
26.186
21.047
10.355
Values in bold type show the best performing model in each dataset analysed.
Figure 4
|
Comparison of performance of non-deposition with deposited bed models using the experimental data collected for the 595 mm PVC pipe. Models from: (a)
El-Zaemey (1991)
;
(b)
Ab Ghani (1993)
; (c)
May (1993)
; (d)
Nalluri et al. (1997)
; (e)
Safari et al. (2017b)
; and (f) Equation (12).
618
C. Montes et al.
|
Non-deposition self-cleansing models for large sewer pipes
Water Science & Technology
|
81.3
|
2020
Downloaded from http://iwaponline.com/wst/article-pdf/81/3/606/767607/wst081030606.pdf
by guest
on 08 March 2022
does not present good accuracy with experimental data.
Full details can be found in
May (
)
.
•
The
Safari et al. (
b
) model results are similar to the
May (
)
and
Ab Ghani (
)
models when compared
for large sewer pipes, i.e. our data. These models tend to
underestimate the minimum self-cleansing velocity in
large sewer pipes. However, the results are better than
for
El-Zaemey (
)
, as shown in
Table 5
.
•
The
Safari & Shirzad (
)
model results are similar to
May (
)
and
Safari et al. (
b)
, i.e. the self-cleansing
calculation tends to be underestimated in large sewer
pipes. In contrast, this model presents a simpler structure
because it does not consider the dimensionless parameter
of transport (
η) and the calculation of velocity is explicit.
Results tend not to be satisfactory for large sewer pipes
(as shown in
Figure 4
).
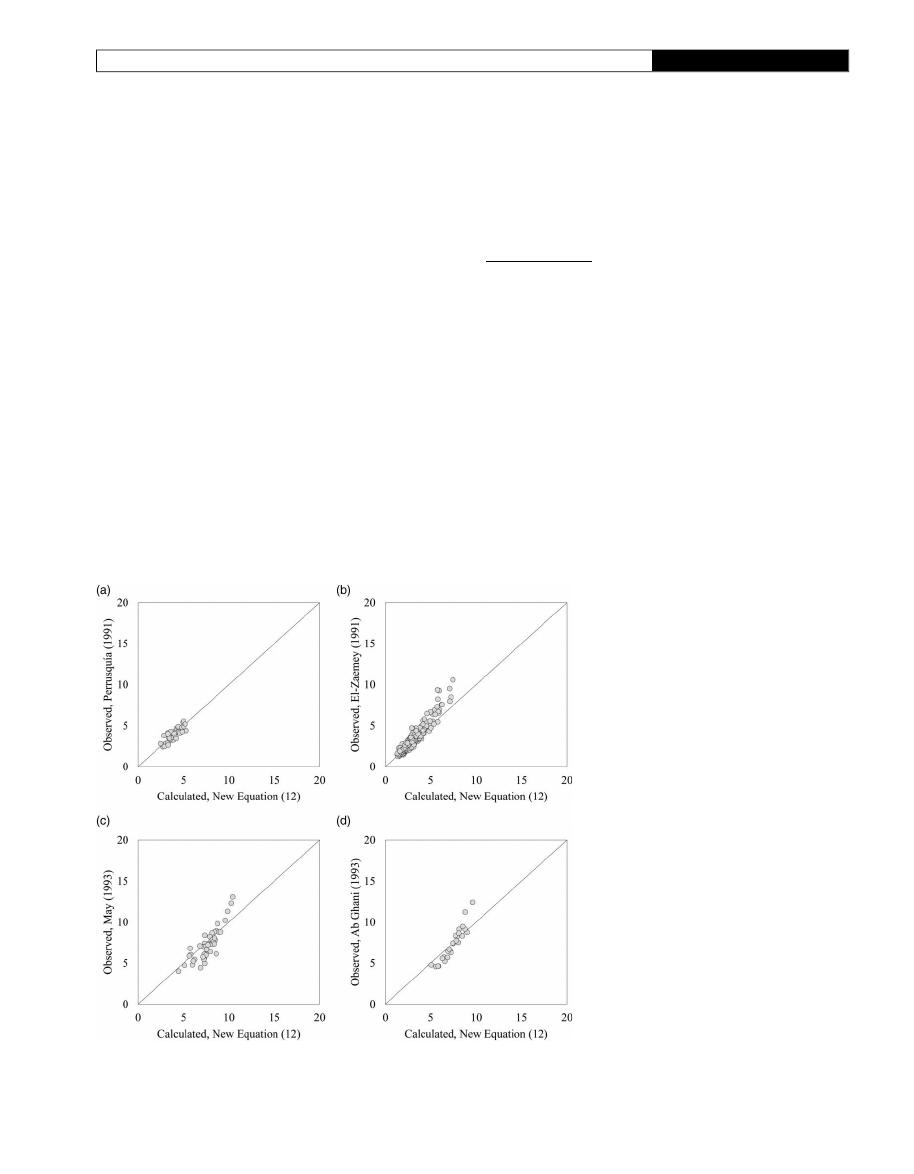
•
The new model shown in Equation (12) estimates the
self-cleansing conditions across all experimental datasets
with acceptable accuracy, as shown in
Figure 5
. This
model is explicit for calculating self-cleansing velocity
and considers similar group of parameters than the
models in the literature. Based on the results obtained,
this model can be used to design new self-cleansing
sewer pipes considering the non-deposition with depos-
ited bed criterion.
CONCLUSIONS
In this study the non-deposition criteria was applied to
large sewer pipes. A set of 107 data and 54 data, for non-
deposition without deposited bed and deposited bed,
respectively, was collected at laboratory scale. These exper-
iments were carried out varying steady
flow conditions and
sediment characteristics. The data collected were used to
test the performance of typical self-cleansing equations
found in the literature. In addition, based on the LASSO
technique, two new self-cleansing models were obtained
for each non-deposition criterion. These new models were
tested with data collected from the literature and their per-
formance was measured by using RMSE and MAPE.
Figure 5
|
Comparison of performance of Equation (12) using the experimental data collected from the literature. Data from: (a)
Perrusquía (1991)
; (b)
El-Zaemey (1991)
; (c)
May (1993)
; and
(d)
Ab Ghani (1993)
.
619
C. Montes et al.
|
Non-deposition self-cleansing models for large sewer pipes
Water Science & Technology
|
81.3
|
2020
Downloaded from http://iwaponline.com/wst/article-pdf/81/3/606/767607/wst081030606.pdf
by guest
on 08 March 2022

The following conclusions are based on the results
obtained:
(1) The two new self-cleansing models developed and pre-
sented here have overall best predictive performance
for two different sediment non-deposition criteria
when compared to a selection of well-known models
from the literature. This is especially true for predictions
made on larger diameter pipes (500 mm and above).
(2) The existing self-cleansing models from the literature
tend to be over
fitted, i.e. demonstrate a rather high pre-
diction accuracy when applied to the data collected by
the authors, but this accuracy deteriorates quickly
when applied to the datasets collected by other authors.
For large sewer pipes, these models, being developed for
datasets collected on smaller diameter pipes, tend to
overestimate the threshold self-cleansing velocities,
especially in the case of non-deposition without depos-
ited bed.
Further research is recommended to test the perform-
ance of new models in larger sewer pipes and with
different pipe materials, sediment characteristics and
hydraulic conditions. In addition, experiments under non-
steady conditions are essential to test the sediment dynamics
in real sewer systems.
SUPPLEMENTARY MATERIAL
The Supplementary Material for this paper is available online
at
https://dx.doi.org/10.2166/wst.2020.154
. Supplementary
material 1:
https://youtu.be/YC_AEBMqYC0
. Supplemen-
tary material 2:
https://youtu.be/ivyoBba8V-c
.
REFERENCES
Ab Ghani, A.
Sediment Transport in Sewers. PhD thesis,
University of Newcastle upon Tyne, Newcastle upon Tyne,
UK.
Ackers, J., Butler, D. & May, R.
Design of Sewers to Control
Sediment Problems
. Report 141, HR Wallingford, London,
UK.
Alihosseini, M. & Thamsen, P.
Analysis of sediment transport
in sewer pipes using a coupled CFD-DEM model and
experimental work
. Urban Water Journal
16 (4), 259–268.
https://doi.org/10.1080/1573062X.2019.1669187.
ASTM D854-14.
Standard Test Methods for Specific Gravity of
Soil Solids by Water Pycnometer
. ASTM International, West
Conshohocken, USA.
British Standard Institution.
Sewerage Guide to New
Sewerage Construction BS8005 Part 1
. British Standard
Institution, London, UK.
Butler, D., May, R. & Ackers, J.
Sediment transport in sewers
part 1: background
. Proceedings of the Institution of Civil
Engineers
– Water, Maritime and Energy 118 (2), 103–112.
https://doi.org/10.1680/iwtme.1996.28431.
Ebtehaj, I. & Bonakdari, H.
a
Assessment of evolutionary
algorithms in predicting non-deposition sediment transport
.
Urban Water Journal
13 (5), 499–510. https://doi.org/10.
1080/1573062X.2014.994003.
Ebtehaj, I. & Bonakdari, H.
b
Bed load sediment transport in
sewers at limit of deposition
. Scientia Iranica
23 (3), 907–917.
https://doi.org/10.24200/sci.2016.2169.
Ebtehaj, I., Bonakdari, H. & Zaji, A.
An expert system with
radial basis function neural network based on decision trees
for predicting sediment transport in sewers
. Water Science
and Technology
74 (1), 176–183. https://doi.org/10.2166/wst.
2016.174.
El-Zaemey, A.
Sediment Transport Over Deposited Beds in
Sewers
. PhD thesis, University of Newcastle upon Tyne,
Newcastle upon Tyne, UK.
Friedman, J., Hastie, T. & Tibshirani, R.
Regularization paths
for generalized linear models via coordinate descent
. Journal
of Statistical Software
33 (1), 1–22. https://doi.org/10.18637/
jss.v033.i01.
Great Lakes
Recommended Standards for Wastewater
Facilities
. Health Research Inc., Health Education Services
Division, Albany, NY.
James, G., Witten, D., Hastie, T. & Tibshirani, R.
An
Introduction to Statistical Learning
. Springer Texts in Statistics,
New York, USA. https://doi.org/10.1007/978-1-4614-7138-7.
Kargar, K., Safari, M., Mohammadi, M. & Samadianfard, S.
Sediment transport modeling in open channels using neuro-
fuzzy and gene expression programming techniques
. Water
Science and Technology
79 (12), 2318–2327. https://doi.org/
10.2166/wst.2019.229.
May, R.
Sediment Transport in Pipes and Sewers with Deposited
Beds
. Report SR 320, HR Wallingford, Oxfordshire, UK.
May, R., Brown, P., Hare, G. & Jones, K.
Self-Cleansing
Conditions for Sewers Carrying Sediment
. Report SR 221, HR
Wallingford, Oxfordshire, UK.
May, R., Ackers, J., Butler, D. & John, S.
Development of
design methodology for self-cleansing sewers
. Water Science
and Technology
33 (9), 195–205. https://doi.org/10.1016/
0273-1223(96)00387-3.
Mayerle, R.
Sediment Transport in Rigid Boundary Channels.
PhD thesis, University of Newcastle upon Tyne, Newcastle
upon Tyne, UK.
Montes, C., Berardi, L., Kapelan, Z. & Saldarriaga, J.
Evaluation of Sediment Transport in Sewers Using the EPR-
MOGA-XL. In: Proceedings of the 1st International WDSA/
CCWI 2018 Joint Conference
, Kingston, Canada.
Montes, C., Kapelan, Z. & Saldarriaga, J.
Impact of self-
cleansing criteria choice on the optimal design of sewer
networks in South America
. Water
11 (6), 1148. https://doi.
org/10.3390/w11061148.
620
C. Montes et al.
|
Non-deposition self-cleansing models for large sewer pipes
Water Science & Technology
|
81.3
|
2020
Downloaded from http://iwaponline.com/wst/article-pdf/81/3/606/767607/wst081030606.pdf
by guest
on 08 March 2022

Nalluri, C. & Ab Ghani, A.
Design options for self-cleansing
storm sewers
. Water Science and Technology
33 (9), 215–220.
https://doi.org/10.1016/0273-1223(96)00389-7.
Nalluri, C., El-Zaemey, A. & Chan, H.
Sediment transport
over fixed deposited beds in sewers
– an appraisal of existing
models
. Water Science and Technology
36 (8–9), 123–128.
https://doi.org/10.1016/S0273-1223(97)00609-4.
Novak, P. & Nalluri, C.
Sediment transport in smooth fixed
bed channels. Journal of the Hydraulics Division
101 (HY9),
1139
–1154.
Ota, J.
Effect of Particle Size and Gradation on Sediment
Transport in Storm Sewers.
PhD thesis, University of
Newcastle upon Tyne, Newcastle upon Tyne, UK.
Perrusquía, G.
Bedload Transport in Storm Sewers: Stream
Traction in Pipe Channels
. PhD thesis, Chalmers University
of Technology, Gothenburg, Sweden.
Perrusquía, G.
An experimental study on the transport of
sediment in sewer pipes with a permanent deposit
. Water
Science and Technology
25 (8), 115–122. https://doi.org/10.
2166/wst.1992.0185.
Robinson, M. & Graf, W.
Critical Deposit Velocities for Low-
Concentration Sand-Water Mixtures. In: Paper Presented at
the ASCE National Water Resources Engineering Meeting
,
January 24
–28, Atlanta: GA.
Safari, M.
Decision tree (DT), generalized regression neural
network (GR) and multivariate adaptive regression splines
(MARS) models for sediment transport in sewer pipes
. Water
Science and Technology
79 (6), 1113–1122. https://doi.org/
10.2166/wst.2019.106.
Safari, M. & Shirzad, A.
Self-cleansing design of sewers:
definition of the optimum deposited bed thickness
. Water
Environment Research
91 (5), 407–416. https://doi.org/10.
1002/wer.1037.
Safari, M., Aksoy, H., Unal, N. & Mohammadi, M.
a
Non-deposition self-cleansing design criteria for drainage
systems
. Journal of Hydro-Environment Research
14
(2017), 76
–84. https://doi.org/10.1016/j.jher.2016.11.002.
Safari, M., Shirzad, A. & Mohammadi, M.
b
Sediment
transport modeling in deposited bed sewers: unified form of
may
’s equations using the particle swarm optimization
algorithm
. Water Science and Technology
76 (4), 992–1000.
https://doi.org/10.2166/wst.2017.267.
Safari, M., Mohammadi, M. & Ab Ghani, A.
Experimental studies
of self-cleansing drainage system design: a review
. Journal of
Pipeline Systems Engineering and Practice
9 (4), 04018017.
https://doi.org/10.1061/(ASCE)PS.1949-1204.0000335.
Shirazi, R., Campisano, A., Modica, C. & Willems, P.
Modelling the erosive effects of sewer flushing using
different sediment transport formulae
. Water Science and
Technology
69 (6), 1198–1204. https://doi.org/10.2166/wst.
2013.810.
Tibshirani, R.
Regression shrinkage and selection via the
Lasso
. Journal of the Royal Statistical Society: Series B
(Methodological)
58 (1), 267–288. https://doi.org/10.1111/j.
2517-6161.1996.tb02080.x.
Torres, M., Rodríguez, J. & Leitão, J.
Geostatistical analysis to
identify characteristics involved in sewer pipes and urban
tree interactions
. Urban Forestry & Urban Greening
25,
36
–42. https://doi.org/10.1016/j.ufug.2017.04.013.
Vongvisessomjai, N., Tingsanchali, T. & Babel, M.
Non-
deposition design criteria for sewers with part-full flow
.
Urban Water Journal
7 (1), 61–77. https://doi.org/10.1080/
15730620903242824.
Yao, K.
Sewer line design based on critical shear stress.
Journal of the Environmental Engineering Division
100 (2),
507
–520.
First received 23 January 2020; accepted in revised form 23 March 2020. Available online 3 April 2020
621
C. Montes et al.
|
Non-deposition self-cleansing models for large sewer pipes
Water Science & Technology
|
81.3
|
2020
Downloaded from http://iwaponline.com/wst/article-pdf/81/3/606/767607/wst081030606.pdf
by guest
on 08 March 2022
