
TESIS DE MAESTRÍA
INGENIERÍA CIVIL
MEDICIÓN Y EVALUACIÓN DE RESILIENCIA Y CONFIABILIDAD EN
DISEÑOS ÓPTIMOS DE REDES DE DRENAJE URBANO
PRESENTADO POR:
JUANA MARÍA HERRÁN MURCIA
ASESOR: JUAN SALDARRIAGA VALDERRAMA
UNIVERSIDAD DE LOS ANDES
FACULTAD DE INGENIERÍA
DEPARTAMENTO DE INGENIERÍA CIVIL Y AMBIENTAL
MAESTRÍA EN INGENIERÍA CIVIL
BOGOTÁ D.C.
2022

Universidad de los Andes
Departamento de Ingeniería Civil y Ambiental
Centro de Investigaciones en Acueductos y Alcantarillados – CIACUA
Medición y Evaluación de Resiliencia y Confiabilidad en Diseños Óptimos
de Drenaje Urbano
MIC 2022-10
Juana María Herrán Murcia
Tesis II
1
TABLA DE CONTENIDO
1
Introducción .................................................................................................................... 2
2
Versión resumida del artículo ......................................................................................... 4
3
Referencias .................................................................................................................... 22

Universidad de los Andes
Departamento de Ingeniería Civil y Ambiental
Centro de Investigaciones en Acueductos y Alcantarillados – CIACUA
Medición y Evaluación de Resiliencia y Confiabilidad en Diseños Óptimos
de Drenaje Urbano
MIC 2022-10
Juana María Herrán Murcia
Tesis II
2
1 INTRODUCCIÓN
Los sistemas de alcantarillado se encargan de evacuar las aguas residuales y pluviales con el
fin de evitar problemas de contaminación, olores y enfermedades. A pesar de la importancia
de este servicio, en el 2017, aproximadamente 2000 millones de personas en el mundo
carecían de acceso a servicios básicos de saneamiento (United Nations Children’s Fund
(UNICEF) & World Health Organization, 2019). En el caso de Colombia, algunos
departamentos están distantes de lograr una cobertura total de este servicio. Por ejemplo,
según el censo del Departamento Administrativo Nacional de Estadística (DANE) del 2018,
departamentos como Vichada, Guainía y Chocó tienen un cobertura de alcantarillado menor
al 30% (Departamento Administrativo Nacional de Estadística (DANE), 2018).
Una de las razones principales de la falta de cobertura de alcantarillado es el presupuesto
limitado, en especial en países en desarrollo. Por esta razón, es de gran importancia diseñar
redes de mínimo costo que cumplan con todas las restricciones hidráulicas para una adecuada
operación. La reducción de costos que puede lograr un diseño de mínimo costo es muy
significativa debido a la gran cantidad de diseños posibles, incluso, se sabe que la diferencia
del costo entre dos trazados diferentes de una red de alcantarillado puede variar hasta en un
50% (Saldarriaga, Cuero, Montaño, Corrales, & Luna, 2014).
Además del presupuesto limitado, en las últimas décadas, los sistemas de alcantarillado se
han enfrentado a nuevos retos como el cambio climático y la urbanización, los cuales pueden
aumentar la probabilidad de inundación de los sistemas. Debido a lo anterior, al momento de
diseñar sistemas de alcantarillado se debe buscar obtener el diseño de menor costo, pero
también garantizar que este sea resiliente y confiable.
La resiliencia y confiabilidad son dos conceptos que describen a un sistema que busca evitar
fallas en su operación, que en este caso se entienden como inundaciones. Si bien ambos
conceptos están relacionados, no tienen la misma definición. Según Butler et al. (2014), la
confiabilidad se define como el grado en que el sistema minimiza la frecuencia de los fallos
de nivel de servicio a lo largo de su vida útil cuando se somete a cargas estándar, mientras
que la US National Infrastructure Advisory Council (2009) define la resiliencia como la
habilidad del sistema para reducir la magnitud o duración del evento de falla.
El presente trabajo propone una metodología para evaluar la resiliencia y confiabilidad de
diseños de redes de alcantarillado que busca ser una herramienta para encontrar diseños de
bajo costo y alta resiliencia y/o confiabilidad. Para obtener diseños de bajo costo se utilizó la
metodología de diseño optimizado de redes de alcantarillado desarrollada en el Centro de

Universidad de los Andes
Departamento de Ingeniería Civil y Ambiental
Centro de Investigaciones en Acueductos y Alcantarillados – CIACUA
Medición y Evaluación de Resiliencia y Confiabilidad en Diseños Óptimos
de Drenaje Urbano
MIC 2022-10
Juana María Herrán Murcia
Tesis II
3
Investigaciones en Acueductos y Alcantarillados (CIACUA) y para la medición de resiliencia
y confiabilidad se utilizaron índices propuestos anteriormente en la literatura. La metodología
se probó en dos redes de alcantarillado utilizadas en la literatura. Asimismo, se utilizaron dos
ecuaciones de costo para modelar los costos de construcción de la red.
El trabajo se ha escrito para ser sometido a la revista “Urban Water Journal”. Para respetar
el código de ética de la revista, se ha preparado una versión resumida del artículo, la cuál se
presenta a continuación. En la versión resumida se han omitido algunas secciones y figuras
del artículo. No obstante, el trabajo completo se podrá encontrar en la revista o contactando
a los autores.

Universidad de los Andes
Departamento de Ingeniería Civil y Ambiental
Centro de Investigaciones en Acueductos y Alcantarillados – CIACUA
Medición y Evaluación de Resiliencia y Confiabilidad en Diseños Óptimos
de Drenaje Urbano
MIC 2022-10
Juana María Herrán Murcia
Tesis II
4
2 VERSIÓN RESUMIDA DEL ARTÍCULO
Measurement and evaluation of resilience and reliability in optimal sewer
networks designs
Juana Herrán
a
* and Juan Saldarriaga
a
a
Department of Civil and Environmental Engineering, Water Distribution and Sewerage
Systems Research Center, Universidad de los Andes, Bogotá, Colombia.
*correspondence: jm.herran10@uniandes.edu.co
1. Introduction
The sewer network design problem can be divided into two subproblems: the layout selection
and the hydraulic design. The layout selection establishes the three-structure of the network,
which indicates the flow rate and flow direction in pipes, and the hydraulic design determines
the diameters and invert elevations of pipes. The objective of the sewer network design
problem is to find the solution of the two subproblems that lead to the lowest cost design,
i.e., the optimal design. This is a complex task due to the immense number of feasible
solutions, and because of the presence of discrete variables, such as the diameter of pipes,
that depend on the commercially available list of diameters.

Universidad de los Andes
Departamento de Ingeniería Civil y Ambiental
Centro de Investigaciones en Acueductos y Alcantarillados – CIACUA
Medición y Evaluación de Resiliencia y Confiabilidad en Diseños Óptimos
de Drenaje Urbano
MIC 2022-10
Juana María Herrán Murcia
Tesis II
5
Due to the complexity of the problem, finding the optimal sewer network design has
become a challenge for the researchers of the field. Among the first authors to propose a
method to solve the problem were Li and Matthew (1990), who selected the layout of the
network with the searching direction method and used discrete Differential Dynamic
Programming (DDDP) for the hydraulic design. These authors also presented a sewer
network that has become a popular case study in the international literature. Another
approach was the proposed by Moeini and Afshar (2012, 2017, 2018) who intended using
ant algorithms combined with the Tree Growing Algorithm (TGA) and Nonlinear
Programming (NLP) for the layout selection and hydraulic design of sewer networks. Also,
Haghighi and Bakhshipour (2015) used the loop-by-loop cutting algorithm for the layout
selection and Tabu Search (TS) for the hydraulic design. Duque et al. (2020) used mixed-
integer programming (MIP) for the layout selection and Dynamic programming (DP).
Saldarriaga et al. (2021) included topographic criteria to the last methodology which
managed to obtain the lowest cost designs published in the literature for the Li and Matthew
network. Other studies that solve both subproblems of the sewer network design problem
include (Diogo and Graveto 2006; Haghighi and Bakhshipour 2012; Navin and Mathur 2016;
Steele et al. 2016; Alfaisal and Mays 2021).
Although it is important to minimize the cost of sewer networks, over the past years
new challenges that threaten the service of sewer systems have emerged, such as climate
change and urbanization. For this reason, incorporating concepts like reliability and
resilience is important to provide a better service in sewer networks.

Universidad de los Andes
Departamento de Ingeniería Civil y Ambiental
Centro de Investigaciones en Acueductos y Alcantarillados – CIACUA
Medición y Evaluación de Resiliencia y Confiabilidad en Diseños Óptimos
de Drenaje Urbano
MIC 2022-10
Juana María Herrán Murcia
Tesis II
6
The reliability and resilience are two concepts that have positive correlation but are
not the same. Alternatives that give the greatest resilience do not necessarily provide the
greatest reliability (Asefa et al. 2014, as cited in Sweetapple, Fu, and Butler 2017). According
to Butler et al. (2014), the reliability is defined as “the degree to which the system minimizes
level of service failure frequency over its design life when subject to standard loading”, while
the resilience is defined by the US National Infrastructure Advisory Council (NIAC) (2009)
as “the ability to reduce the magnitude and/or duration of disruptive events.”
The reliability of sewer networks has been studied in previous works. For example
Mista-Kruk (2016) analysed the reliability related to elements of pressure, vacuum and
gravity systems based on data. Tee et al. (2014) estimated the reliability with respect to
corrosion in pipes. Haghighi and Bakhshipour (2016) proposed a reliability index, this study
is different from the others because the proposed index is meant to be consider in the design
of the network. As for the resilience, many works have proposed indices to measure this
concept, most of them using flooding volume (Lee and Kim 2017; Lee, Choi, and Kim 2019;
Chen and Leandro 2019; Mugume et al. 2015). From these indices, the proposed by Mugume
et al. stands out for its simplicity and easy implementation in any sewer network.
The present work proposes an approach to evaluate resilience, reliability, and cost in
sewer networks designs obtained with an optimal design methodology. The approach aims
to be a tool for finding minimum cost designs with high resilience and reliability. It also seeks
to allow the analysis of the relationship between these three aspects in sewer networks. The
proposed methodology was applied in two sewer networks that have been used before in the
Universidad de los Andes
Departamento de Ingeniería Civil y Ambiental
Centro de Investigaciones en Acueductos y Alcantarillados – CIACUA
Medición y Evaluación de Resiliencia y Confiabilidad en Diseños Óptimos
de Drenaje Urbano
MIC 2022-10
Juana María Herrán Murcia
Tesis II
7
literature to test sewer network design methodologies. The methodology was also tested
using two cost functions from the literature.
2. Methods
2.1.First approach: multiobjective optimization
The first approach proposed to evaluate cost and reliability in sewer networks was a
multiobjective optimization model that sought to minimize cost and maximize reliability. For
this purpose, the Non-Inferior Set Estimation (NISE) algorithm proposed by Medrano and
Church (2015) was used. NISE consists of obtaining a single objective function from the
weighting of the objective functions of interest. Such weighting is performed through
Equation (1), where
𝑧
𝑐
is the new objective function,
𝑧
1
is objective function 1 (minimize
cost),
𝑧
2
is objective function 2 (maximize reliability), and α is the weight.
𝑧
𝑐
= 𝛼 ∗ 𝑧
1
+ (1 − 𝛼) ∗ 𝑧
2
(1)
The NISE algorithm starts by assigning the value of 1 to α to find a solution that only
considers objective function 1, then α takes the value of 0 to find the solution that only
considers objective function 2. Subsequently, α is calculated with Equation (2) to find new
solutions iteratively until it is not possible to find solutions that have higher reliability and
lower cost than the existing ones. In Equation (2),
𝜎
𝑖
and
𝜎
𝑗
correspond to previous solutions.
𝛼 =
𝑧
2
(𝜎
𝑖
) − 𝑧
2
(𝜎
𝑗
)
(𝑧
2
(𝜎
𝑖
) − 𝑧
2
(𝜎
𝑗
)) + (𝑧
1
(𝜎
𝑗
) − 𝑧
1
(𝜎
𝑖
))
(2)

Universidad de los Andes
Departamento de Ingeniería Civil y Ambiental
Centro de Investigaciones en Acueductos y Alcantarillados – CIACUA
Medición y Evaluación de Resiliencia y Confiabilidad en Diseños Óptimos
de Drenaje Urbano
MIC 2022-10
Juana María Herrán Murcia
Tesis II
8
Using multiobjective optimization in sewer design is challenging because the
problem is divided into two subproblems. Given that the reliability index relies exclusively
on layout variables, the multiobjective methodology was applied in the layout selection
model (i.e., MIP model). Thus, the MIP objective function and the reliability index are the
objective functions to optimize in the multiobjective algorithm.
The multi-objective optimization produces a Pareto front, where each solution
corresponds to a different layout with its own MIP objective function and reliability. Because
the cost of the network is unknown in the layout, the optimal hydraulic design was calculated
for each layout that composes the Pareto front. In this way, the cost and reliability of various
designs of the same network were obtained.
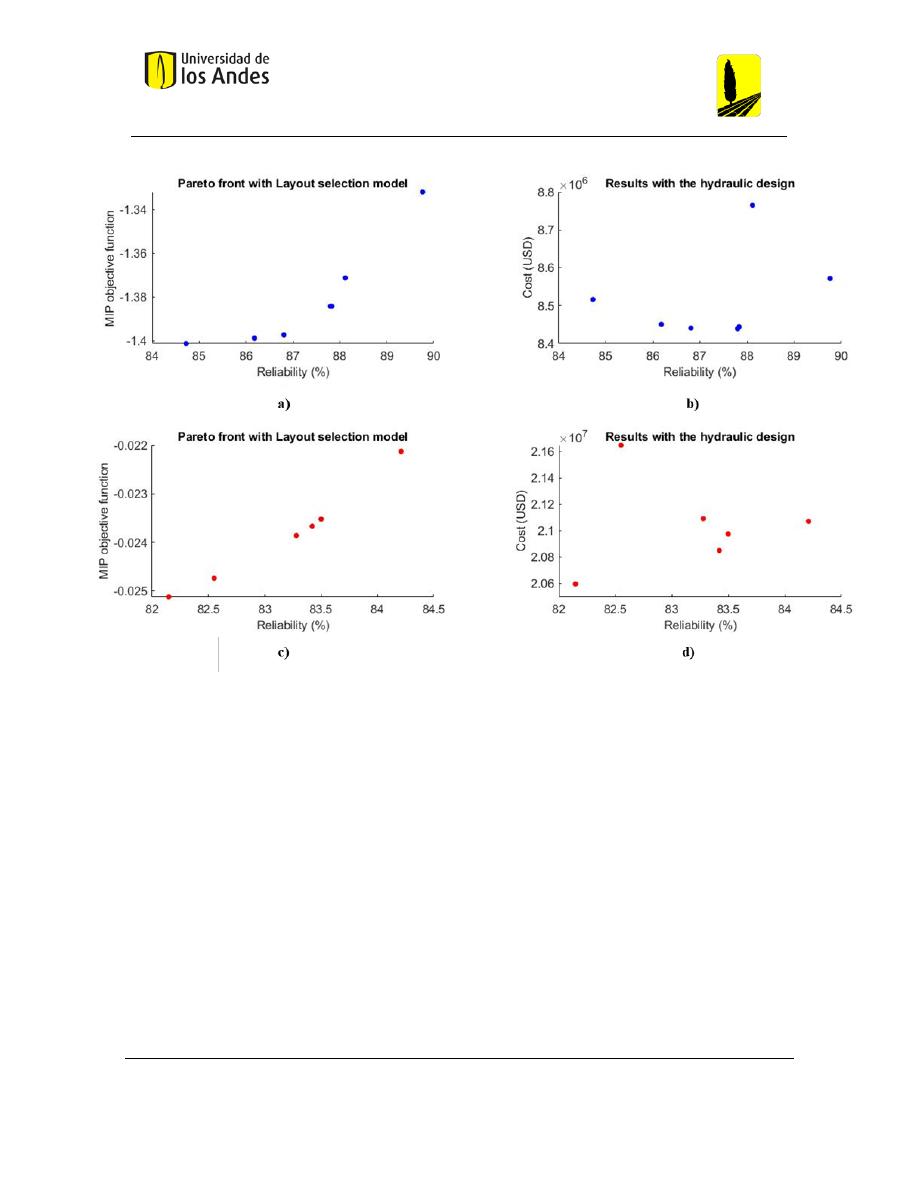
However, when the multiobjective optimization was performed, it was discovered
that the MIP objective function is not proportional to the network cost, i.e., layouts with a
low MIP objective function do not correspond to low-cost networks. As a result, when using
the first approximation, a Pareto front was obtained for the layout selection model, but no
relationship between network cost and reliability was discovered. In other words, the most
expensive designs were not necessarily the most reliable. Figure 1 shows the results obtained
using the first approximation, which show the aforementioned. The Chicó network's results
are shown in blue, while the Li and Matthew network's results are shown in red.
Universidad de los Andes
Departamento de Ingeniería Civil y Ambiental
Centro de Investigaciones en Acueductos y Alcantarillados – CIACUA
Medición y Evaluación de Resiliencia y Confiabilidad en Diseños Óptimos
de Drenaje Urbano
MIC 2022-10
Juana María Herrán Murcia
Tesis II
9
Figure 1. Results of the first approach. a) Pareto front of the layout selection and b) cost and reliability of the
designs of the Chicó network. c) Pareto front of the layout selection and d) cost and reliability of the
designs of the Li and Matthew’s network.
Based on the results of the first approach, it was determined that there is no trade-off
between the network's cost and reliability; that is, a network with higher reliability is not
necessarily more expensive. As a result, it was decided to develop a second approach in
which multi-objective optimization was not used, but instead, a reliability measurement on a
variety of designs for the same network was performed. The relationship between cost and
reliability was examined, and low-cost and high-reliability designs were sought without the

Universidad de los Andes
Departamento de Ingeniería Civil y Ambiental
Centro de Investigaciones en Acueductos y Alcantarillados – CIACUA
Medición y Evaluación de Resiliencia y Confiabilidad en Diseños Óptimos
de Drenaje Urbano
MIC 2022-10
Juana María Herrán Murcia
Tesis II
10
use of a multi-objective algorithm. Furthermore, the concept of resilience was included in
the analysis because it integrates reliability with the magnitude and/or duration of a failure
event.
2.2.Final approach: Evaluation of resilience and reliability in sewer networks
designs
The second approach was to evaluate the resilience and reliability of various low-cost sewer
network designs. New designs were obtained by modifying
𝑏
𝑖𝑗𝑡
in the objective function of
the layout selection.
Initially, the four designs corresponding to the iterations of the original methodology
of Saldarriaga et al. were made. From these, new designs were obtained by modifying the
parameter
𝑏
𝑖𝑗𝑡
. The modifications were made depending on how the parameter was originally
calculated. In the case of the designs found with criterion 1 or 2, the modification consisted
of changing the value of the penalty µ. In the case of criterion 3 and the fourth iteration, the
way in which the distance and excavation costs were calculated were modified, respectively.
When parameter
𝑏
𝑖𝑗𝑡
was changed, it was discovered that there was no relationship
between the magnitude of the change and the cost of the resulting design. Furthermore, it
was found that a design could be achieved many times using different modifications in
𝑏
𝑖𝑗𝑡
.
As a result, the value of the changes made in
𝑏
𝑖𝑗𝑡
was randomized until the desired number
of designs was obtained.
Moreover, we attempted to obtain a range of costs in the new designs in order to
investigate the relationship between cost, resilience, and reliability. To search for low-cost

Universidad de los Andes
Departamento de Ingeniería Civil y Ambiental
Centro de Investigaciones en Acueductos y Alcantarillados – CIACUA
Medición y Evaluación de Resiliencia y Confiabilidad en Diseños Óptimos
de Drenaje Urbano
MIC 2022-10
Juana María Herrán Murcia
Tesis II
11
designs, the designs of iterations with lower costs were used as a basis, and vice versa, to
search for high-cost designs, the designs of iterations with higher costs were used as a basis.
After obtaining the desired number of designs, the resilience calculation was
performed. To do this, the design was first modeled in SWMM. Then, the flood volume
obtained by clogging each of the inner-branch pipes of the network was calculated. Next, the
resilience of each pipe was calculated with the flood volume and inflow volume of the
network. Finally, the resilience of the network was calculated as the average of the resilience
of the inner-branch pipes. After that, reliability was calculated for these same designs using
the Haghighi and Bakhshipour index. The results were organized into two graphs, one of cost
vs. resilience and the other of cost vs. reliability.
3. Case studies
The methodology was tested in two sewer networks previously used in the literature as case
studies. The first one is labelled Chicó and is part of the real sewer network of Bogotá,
Colombia. This sewer network is composed of 109 manholes and 160 pipes, and it only has
one outfall with a total flow rate of 1.525 m
3
/s. The other sewer network is the one proposed
by Li and Matthew, which is composed of 57 manholes, 79 pipes, and one outfall with a total
flow rate of 0.338 m
3
/s.
The sewer network design methodology must comply with the required hydraulic
constraints to ensure proper operation of the network. In the present work, the constraints
proposed by Li and Matthew (1990) were used, which are presented in Table 1.
Table 1. Hydraulic constraints
Universidad de los Andes
Departamento de Ingeniería Civil y Ambiental
Centro de Investigaciones en Acueductos y Alcantarillados – CIACUA
Medición y Evaluación de Resiliencia y Confiabilidad en Diseños Óptimos
de Drenaje Urbano
MIC 2022-10
Juana María Herrán Murcia
Tesis II
12
Constraint
Value
Condition
Minimum diameter
0.2 m
Always
Maximum filling ratio
0.6
𝑑 ≤ 0.3 m
0.7
0.35 m ≤ 𝑑 ≤ 0.45 𝑚
0.75
0.5 m ≤ 𝑑 ≤ 0.9 𝑚
0.8
𝑑 ≥ 1 𝑚
Minimum velocity
0.7 m/s
𝑑 ≤ 0.5 m and Flow rate > 0.015 m
3
/𝑠
0.8 m s
⁄
𝑑 > 0.5 m and Flow rate > 0.015 m
3
/𝑠
Maximum velocity
5 m s
⁄
Always
Minimum gradient
0.003
Flow rate < 0.015 𝑚
3
/𝑠
Minimum depth
1 m
Always
The list of commercially available diameters used is: {0.2, 0.25, 0.3, 0.35, 0.38, 0.4,
0.45, 0.5, 0.53, 0.6, 0.7, 0.8, 0.9, 1.0, 1.05, 1.20, 1.35, 1.4, 1.5, 1.6, 1.8, 2, 2.2, 2.4} in meters,
and the material used for pipes was concrete with a Manning’s n equal to 0.014.
As for the equations to model the construction cost of the sewer networks, two
equations that have been previously used in the literature were implemented. One of them
was proposed by Maurer, Wolfram, and Anja (2010) and is presented in Equation (3), where
C is the construction cost of one pipe in U.S. dollars, d is the diameter of the pipe in meters,
L is the length of the pipe in meters, h is the average depth of the pipe in meters, and
𝑚
𝛼
,
𝑚
𝛽
,
𝑛
𝛼
, and
𝑛
𝛽
are constants defined by the authors. The values of these constants are in
Table 2.
𝐶 = ((𝑚
𝛼
𝑑 + 𝑛
𝛼
)ℎ + (𝑚
𝛽
𝑑 + 𝑛
𝛽
)) ∗ 𝐿
(3)
Table 2. Constants of the equation of Maurer, Wolfram, and Anja.
Constant
Value
Units
𝑚
𝛼
110
USD ∗ m
−3
𝑚
𝛽
1200
USD ∗ m
−2
𝑛
𝛼
127
USD ∗ m
−2

Universidad de los Andes
Departamento de Ingeniería Civil y Ambiental
Centro de Investigaciones en Acueductos y Alcantarillados – CIACUA
Medición y Evaluación de Resiliencia y Confiabilidad en Diseños Óptimos
de Drenaje Urbano
MIC 2022-10
Juana María Herrán Murcia
Tesis II
13
𝑛
𝛽
−35
USD ∗ m
−1
The other cost equation was proposed by Li and Matthew (1990) and is presented in
Equations (4), and (5) where
𝑓
𝑝
and
𝑓
𝑚
are the construction cost of a pipe and a manhole in
yuan, respectively; d is the diameter of the pipe in meters (the downstream pipe in the case
of Equation (5)), L is the length of the pipe in meters, and h is the depth in meters.
𝑓
𝑝
=
{
(4.27 + 93.59𝑑
2
+ 2.86𝑑ℎ + 2.39ℎ
2
)𝐿 𝑖𝑓 𝑑 ≤ 1 𝑚 𝑎𝑛𝑑 ℎ ≤ 3 𝑚
(36.47 + 88.96𝑑
2
+ 8.70𝑑ℎ + 1.78ℎ
2
)𝐿 𝑖𝑓 𝑑 ≤ 1 𝑚 𝑎𝑛𝑑 ℎ > 3 𝑚
(20.50 + 149.27𝑑
2
− 58.96𝑑ℎ + 17.75ℎ
2
)𝐿 𝑖𝑓 𝑑 > 1 𝑚 𝑎𝑛𝑑 ℎ ≤ 4 𝑚
(78.44 + 29.25𝑑
2
+ 31.80𝑑ℎ − 2.32ℎ
2
)𝐿 𝑖𝑓 𝑑 > 1 𝑚 𝑎𝑛𝑑 ℎ > 4 𝑚
}
(4)
𝑓
𝑚
=
{
136.67 + 166.19𝑑
2
+ 3.50𝑑ℎ + 16.22ℎ
2
𝑖𝑓 𝑑 ≤ 1 𝑚 𝑎𝑛𝑑 ℎ ≤ 3 𝑚
132.91 + 790.94𝑑
2
− 280.23𝑑ℎ + 34.97ℎ
2
𝑖𝑓 𝑑 ≤ 1 𝑚 𝑎𝑛𝑑 ℎ > 3 𝑚
209.74 + 57.53𝑑
2
+ 10.93𝑑ℎ + 19.88ℎ
2
𝑖𝑓 𝑑 > 1 𝑚 𝑎𝑛𝑑 ℎ ≤ 4 𝑚
210.66 − 113.04𝑑
2
+ 126.43𝑑ℎ − 0.60ℎ
2
𝑖𝑓 𝑑 > 1 𝑚 𝑎𝑛𝑑 ℎ > 4 𝑚
}
(5)
To resume, four scenarios were evaluated varying the sewer network and the cost function.
These scenarios are summarized in Table 3.
Table 3. Evaluated scenarios
Scenario
Sewer network
Cost function
1
Chicó
Maurer, Wolfram, and Anja
2
Chicó
Li and Matthew
3
Li and Matthew
Maurer, Wolfram, and Anja
4
Li and Matthew
Li and Matthew

Universidad de los Andes
Departamento de Ingeniería Civil y Ambiental
Centro de Investigaciones en Acueductos y Alcantarillados – CIACUA
Medición y Evaluación de Resiliencia y Confiabilidad en Diseños Óptimos
de Drenaje Urbano
MIC 2022-10
Juana María Herrán Murcia
Tesis II
14
4. Results
4.1. Scenario 1: Chicó network with the cost function of Maurer, Wolfram, and
Anja.
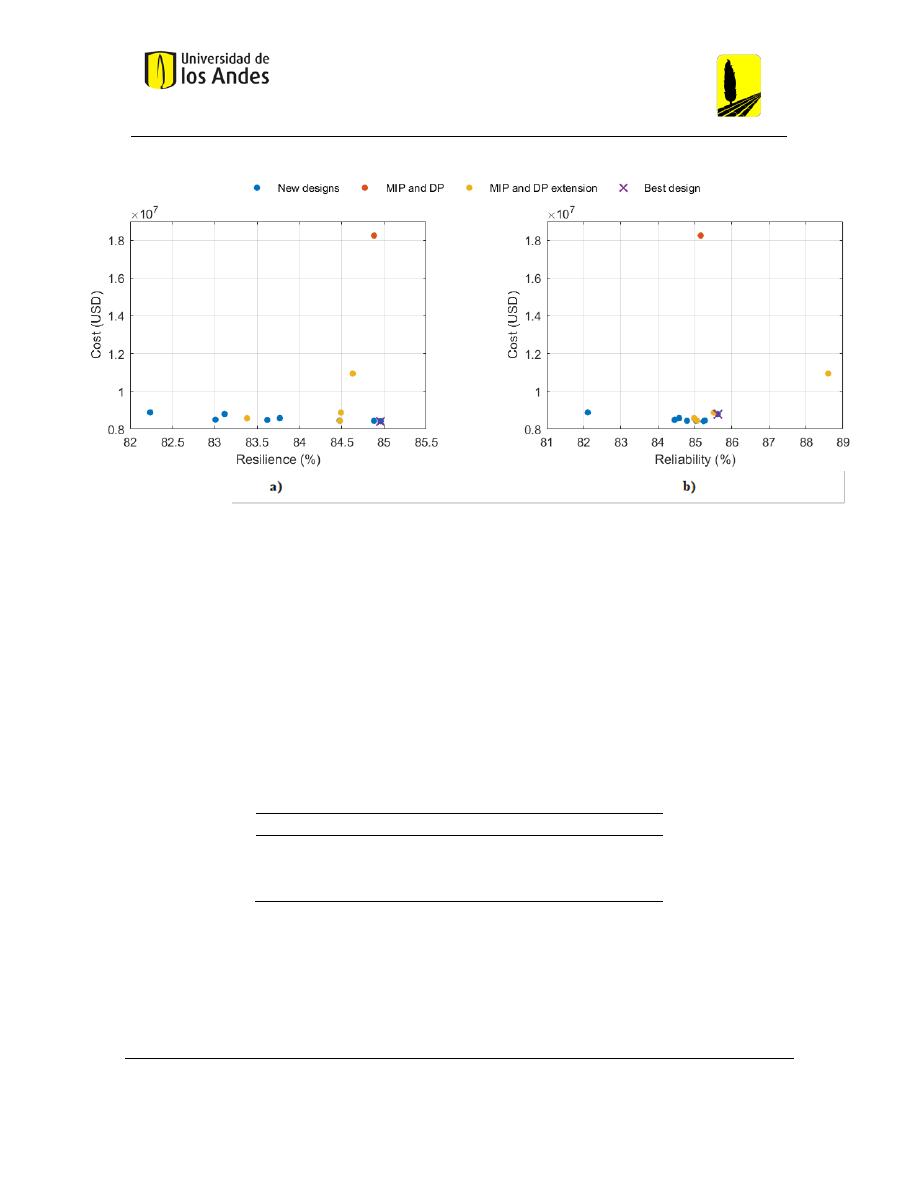
Figure 2 present the cost, resilience, and reliability of 15 designs of a sewer network. In this
figure, a) presents the cost against resilience of the designs, and b) presents the cost against
reliability of the same designs.
The design labelled as “MIP and DP” correspond to the design achieved with the
methodology of Duque et al. (2020). The 4 designs referenced as “MIP and DP extension”
correspond to the solution of the 4 iterations of the methodology proposed by Saldarriaga et
al. (2021). The remaining 10 designs correspond to those obtained with the strategies of the
present work.
Also, the design considered as the “Best design” is marked with an X. The best
designs are considered the ones with the lowest cost and highest resilience, or reliability.
Selecting which design is the best can be subjective. It depends on how much cost the
decision maker is willing to accept to increment the resilience or reliability. In the present
work, the best designs were chosen with the authors criterion to illustrate an example of how
the methodology can be useful to select designs with low cost and high resilience/ reliability.
Universidad de los Andes
Departamento de Ingeniería Civil y Ambiental
Centro de Investigaciones en Acueductos y Alcantarillados – CIACUA
Medición y Evaluación de Resiliencia y Confiabilidad en Diseños Óptimos
de Drenaje Urbano
MIC 2022-10
Juana María Herrán Murcia
Tesis II
15
Figure 2. Cost vs. a) resilience and b) reliability in near-optimal designs of the scenario 1.
Also, since from the first approach it was concluded that the reliability index used and the
cost did not have a positive correlation as expected, it was decided to analyse the correlation
coefficient between the cost, resilience, and reliability of the designs. Table 4 presents these
results for the case of the Chicó network and the cost function of Maurer, Wolfram, and Anja.
Table 4. Correlation matrix between the cost, resilience, and reliability of the scenario 1.
Cost
Resilience
Reliability
Cost
1
Resilience
0.285
1
Reliability
0.193
0.562
1
5. Conclusions
This paper proposes a methodology to evaluate the cost, resilience and reliability of sewer

Universidad de los Andes
Departamento de Ingeniería Civil y Ambiental
Centro de Investigaciones en Acueductos y Alcantarillados – CIACUA
Medición y Evaluación de Resiliencia y Confiabilidad en Diseños Óptimos
de Drenaje Urbano
MIC 2022-10
Juana María Herrán Murcia
Tesis II
16
network designs obtained with optimized design methodologies. The following conclusions
are presented based on the results obtained:
• Significantly more expensive designs have higher resilience but not necessarily
higher reliability. In contrast, when the cost difference between two designs is not
very large, the design with higher resilience is not necessarily the more expensive
one.
• The methodology allowed finding designs that were more resilient and less
expensive than those that had already been published. This shows that inexpensive
networks can be very resilient, in some cases even more than expensive designs.
• Although the correlation between resilience and reliability is positive, it is not very
high. Resilience is recommended over reliability if one must choose between the two
as a criterion to determine which design is better since this concept takes both
reliability and the magnitude of the failure event into account. Furthermore,
reliability is less sensitive to modifications in network design.
From the findings regarding the relationship between cost, resilience, and reliability in sewer
networks, it is suggested to use cost and resilience as criteria to determine which sewer
network design is preferable. It is also recommended for future studies to use an algorithm
that automates the process of finding new designs in order to take advantage of computer
resources to explore a larger number of designs.

Universidad de los Andes
Departamento de Ingeniería Civil y Ambiental
Centro de Investigaciones en Acueductos y Alcantarillados – CIACUA
Medición y Evaluación de Resiliencia y Confiabilidad en Diseños Óptimos
de Drenaje Urbano
MIC 2022-10
Juana María Herrán Murcia
Tesis II
17
References
Alfaisal, Faisal M., and Larry W. Mays. 2021. “Optimization Models for Layout and Pipe
Design for Storm Sewer Systems.” Water Resources Management 35 (14): 4841–54.
https://doi.org/10.1007/s11269-021-02958-5.
Asefa, Tirusew, John Clayton, Alison Adams, and Damann Anderson. 2014. “Performance
Evaluation of a Water Resources System under Varying Climatic Conditions:
Reliability, Resilience, Vulnerability and Beyond.” Journal of Hydrology 508: 53–65.
https://doi.org/10.1016/j.jhydrol.2013.10.043.
Butler, D., R. Farmani, G. Fu, S. Ward, K. Diao, and M. Astaraie-Imani. 2014. “A New
Approach to Urban Water Management: Safe and Sure.” Procedia Engineering 89:
347–54. https://doi.org/10.1016/j.proeng.2014.11.198.
Chen, Kai Feng, and Jorge Leandro. 2019. “A Conceptual Time-Varying Flood Resilience
Index for Urban Areas: Munich City.” Water (Switzerland) 11 (4).
https://doi.org/10.3390/w11040830.
Diogo, A. Freire, and Victor M. Graveto. 2006. “Optimal Layout of Sewer Systems: A
Deterministic versus a Stochastic Model.” Journal of Hydraulic Engineering 132 (9):
927–43. https://doi.org/10.1061/(asce)0733-9429(2006)132:9(927).
Duque, Natalia, Daniel Duque, Andrés Aguilar, and Juan Saldarriaga. 2020. “Sewer
Network Layout Selection and Hydraulic Design Using a Mathematical Optimization

Universidad de los Andes
Departamento de Ingeniería Civil y Ambiental
Centro de Investigaciones en Acueductos y Alcantarillados – CIACUA
Medición y Evaluación de Resiliencia y Confiabilidad en Diseños Óptimos
de Drenaje Urbano
MIC 2022-10
Juana María Herrán Murcia
Tesis II
18
Framework.” Water (Switzerland) 12 (12). https://doi.org/10.3390/w12123337.
Haghighi, Ali, and Amin E. Bakhshipour. 2016. “Reliability-Based Layout Design of
Sewage Collection Systems in Flat Areas.” Urban Water Journal 13 (8): 790–802.
https://doi.org/10.1080/1573062X.2015.1036085.
Haghighi, Ali, and Amin E Bakhshipour. 2012. “Optimization of Sewer Networks Using an
Adaptive Genetic Algorithm.” Water Resources Management 26 (12): 3441–56.
https://doi.org/10.1007/s11269-012-0084-3.
———. 2015. “Deterministic Integrated Optimization Model for Sewage Collection
Networks Using Tabu Search.” Journal of Water Resources Planning and
Management 141 (1): 4014045. https://doi.org/10.1061/(ASCE)WR.1943-
5452.0000435.
Lee, Eui Hoon, Young Hwan Choi, and Joong Hoon Kim. 2019. “Real-Time Integrated
Operation for Urban Streams with Centralized and Decentralized Reservoirs to
Improve System Resilience.” Water (Switzerland) 11 (1).
https://doi.org/10.3390/w11010069.
Lee, Eui Hoon, and Joong Hoon Kim. 2017. “Development of Resilience Index Based on
Flooding Damage in Urban Areas.” Water (Switzerland) 9 (6): 1–15.
https://doi.org/10.3390/w9060428.
Li, Guiyi, and Matthew Robert G. S. 1990. “New Approach for Optimization of Urban

Universidad de los Andes
Departamento de Ingeniería Civil y Ambiental
Centro de Investigaciones en Acueductos y Alcantarillados – CIACUA
Medición y Evaluación de Resiliencia y Confiabilidad en Diseños Óptimos
de Drenaje Urbano
MIC 2022-10
Juana María Herrán Murcia
Tesis II
19
Drainage Systems.” Journal of Environmental Engineering 116 (5): 927–44.
https://doi.org/10.1061/(ASCE)0733-9372(1990)116:5(927).
Maurer, Max, Martin Wolfram, and Herlyn Anja. 2010. “Factors Affecting Economies of
Scale in Combined Sewer Systems.” Water Science and Technology 62 (1): 36–41.
https://doi.org/10.2166/wst.2010.241.
Medrano, Fernando Antonio, and Richard Lee Church. 2015. “A Parallel Computing
Framework for Finding the Supported Solutions to a Biobjective Network
Optimization Problem.” Journal of Multi-Criteria Decision Analysis 22 (5–6): 244–
59. https://doi.org/10.1002/mcda.1541.
Miszta-Kruk, Katarzyna. 2016. “Reliability and Failure Rate Analysis of Pressure, Vacuum
and Gravity Sewer Systems Based on Operating Data.” Engineering Failure Analysis
61: 37–45. https://doi.org/10.1016/j.engfailanal.2015.07.034.
Moeini, R, and MH Afshar. 2012. “Layout and Size Optimization of Sanitary Sewer
Network Using Intelligent Ants.” Advances in Engineering Software 51: 49–62.
https://doi.org/https://doi.org/10.1016/j.advengsoft.2012.05.003.
———. 2017. “Arc Based Ant Colony Optimization Algorithm for Optimal Design of
Gravitational Sewer Networks.” Ain Shams Engineering Journal 8 (2): 207–23.
https://doi.org/https://doi.org/10.1016/j.asej.2016.03.003.
———. 2018. “Extension of the Hybrid Ant Colony Optimization Algorithm for Layout

Universidad de los Andes
Departamento de Ingeniería Civil y Ambiental
Centro de Investigaciones en Acueductos y Alcantarillados – CIACUA
Medición y Evaluación de Resiliencia y Confiabilidad en Diseños Óptimos
de Drenaje Urbano
MIC 2022-10
Juana María Herrán Murcia
Tesis II
20
and Size Optimization of Sewer Networks.” Journal of Environmental Informatics 33
(2): 68–81. https://doi.org/10.3808/jei.201700369.
Mugume, Seith N., Diego E. Gomez, Guangtao Fu, Raziyeh Farmani, and David Butler.
2015. “A Global Analysis Approach for Investigating Structural Resilience in Urban
Drainage Systems.” Water Research 81: 15–26.
https://doi.org/10.1016/j.watres.2015.05.030.
National Infrestructure Advisory Council. 2009. “Critical Infrastructure Resilience Final
Report and Recommendations.”
Navin, Praveen K, and Yogesh P Mathur. 2016. “Layout and Component Size Optimization
of Sewer Network Using Spanning Tree and Modified PSO Algorithm.” Water
Resources Management 30 (10): 3627–43. https://doi.org/10.1007/s11269-016-1378-
7.
Saldarriaga, Juan, Jesús Zambrano, Juana Herrán, and Pedro L. Iglesias-Rey. 2021. “Layout
Selection for an Optimal Sewer Network Design Based on Land Topography, Streets
Network Topology, and Inflows.” Water (Switzerland) 13 (18): 1–20.
https://doi.org/10.3390/w13182491.
Steele, Joshua C, Kurt Mahoney, Omer Karovic, and Larry W Mays. 2016. “Heuristic
Optimization Model for the Optimal Layout and Pipe Design of Sewer Systems.”
Water Resources Management 30 (5): 1605–20. https://doi.org/10.1007/s11269-015-

Universidad de los Andes
Departamento de Ingeniería Civil y Ambiental
Centro de Investigaciones en Acueductos y Alcantarillados – CIACUA
Medición y Evaluación de Resiliencia y Confiabilidad en Diseños Óptimos
de Drenaje Urbano
MIC 2022-10
Juana María Herrán Murcia
Tesis II
21
1191-8.
Sweetapple, Chris, Guangtao Fu, and David Butler. 2017. “Reliable, Robust, and Resilient
System Design Framework with Application to Wastewater-Treatment Plant Control.”
Journal of Environmental Engineering 143 (3): 04016086.
https://doi.org/10.1061/(asce)ee.1943-7870.0001171.
Tee, Kong Fah, Lutfor Rahman Khan, Hua Peng Chen, and Amir M. Alani. 2014.
“Reliability Based Life Cycle Cost Optimization for Underground Pipeline
Networks.” Tunnelling and Underground Space Technology 43: 32–40.
https://doi.org/10.1016/j.tust.2014.04.007.

Universidad de los Andes
Departamento de Ingeniería Civil y Ambiental
Centro de Investigaciones en Acueductos y Alcantarillados – CIACUA
Medición y Evaluación de Resiliencia y Confiabilidad en Diseños Óptimos
de Drenaje Urbano
MIC 2022-10
Juana María Herrán Murcia
Tesis II
22
3 REFERENCIAS
Butler, D., R. Farmani, G. Fu, S. Ward, K. Diao, and M. Astaraie-Imani. 2014. “A New
Approach to Urban Water Management: Safe and Sure.” Procedia Engineering 89:
347–54. https://doi.org/10.1016/j.proeng.2014.11.198.
Departamento Administrativo Nacional de Estadística (DANE). (2018). Servicios públicos.
Obtenido
de
https://dane.maps.arcgis.com/apps/MapSeries/index.html?appid=2749922ca5f8469
db9990986c02b1b93
National Infrestructure Advisory Council. 2009. “Critical Infrastructure Resilience Final
Report and Recommendations.”
Saldarriaga, J., Cuero, P., Montaño, L., Corrales, E., & Luna, D. (2014). Metodología de
selección de trazado de una red de drenaje urbano optimizada, usando el concepto
de
mínima
masa-longitud
transportada.
Obtenido
de
https://pavcowavin.com.co/metodologia-de-seleccion-del-trazado-de-una-red-de-
drenaje-urbano-optimizada
United Nations Children’s Fund (UNICEF) & World Health Organization. (2019). Progress
on household drinking water, sanitation and hygiene 2000-2017: Special focus on
inequalities. New York.
