
DEPARTMENT OF CIVIL AND ENVIRONMENTAL ENGINEERING
FACULTY OF ENGINEERING
Master's Thesis
January 2026
1
Hydrodynamic Cavitation for E. coli Inactivation:
Design and Validation of a Venturi Reactor for
Water Disinfection
María José Galindo, Juan Guillermo Saldarriaga
and Jaime Plazas-Tuttle
Department of Civil and Environmental Engineering, Universidad de los Andes, Bogotá, Colombia
Water Distribution and Sewerage Systems Research Center (CIACUA)
E-mails: m.galindoh@uniandes.edu.co,
jsaldarr@uniandes.edu.co
, jplazas@uniandes.edu.co
Abstract
This research presents the development and experimental evaluation of a laboratory-scale
Venturi reactor designed to induce hydrodynamic cavitation for water disinfection. The
geometric design of a single Venturi tube was validated through computational fluid dynamics
simulations using ANSYS Fluent, which confirmed a significant pressure drop and localized
velocity increase at the throat, enabling cavitation inception. Microbiological experiments
using Escherichia coli under recirculation conditions showed partial bacterial inactivation, with
reductions of up to 0.5 log units at low operating pressure. The results demonstrate that stable
hydrodynamic cavitation generated by a single Venturi can contribute to microbial decay
without the use of chemical disinfectants. However, the observed inactivation levels indicate
that further hydraulic optimization is required to enhance disinfection efficiency.
Keywords: Hydrodynamic cavitation, Venturi tube, water disinfection, Escherichia coli, CFD simulation.
1. Introduction
Water quality refers to the physical, chemical, biological, and microbiological characteristics that determine its suitability
for a specific purpose, such as human consumption. It is a key factor for human health and well-being. However, in recent
decades, global concern has grown regarding diseases linked to the consumption of contaminated water (Guzmán et al., 2016).
Among these, acute diarrheal diseases (ADDs) are one of the top public health concerns, as they affect a substantial portion of
the global population and are considered the second leading cause of death among children under five years old (MinSalud &
MinVivienda, 2022). According to the World Health Organization, diarrhea kills approximately 443,832 children under the age
of five and an additional 50,851 children between the ages of five and nine each year (WHO, 2024).
A substantial portion of these illnesses are caused by microbiological pathogens present in contaminated water, particularly
Escherichia coli (E. coli). This bacterium is commonly found in the intestinal tract of warm-blooded animals and humans,
where it is normally harmless. However, some strains can act as opportunistic pathogens, producing gastrointestinal infections
and other clinical complications (Rodríguez-Angeles, 2002). E. coli is also widely used as an indicator of fecal contamination
in the assessment of drinking water quality.
In Colombia, although epidemiological data on ADDs is limited, E. coli has been identified as a major contributor to
childhood morbidity. According to the 2022 National Report on Water Quality for Human Consumption, 20% of samples
collected in rural areas contained up to 10,000 colony forming units (CFU) of E. coli per 100 mL. Based on the World Health
Organization (WHO) risk classification for drinking water quality, which categorizes E. coli concentrations above 100 CFU/100
mL as high to very high health risk, this level is considered elevated risk (MinSalud & MinVivienda, 2022).

Hydrodynamic Cavitation for E. coli Inactivation: Design and Validation of a Venturi Reactor for Water Disinfection
M. Galindo,
J. Saldarriaga and J. Plazas-Tuttle
2
These findings reveal a critical need to strengthen water treatment systems in Colombia. While many developing countries
rely on centralized water treatment plants, these often face structural and operational challenges, such as insufficient distribution
infrastructure and system failures (Yadav et al., 2021). As a result, there is a growing need in exploring decentralized and low-
cost disinfection technologies, particularly rural or underserved communities
.
Safe drinking water must meet strict microbiological criteria and contain acceptable levels of organic matter and other
compounds. Chlorination is currently the most widely used water disinfection method in Colombia, due to its effectiveness and
affordability. Nevertheless, residual chlorine may react with natural organic matter present in the water, forming disinfection
by-products (DBPs) such as trihalomethanes (THMs) and chloroform, which are associated with carcinogenic risks and alter
the taste and odor of the water (Yadav et al., 2021). These limitations have led researchers to investigate alternative technologies
that can ensure safe drinking water without the use of chemicals (Sun et al., 2020; Jain et al., 2019; Badve et al., 2015).
A chemical free and understudied alternative disinfection technology is cavitation. This is a physical phenomenon in which
vapor-filled cavities or bubbles are formed in a liquid when local pressure drops below the liquid's vapor pressure. These
cavities then collapse violently when they move into a region of higher pressure, releasing significant energy in the form of
shockwaves, localized elevated temperatures (several thousand Kelvin), and high-speed microjets exceeding 100 m/s (Kosel et
al., 2017; Zupanc et al., 2019).
There are several types of cavitation, each generated by different mechanisms. Acoustic cavitation (AC) is induced by high-
frequency ultrasonic waves (Chen et al., 2011). Hydrodynamic cavitation (HC) occurs when a liquid passes through a
constriction that lowers static pressure and converts it to velocity (Wilcox, 2006). Optic cavitation (OC) is produced by pulsed
laser beams in liquid media (Tomita & Shima, 1990), and particle-induced cavitation (PC) results from the interaction of
energetic particles, such as protons, with liquids, as seen in bubble chambers (Shah et al., 1999). Among them, HC stands out
for its scalability, low energy requirement, and engineering simplicity, making it suitable for real-world water treatment
applications (Yadav et al., 2021). A typical HC system consists of a tank containing untreated water, a pump that propels the
liquid through a constriction device, and a recirculation loop to process the water multiple times. Common constriction devices
include orifices, vortex generators, and Venturi tubes. The Venturi tube is commonly used due to its ability to generate
controlled and sustained cavitation (Sun et al., 2020).
The Venturi tube features a converging section, a narrow throat, and a diverging section, enabling a controlled drop in
pressure followed by gradual recovery. If the geometry is properly proportioned, it allows for stable and reproducible cavitation
(Yadav et al., 2021). Studies have shown that Venturi reactors outperform other designs in maintaining cavitation intensity
under operational conditions (Tao et al., 2016; Čehovin et al., 2017). These reactors can be made from a variety of materials
including glass, ceramic, polymers, silicon, or steel. Material choice depends on operational conditions, fluid properties, cost,
and ease of manufacture (Bautista, 2022).
The microbial inactivation mechanism of HC is based on both physical and chemical processes. During bubble collapse,
effects such as shear forces, shockwaves, transient pressure spikes, high-speed microjets, and thermal gradients damage
microbial cell walls. In addition, oxidative radicals such as OH and H are formed, which contribute to further cellular
breakdown (Zupanc et al., 2019). E. coli, with its complex multilayered Gram-negative outer membrane composed of
lipopolysaccharides, proteins, and peptidoglycan, is particularly vulnerable to these aggressive conditions. Literature reports
on inactivation efficiencies ranging from 0.6 to >6 log, depending on flow conditions and reactor design (Jain et al., 2019; Jyoti
& Pandit, 2004).
This research focuses on the design and validation of a Venturi-based reactor capable of inducing hydrodynamic cavitation
for the partial inactivation of E. coli in a low-pressure, continuous-flow system. Specifically, the first objective is to design and
model a single Venturi reactor using computational fluid dynamics to ensure suitable hydraulic conditions for cavitation
inception, and the second objective is to experimentally assess its disinfection efficacy through microbiological testing under
recirculation conditions. The system was designed using computational simulations and experimentally validated through
microbiological testing to evaluate E. coli concentrations before and after the reactor. As a sustainable and chemical-free
alternative to chlorination, this technology offers a promising solution to improve microbial water quality, especially in contexts
with limited infrastructure.
2. Materials and methods
The present research was conducted in two main phases. The first involved the design of the Venturi reactor through
computational modeling, aiming to optimize its geometry and operating conditions to induce HC. The second phase consisted
of the experimental validation of the designed system through disinfection tests using a E. coli strain. This section describes
the methods used in each stage, including modeling criteria, simulations performed, prototype construction, microbiological
procedures, and the operating conditions evaluated.
2.1 Venturi Device Modeling

Hydrodynamic Cavitation for E. coli Inactivation: Design and Validation of a Venturi Reactor for Water Disinfection
M. Galindo,
J. Saldarriaga and J. Plazas-Tuttle
3
2.1.1 Cavitation Model
ANSYS Fluent a computational fluid dynamics (CFD) software was used for the computational modeling of the Venturi
reactor. It enables the simulation of flow behavior under complex hydraulic conditions. It also performs finite element analysis
(FEA), allowing the simulation of fluid behavior under various conditions. This tool was employed to analyze pressure
distribution, fluid acceleration, and critical parameters associated with the formation of hydrodynamic cavitation, and to
optimize the design of the proposed device.
ANSYS Fluent, by default, uses a model based on the Rayleigh–Plesset equations. The numerical method is based on the
following mass transfer rate equations from liquid to vapor, where the gas phase consists of spherical air bubbles (Li et al.,
2020).
The mass conservation equation is expressed as:
𝛿
𝛿𝑥
𝑖
(𝜌𝑢
𝑖
) = 0
(1)
Where ρ and u
i
represent fluid density and the average velocity vector, respectively. The Reynolds-averaged momentum
conservation equation is:
𝛿
𝛿𝑥
𝑗
(𝜌𝑢
𝑖
𝑢
𝑗
) = −
𝛿𝜌
𝛿𝑥
𝑖
+
𝛿𝜌
𝛿𝑥
𝑗
[µ
𝛿𝑢
𝛿𝑥
𝑗
+ 𝑅
𝑖𝑗
]
(2)
Where µ refers to the kinematic viscosity and Rij is the Reynolds stress tensor. The gas phase is tracked by solving a
continuity equation for the liquid-phase volume fraction:
𝛻(𝛼
𝑙
𝑢
𝑙
) =
1
𝜌
𝑙
(𝑚
𝑣𝑙
− 𝑚
𝑙𝑣
)
(3)
Where m
lv
is the mass transfer rate from liquid (l) to vapor (v), and m
vl
is the reverse. u
l
is the average velocity of the liquid
phase. The liquid fraction is calculated based in the next equation:
𝛼
𝑙
+ 𝛼
𝑣
= 1
(4)
The Schnerr and Sauer model (Schnerr et al., 2001) treats bubble flow as a homogeneous mixture of vapor and liquid.
It uses Rayleigh’s relation to describe bubble growth and collapse:
𝑅
𝐵
=
𝑑𝑅
𝐵
𝑑𝑡
= √
𝑝
𝑣
− 𝑝
∞
𝜌
𝑙
2
3
(5)
Where
𝑅
𝐵
is the bubble radius,
𝑝
𝑣
is vapor saturation pressure, and
𝑝
∞
is the local pressure. The vapor volume fraction is
defined as:
𝛼
𝑣
=
𝑛
𝐵
4
3
𝜋𝑅
𝐵
3
𝑛
𝐵
4
3
𝜋𝑅
𝐵
3
+ 1
(6)
Where
𝑛
𝐵
is the density of bubbles per unit volume of liquid. The vapor transport equation is expressed as:
𝛻(𝛼
𝑣
𝜌
𝑣
𝑢
𝑣
) = 𝑅
(7)
With the net phase change rate R defined by:
If
𝑝
𝑣
≥
𝑝
∞
, evaporation (cavitation) occurs:
𝑅
𝑒
=
𝜌
𝑣
𝜌
𝑙
𝜌
𝛼
𝑣
(1 − 𝛼
𝑣
)
3
𝑅
𝐵
√
𝑝
𝑣
− 𝑝
∞
𝜌
𝑙
2
3
(8)
If
𝑝
∞
≥
𝑝
𝑣
condensation occurs:

Hydrodynamic Cavitation for E. coli Inactivation: Design and Validation of a Venturi Reactor for Water Disinfection
M. Galindo,
J. Saldarriaga and J. Plazas-Tuttle
4
𝑅
𝑐
=
𝜌
𝑣
𝜌
𝑙
𝜌
𝛼
𝑣
(1 − 𝛼
𝑣
)
3
𝑅
𝐵
√
𝑝
∞
− 𝑝
𝑣
𝜌
𝑙
2
3
(9)
Where
𝜌 is the density of the fluid mixture. The vapor volume is dependent on the nucleation site density 𝑛
𝐵
, which is
assumed to be constant. The originally recommended value for
𝑛
𝐵
is 10⁻³/m³ (Kumar et al., 2020).
2.1.2 Turbulence Model
ANSYS Fluent uses the k-ω turbulence model. According to Li et al. (2020), this approach shows high agreement with
experimental data on phase distribution in liquid–gas flows. The model solves transport equations for turbulent kinetic energy
(
𝑘) and specific dissipation rate (𝜔) (Bautista, 2022):
𝜕
𝜕𝑥
(𝜌𝑘𝑢
𝑖
) =
𝜕
𝜕𝑥
𝑗
(𝛤
𝑘
𝜕𝑘
𝜕𝑥
𝑗
) + 𝐺
𝑘
− 𝑌
𝑘
+ 𝑆
𝑘
(10)
𝜕
𝜕𝑥
𝑖
(𝜌𝜔𝑢
𝑖
) =
𝜕
𝜕𝑥
𝑗
(𝛤
𝜔
𝜕𝜔
𝜕𝑥
𝑗
) + 𝐺
𝑊
− 𝑌
𝜔
+ 𝑆
𝜔
(11)
The term G is the production of turbulence due to mean velocity gradients.
𝑌 represents dissipation of 𝑘 and 𝜔 due to turbulence.
𝛤
𝑘
= 𝜇 +
𝜇
𝑡
𝜎
𝑘
(12)
𝛤
𝜔
= 𝜇 +
𝜇
𝑡
𝜎
𝜔
(13)
𝛤 refers to the effective diffusivity of both parameters.
𝜎 Are the turbulent Prandtl numbers.
𝜇
𝑡
Is the turbulent viscosity.
2.1.3 Physical Model of the Venturi Device
As previously discussed, microbial disinfection through HC depends on factors such as shockwaves, micro-jet velocity, and
bubble collapse conditions. All these phenomena are influenced by parameters like inlet pressure, the geometry of the
constriction area, and the available flow area
Orifice and Venturi configurations are the preferred constriction geometries for generating extreme cavitation conditions.
These systems differ in that cavities formed by orifices are transient, while those generated in Venturi devices tend to be more
stable (Carpenter et al., 2016).
It has been reported that the Venturi design overcomes several obstacles in cavitation generation compared to other devices
(Tao et al., 2016). However, its performance depends on the shape of the throat, which may be circular, elliptical, or rectangular,
as well as the design of the diverging section (Kuldeep & Saharan, 2016). The divergent section prevents premature collapse
of cavities and contributes to pressure recovery. The minimum pressure is reached at the throat, where bubbles begin to form.
The size of these bubbles depends on the throat opening area (Zhao et al., 2019). Therefore, proper selection of this area is
crucial to achieve optimal conditions for cavitation capable of generating pressure changes that allow rupture of the microbial
cell wall, as is the case with Gram-negative bacteria (Burzio et al., 2019).
In Venturi systems, when the throat is narrower relative to its length, more aggressive cavitation conditions are generated,
which favor the rupture of microbial cell structures. However, excessively increasing the size or length of the throat may cause
undesirable pressure losses, thereby reducing system efficiency. Therefore, it is essential to find a balance in the design. Certain
geometric proportions have been shown to maintain intense cavitation without compromising flow pressure (Yadav et al.,
2021). In this context, a moderate opening angle in the divergent section has been identified as ideal for keeping bubbles active
long enough before collapsing, thus maximizing the system’s microbicidal effect. Kuldeep & Saharan (2016) reported that a
divergent angle between 5.5° and 6.5° provides the best results for maximizing microorganism removal.
In designing a Venturi device, both the converging and diverging sections must adhere to geometric criteria that ensure an
efficient flow transition and promote cavitation generation. According to Lafuente and Cevallos (2018), the angles of the
converging section should be between 10° and 30°, as this range allows the flow to accelerate progressively without generating
excessive turbulence that could compromise system stability. This controlled acceleration is key to reaching the minimum
pressure in the throat. Similarly, Ayela et al. (2017) proposed a specific converging angle of 23.5° as part of an effective
configuration for microreactors, which falls within the recommended range by Lafuente and empirically validates its
Hydrodynamic Cavitation for E. coli Inactivation: Design and Validation of a Venturi Reactor for Water Disinfection
M. Galindo,
J. Saldarriaga and J. Plazas-Tuttle
5
applicability. Therefore, adopting a converging angle of approximately 23.5° is not only theoretically supported but has also
proven functional in real HC applications.
Considering the characteristics of the VP-135V-6TW pump, particularly the type of connection for both suction and
discharge (1 1/2" NPT). A Venturi tube was designed to match these dimensions. Based on the previously established geometric
criteria, specifically a converging angle between 10° and 30°, and a diverging angle between 5.5° and 6.5°, a transition was
defined from the 1 1/2-inch inlet diameter (≈38.1 mm) to a 1/2-inch throat (≈12.7 mm) to achieve optimal conditions for HC.
Moreover, due to constraints associated with the tube manufacturing process, it was necessary to limit the total length of the
Venturi to 25 cm. This length was proportionally distributed among the converging, throat, and diverging sections, respecting
the recommended angles to ensure an efficient and stable pressure gradient that would allow controlled cavitation generation.
Figure 1 shows the design created in Autodesk Fusion 3D:
Figure 1. Screenshots from de Autodesk Software A) Venturi device design with dimensions in cm. B) Side view C) Top internal view.
Based on the specifications of the VP-135V-6TW pump, particularly its average flow rate of 50 GPM and 1 1/2” NPT suction
and discharge connections. A working flow rate of 30 GPM (0.00189 m³/s) was selected for the design of the cavitation system.
This value was chosen as a representative operating point, allowing operation within the pump’s performance range without
overloading it, thus facilitating experimental control and hydraulic analysis.
Considering that the vapor pressure of water at the average temperature in Bogotá (19 °C) is 2,198.35 Pa, hydraulic analysis
was carried out using Bernoulli’s equation, focusing on velocity variation between two sections of the Venturi tube: the inlet
(diameter of 1.5” = 0.0381 m) and the throat (diameter of 0.5” = 0.0127 m). It was assumed that height differences between
sections were negligible and that there were no fittings causing minor losses, so the equation was reorganized as follows:
p
1
ρg
+
v
1
2
2g
+ z
1
=
p
2
ρg
+
v
2
2
2g
+ z
2
+ h
f
+ h
m
(14)
v
1
2
− v
2
2
2g
= (
p
2
− p
1
ρg
) + (z
2
− z
1
) + h
f
(15)
𝑄
1
= 𝑄
2
(16)
𝐴
1
𝑣
1
= 𝐴
2
𝑣
2
(17)
𝐴 =
𝜋 ∗ 𝑑
2
4
(18)

Hydrodynamic Cavitation for E. coli Inactivation: Design and Validation of a Venturi Reactor for Water Disinfection
M. Galindo,
J. Saldarriaga and J. Plazas-Tuttle
6
𝐴
1
=
𝜋 ∗ 0.0381
2
4
= 0.00114 𝑚
2
(19)
𝐴
2
=
𝜋 ∗ 0.0127
2
4
= 0.000127 𝑚
2
(20)
𝑣
1
=
𝑄
𝐴
=
0.00189
0.00114
= 1.66𝑚/𝑠
(21)
𝑣
2
=
𝑄
𝐴
=
0.00189
0.00012
= 14.88 𝑚/𝑠
(22)
Using these values in Bernoulli’s equation, the inlet pressure of the Venturi tube was calculated as 𝑃
1
= 111,051.67 Pa.
With this pressure and velocity, the cavitation number was calculated, a fundamental parameter to determine whether
conditions are adequate for HC formation:
𝜎 =
𝑃
1
− 𝑃
𝑣
0.5𝜌𝑣
𝑜
2
(23)
Where
𝑃
1
is the reference pressure,
𝑃
𝑣
is the vapor pressure, and
𝑣
𝑜
is the velocity at the constriction. Theoretically, the liquid
begins to form vapor when σ is less than 1.
𝜎 =
111051.67 − 2198.35285
0.5 ∗ 998.49 ∗ (14.88)
2
= 0.99
(24)
This value, close to 1, indicates that the fluid is in critical condition for cavitation formation, favoring bubble generation and
subsequent collapse, which is effective for microbial disinfection processes. The pressure differential generated falls within the
measurable range of the selected sensor (0 to 2300 PSI), allowing precise monitoring of the phenomenon.
2.1.4 Device Fabrication
Based on the functional design of the Venturi tube, whose primary objective is to control mass flow through the efficient
conversion between pressure and velocity, the choice of material is a key factor. Traditionally, polymethyl methacrylate
(PMMA), also known as acrylic or Perspex, has been used due to its high light transmission, which allows for visual observation
of cavitation dynamics. However, considering that both PMMA and PLA are plastic polymers, and that optical observation was
not essential in this case, PLA was selected as the manufacturing material. This choice was based on its availability, ease of 3D
printing, and mechanical properties suitable for the system's operating conditions. Furthermore, the Venturi design was adjusted
to follow geometric recommendations that ensure proper pressure drop and recovery to promote cavitation (Lafuente &
Cevallos, 2018).
For the fabrication of the model, it was decided to use 3D printing with transparent PLA filament and the highest possible
infill percentage. In the context of fused deposition modeling (FDM) 3D printing, infill refers to the density of material
deposited inside the printed part, expressed as a percentage. A higher infill percentage implies a more solid internal structure,
which significantly enhances the mechanical strength and rigidity of the final piece.
In this case, since the device would be subjected to high internal pressures, structural integrity was prioritized over total
transparency. Therefore, an infill close to 100% was chosen. This ensured a robust and functional body capable of withstanding
flow conditions without compromising performance.
Hydrodynamic Cavitation for E. coli Inactivation: Design and Validation of a Venturi Reactor for Water Disinfection
M. Galindo,
J. Saldarriaga and J. Plazas-Tuttle
7
2.1.5 CFD Model
The geometry of the Venturi tube was designed in Autodesk Fusion 360. The meshing process was then carried out using
ANSYS Fluent. The purpose of the mesh is to divide the geometry into multiple elements where the flow equations of the
model are applied. To ensure better element quality in the mesh structure, the high smoothing option was selected. This helps
avoid truncation errors in the solution of differential equations. The implemented mesh consists of 65,601 cells and 68,992
nodes. The average linear cell size in the mesh is approximately 0.24 mm.
Figure 2. Screenshots from ANSYS Fluent: Mesh for flow variable computation
To perform the numerical simulation of the flow, the solution methods were configured according to recommendations
like those proposed by Li et al. (2020), who emphasize the importance of using precise schemes in cavitation studies. The PISO
method was used for pressure-velocity coupling, as it provides greater stability in flows with abrupt transitions. In addition,
geometric (skewness) and neighbor corrections were applied to improve accuracy in zones with irregular mesh (ANSYS Inc.,
n.d.). The flow equations were solved using second-order schemes for the main variables, such as velocity, turbulent kinetic
energy, and specific dissipation rate, which improves numerical fidelity. The PRESTO! scheme was selected for pressure
interpolation, which is suitable for flows with significant pressure changes, as occurs during cavitation (ANSYS Inc., n.d.).
The simulation was initialized with zero velocities in all directions and moderate initial turbulence conditions, with a
turbulent kinetic energy of 0.0103 m²/s² and a specific dissipation rate of 1028 s⁻¹. A boundary condition at the inlet of the
system was set corresponding to a velocity of 1.66 m/s, previously calculated based on the design flow rate and the inlet area
of the Venturi tube. For the temporal advancement of the simulation, a fixed time step was selected using the user-specified
method. A total of 600-time steps were defined with a time step size of 0.0001 seconds, and a maximum of 5 iterations per time
step, to ensure the stability and accuracy of the transient model. This configuration allowed for detailed observation of the flow
of development.
2.2
Cultivation and Quantification of Bacteria
Before implementing the disinfection tests in the Venturi device, preliminary plating and microbial counting trials were
conducted to validate the microbial quantification methodology. These trials were essential to ensure the reliability of the results
obtained during the experimental disinfection phase.
In an initial stage, cultures were carried out on PDA (Potato Dextrose Agar) solid medium inoculated with yeasts. This
medium is widely used for culturing fungi and yeasts due to its high nutrient content derived from potato extract and dextrose,
which promotes rapid and visible colony growth (Maji, 2023). Yeasts were chosen as the initial biological model because of
their similarity in colony-forming unit (CFU) development compared to bacteria such as E. coli. Approximately four trials were
conducted, performing serial dilutions to achieve concentration ranges that allowed coherent and verifiable colony counts
within the statistically acceptable interval of 30–300 CFU per plate.
Once the plating and dilution procedure was standardized using yeasts, cultures were carried out using E.coli as the
indicator of microorganism due to its common use in disinfection and microbiological control studies. In every test the E. Coli
strain used was O157:H7. The medium employed was EMB (Eosin Methylene Blue Agar) which enables the selective growth
of Gram-negative bacteria and distinguishes E. coli by its characteristic green metallic sheen in colonies, because of lactose
fermentation. More extensive dilutions were performed to ensure that bacterial concentrations on the plates fell within an
appropriate range for counting.

Hydrodynamic Cavitation for E. coli Inactivation: Design and Validation of a Venturi Reactor for Water Disinfection
M. Galindo,
J. Saldarriaga and J. Plazas-Tuttle
8
E. coli quantification was carried out using the plate count method, with EMB selective medium and surface streaking.
This consisted of performing 1:10 serial dilutions and spreading 0.1 mL of each dilution on a plate; the plates were then
incubated until the colonies were visible and could be counted (Sánchez et al., 2017). The materials were first prepared: 12
sterile Petri dishes, including a margin for errors; sterile spreaders, blue pipette tips compatible with automatic micropipettes,
sterile Eppendorf tubes, and beakers with deionized water were also prepared.
The EMB culture medium was prepared in a 500 mL Erlenmeyer flask, dissolving 37.5 g/L as indicated by the
manufacturer. Since approximately 25 mL per plate was required, 300 mL were prepared to ensure a sufficient volume. The
medium was then sterilized in an autoclave at 121 °C for 40 minutes. Once sterilized, the work surface was disinfected with
70% ethanol, and all work was done under aseptic conditions near an open flame. While still liquid, the medium was carefully
poured into the Petri dishes. After solidifying, the plates were refrigerated for several hours until use.
To prepare the inoculum, decimal serial dilutions were made in Eppendorf tubes. In the first tube, 900 µL of sterile
deionized water and 100 µL of the E. coli stock culture were added, yielding a 10⁻¹ dilution. From there, further dilutions up to
10⁻⁶ were carried out, using 900 µL of sterile water and transferring 100 µL from the previous tube to the next, replacing the
pipette tip at each step to avoid cross-contamination. Based on preliminary trials, the 10⁻⁴, 10⁻⁵, and 10⁻⁶ dilutions were selected
for plating due to their suitable colony density. Each dilution was plated in duplicate or triplicate on EMB agar using a sterile
spreader, distributing 100 µL of sample per plate. The plates were then incubated at 37 °C for 24 hours. Afterwards, colony
counting was performed using a digital colony counter.
Bacterial concentration was calculated using the following formula:
𝐶𝐹𝑈
100µ𝑙
=
𝐴𝑣𝑒𝑟𝑎𝑔𝑒 𝑛𝑢𝑚𝑏𝑒𝑟 𝑜𝑓 𝑐𝑜𝑙𝑜𝑛𝑖𝑒𝑠
𝑉𝑜𝑙𝑢𝑚𝑒 𝑝𝑙𝑎𝑡𝑒𝑑 (𝑚𝐿)
∗ 𝐷𝑖𝑙𝑢𝑡𝑖𝑜𝑛 𝑓𝑎𝑐𝑡𝑜𝑟
(25)
This methodology made it possible to accurately estimate the initial microbial load of the water inoculated with E. coli
before cavitation treatment. After several adjustments to the methodology, including improvements in dilution technique,
incubation time control, and sterility conditions, consistent and reliable culture results were obtained for E. coli.
2.3
Cultivation and Quantification of Bacteria in disinfection experiments
After validating the microbiological quantification methodology, disinfection experiments were conducted using the
Venturi cavitation system under experimental conditions. The experiments were performed using tap water collected from the
municipal supply and subsequently inoculated with Escherichia coli following the culture and counting protocol established
during the preliminary phase
To evaluate the temporal evolution of bacterial concentration, samples were collected at 0, 30, and 60 minutes of
continuous operation. These times were selected considering the hydraulic behavior of the system. The experimental tank had
a total volume of 600 L and operated at a flow rate of 1.3 L/s, which resulted in a complete hydraulic recirculation approximately
every 7.7 minutes. Consequently, the samples collected at 30 and 60 minutes corresponded to approximately four and eight
complete recirculations of the tank volume through the Venturi device, respectively.
Microbiological analysis was performed using standardized serial dilutions, allowing the evolution of bacterial
concentration over time to be assessed and confirming the cumulative effect of hydrodynamic cavitation when operating with
a single Venturi. Once a consistent decrease in bacterial concentration was observed, the experimental protocol was extended
to include a longer operation period and untreated control samples. In this second stage, samples were collected at 0, 30, 60,
and 120 minutes. An untreated control (blank) was prepared from the same initial inoculated water and maintained under
identical conditions but without passing through the Venturi system. Aliquots from the control sample were taken at the same
time intervals and immediately stored under refrigeration to preserve the microbial state until analysis. In parallel, treated
samples were collected downstream of the Venturi device at the corresponding times and handled following the same storage
procedure. This approach allowed the effect of hydrodynamic cavitation to be isolated from natural microbial decay.
The experimental procedure using a single Venturi device was repeated three times to ensure reproducibility. In selected
experimental runs, additional physicochemical parameters were monitored to complement the microbiological analysis. Water
temperature and dissolved oxygen were measured in situ using multiparameter probes.
Hydrodynamic Cavitation for E. coli Inactivation: Design and Validation of a Venturi Reactor for Water Disinfection
M. Galindo,
J. Saldarriaga and J. Plazas-Tuttle
9
2.4 Experimental Setup
The experimental setup is designed as a closed recirculation system to induce HC, and it was based on the configuration
designed by Bautista (2022). It consists of a 600-liter tank that stores the water to be treated, a centrifugal pump model VP-
135V-6TW with an average flow rate of 30 GPM (equivalent to 0.00189 m³/s), and a Venturi device fabricated using 3D
printing with PLA material, which creates the necessary conditions for vapor cavity collapse in the low-pressure region.
The hydraulic network of the system is composed of 1½-inch PVC piping connecting all components, including a check
valve to ensure unidirectional fluid flow. The system also includes several strategically placed valves to control internal
pressures, allow sample collection upstream and downstream of the Venturi reactor, enable tank drainage in case of maintenance
or emergency, and facilitate safe operations under different testing configurations. Additionally, a bypass has been incorporated
to divert flow in the event of overpressure or unexpected blockages, minimizing the risk of damage to the system, especially to
the pump or the Venturi device. Inside the storage tank, a protection system is included to prevent dry operation or direct
damage to the pump due to turbulence or undesired cavitation.
To monitor operating conditions and evaluate the reproducibility of the tests, the setup includes flow meters and a
differential pressure gauge, which will make it possible to correlate the disinfection results with the hydrodynamic variables of
the process. Once the basic operation of the system with a single Venturi was experimentally validated, the effect of a different
hydraulic configuration was be evaluated by implementing the arrangement with two Venturi devices in series. It is expected
that the series configuration will increase the intensity of the cavitation disinfection treatment thus optimizing the system’s
performance for larger-scale applications
Figure 3. A) Experimental setup diagram. B) Experimental setup in the laboratory. C) Differential pressure sensors.
3. Results and discussion
3.1
CFD Modeling
To validate the hydrodynamic behavior of the Venturi device designed to promote cavitation for disinfection purposes, a
CFD analysis was carried out using ANSYS software. Fundamental results were obtained in terms of pressure distribution and
flow velocity along the conduit, which allow evaluating the feasibility of the design to induce cavitation.
Hydrodynamic Cavitation for E. coli Inactivation: Design and Validation of a Venturi Reactor for Water Disinfection
M. Galindo,
J. Saldarriaga and J. Plazas-Tuttle
10
Figure 4. Pressure changes results with distance in the Venturi
Figure 4 shows the pressure contour of the flow inside the Venturi tube. At the inlet zone, the fluid starts with a high
positive pressure, close to 53,152 Pa, represented in dark red color. As the fluid approaches the throat of the device, a drastic
pressure drop is evident, reaching extreme negative values of about -92,499 Pa, indicated deep blue. These values correspond
to relative pressure (gauge pressure), referenced to atmospheric pressure, which means that negative values indicate sub-
atmospheric conditions.
This distribution suggests that the system conditions generate an absolute pressure well below atmospheric, which strongly
favors cavitation. The presence of a wide pressure gradient confirms that the critical zone of the phenomenon occurs precisely
in the center of the throat, where the lowest pressure is concentrated. In the divergent section, although a slight recovery is
observed, the pressure remains in a negative range, indicating that the flow’s kinetic energy continues to dominate over static
pressure. This behavior confirms that the geometric design of the tube, together with the operating conditions, allows reaching
a hydrodynamic environment highly prone to cavitation, a key condition for the disinfection processes that are intended to be
induced in the system.
Figure 5. Velocity change results with distance in the Venturi
Complementarily, Figure 5 shows the velocity contour of the flow. At the inlet, the fluid presents moderate velocities (~1
to 5 m/s), represented by colors ranging from dark blue to green. As the flow narrows toward the throat, the velocity increases
significantly, reaching a maximum value close to 14 m/s, which is represented by an intense red coloration. This increase is a
direct consequence of the reduction in the cross-sectional area, according to the continuity equation and the principle of mass
conservation. Subsequently, in the divergent section, the velocity begins to decrease progressively as the cross-sectional area
increases, recovering part of the pressure previously lost. This velocity profile is consistent with the design and demonstrates a
correct implementation of the principles governing compressible or incompressible flows in convergent-divergent geometries.
The correlation between both variables pressure and velocity is key to evaluating the cavitation potential of the system.
The substantial increase in velocity at the throat is accompanied by a sharp pressure drop, which creates a hydrodynamic
environment conducive to cavitation. This phenomenon is essential for disinfection processes via HC, as the implosion of
bubbles produces zones of elevated temperature and localized pressure, capable of inactivating microorganisms through
Hydrodynamic Cavitation for E. coli Inactivation: Design and Validation of a Venturi Reactor for Water Disinfection
M. Galindo,
J. Saldarriaga and J. Plazas-Tuttle
11
physical and chemical mechanisms. The simulation demonstrates that the tube’s geometric design meets the functional
requirements to generate these conditions, confirming its feasibility as a cavitation reactor.
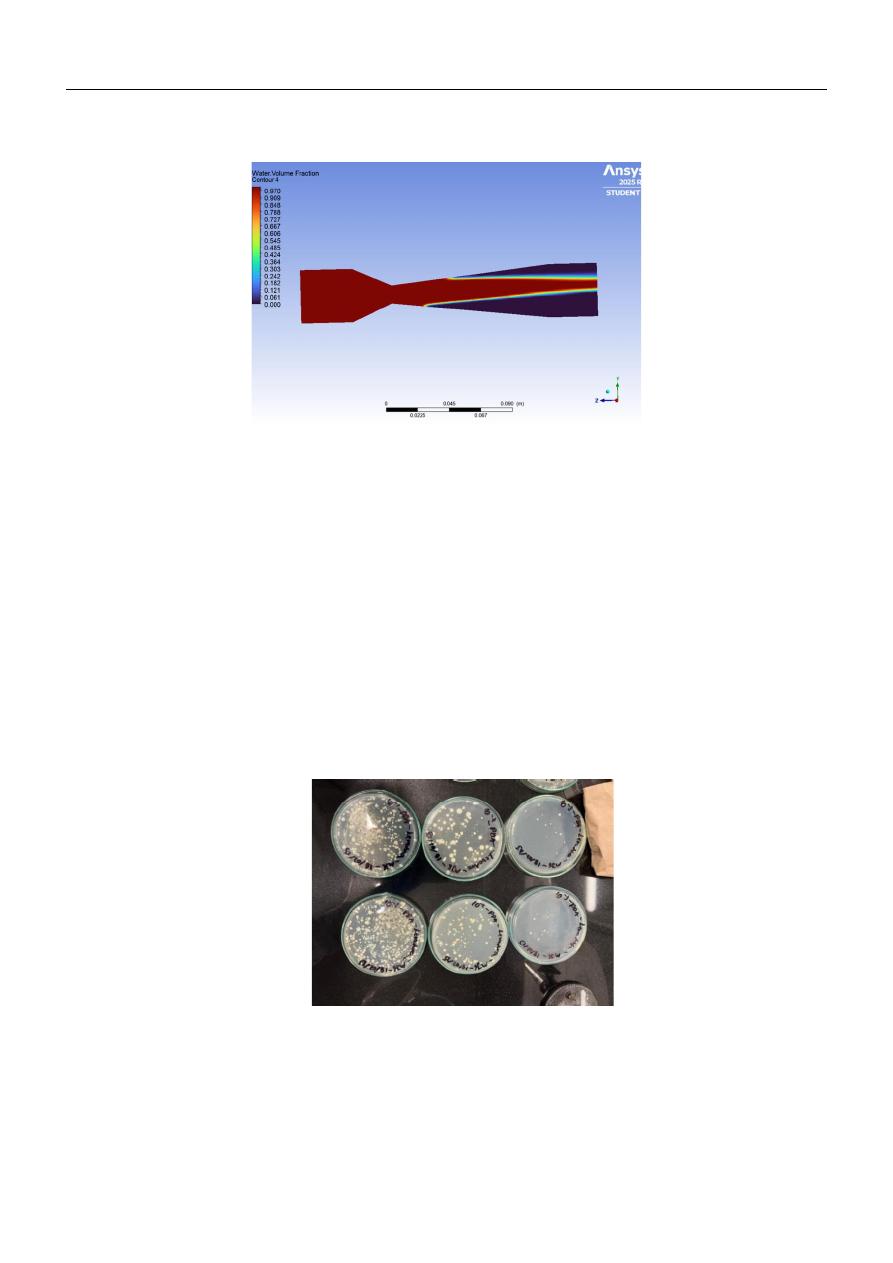
Figure 6. Water volume fraction
Figure 6 presents the contour of the water volume fraction along the Venturi tube. This parameter is key to identifying
cavitation formation, as a fraction lower than 1 indicates the presence of vapor or a biphasic mixture in the flow. It is observed
that in the inlet region and up to the proximity of the throat, the volume fraction is close to 0.97–1.00, indicating that the flow
remains mostly in the liquid phase (red color). However, upon reaching the zone of minimum pressure and maximum velocity,
a narrow and extended region appears, with colors from orange to blue, where the fraction drops sharply, reaching values close
to 0.000, indicating intense cavitation formation.
This cavitating channel extends along the divergent section, suggesting persistence of the vapor bubbles even after exiting
the throat. The tube geometry and the critical pressure drop previously observed support this formation, as the simulated
conditions allow pressures below the liquid vapor pressure to be reached. The off-centered and upward-tailed cavitation zone
can be explained by asymmetric pressure recovery in the divergent section and by buoyancy effects associated with the large
density difference between liquid and vapor phases, which promote preferential vapor persistence along the upper region of the
flow. Figure 6 visually confirms that the device generates a sustained cavitation zone, in line with the evaluated hydrodynamic
principles. This behavior is desirable in disinfection applications through cavitation since the persistence of bubbles and their
subsequent collapse contribute significantly to microbial inactivation through localized thermal and mechanical effects.
3.2
Microbiological quantification
Figure 7. Yeast plating results 10^-1, 10^-2, and 10^-3
In the microbial quantification tests, a wide range of counts was obtained for both yeasts and E. coli, with the results
expressed in colony-forming units per 100 µL (CFU/100 µL). In the case of yeasts, dilutions 10¹, 10², and 10³ showed the
following results:
Hydrodynamic Cavitation for E. coli Inactivation: Design and Validation of a Venturi Reactor for Water Disinfection
M. Galindo,
J. Saldarriaga and J. Plazas-Tuttle
12
Table 1. Yeast quantification results
Dilution
Plate 1
Plate 2
Average
CFU/100µL
10
299
284
291.5
29150
100
20
24
22
22000
1000
0
2
1
10000
In the second repetition, 275, 108.5, and 21.5 colonies were obtained for the same dilutions, with results equivalent to
27,500; 10,850; and 21,500 CFU/100 µL. These values show acceptable experimental consistency between repetitions and
validate the dilution method used, with counts within the optimal quantification range (20 to 300 colonies) in most cases.
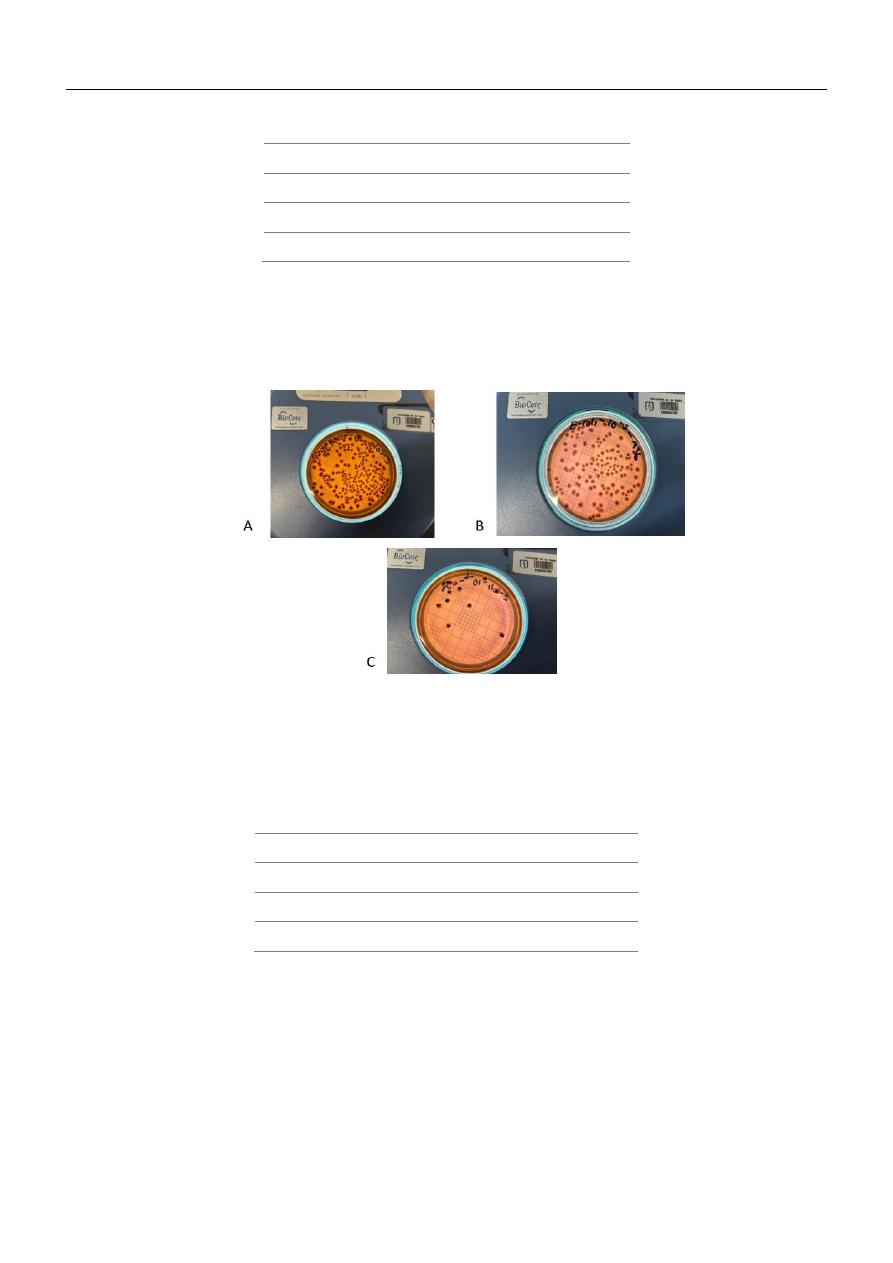
Figure 8. Plating results of E. coli dilution A) 10^-4. B) 10^-5. C) 10^-6.
For E. coli, the cultures showed a higher bacterial concentration. In the first series, dilutions 10⁵, 10⁶, and 10⁷ showed
averages of 312, 39.3, and 6 colonies, corresponding to 31,200,000; 3,933,333; and 600,000 CFU/100 µL, respectively. Finally,
a series of more concentrated dilutions (10⁴, 10⁵, and 10⁶) showed the following results:
Table 2. E. coli preliminary quantification results
Dilution
Plate 1
Plate 2
Average
CFU/100µL
10000
207
225
216
21600000
100000
91
69
80
80000000
1000000
13
18
15.5
1.55E+08
In all cases, the standard plating volume of 100 µL was respected, and the results are consistent with the expected logarithmic
progression in serial dilutions. It is noteworthy that E. coli data reflect a significantly higher bacterial load than yeasts, which
was especially evident in the first dilutions where counts exceeded 300 colonies per plate, outside the ideal range, but were
adequately corrected through subsequent dilutions. The applied methodology allowed a reliable estimation of microbial
concentration, with good reproducibility between repetitions and no evidence of contamination on the evaluated plates.
3.3
Microbiological tests using the Venturi Reactor
3.3.1
Summary of experimental tests
Hydrodynamic Cavitation for E. coli Inactivation: Design and Validation of a Venturi Reactor for Water Disinfection
M. Galindo,
J. Saldarriaga and J. Plazas-Tuttle
13
Experimental tests were conducted to evaluate the performance of hydrodynamic cavitation generated by a Venturi reactor
for the reduction of Escherichia coli concentrations in water. Prior to the microbiological assays, cavitation occurrence within
the Venturi device was experimentally verified under the selected hydraulic conditions.
The experimental program was organized into independent test blocks to assess the effect of exposure time on bacterial
inactivation under continuous recirculation. Bacterial concentrations were measured at 0, 30, 60, and 120 minutes and compared
with blank tests to distinguish the contribution of hydrodynamic cavitation from natural bacterial decay. Microbial
concentrations were quantified using plate count methods and expressed as CFU/mL, selecting the most reliable dilution for
each test. Dissolved oxygen and temperature were monitored in selected experiments to support the interpretation of cavitation-
related effects. This section presents a consolidated overview of the experimental tests performed, which are further analyzed
in the following sections.
Table 3. Summary of experimental blocks, Venturi configuration, and operational conditions.
Test
Venturi arrangement
Dilution used
Notes
1
One Venturi reactor
10
−3
Baseline single Venturi
test
2
One Venturi reactor
10
−3
Replicate test
3
One Venturi reactor
10
−3
Included OD and
temperature
3.3.2
Performance of a Single Venturi Configuration
The experimental results obtained for the single Venturi configuration showed a consistent decrease in bacterial
concentration over time for both blank and treated samples. Figure 9 presents the temporal evolution of E. coli concentration
for the untreated control (blank) and for the samples treated using the Venturi reactor. In all tests, time-dependent decay
processes were observed, which can be attributed not only to the natural decay of the bacterium but also to the potential lingering
presence of residual chlorine in tap water. However, the application of the Venturi reactor consistently resulted in lower
bacterial concentrations compared to the corresponding blank throughout the experimental period.
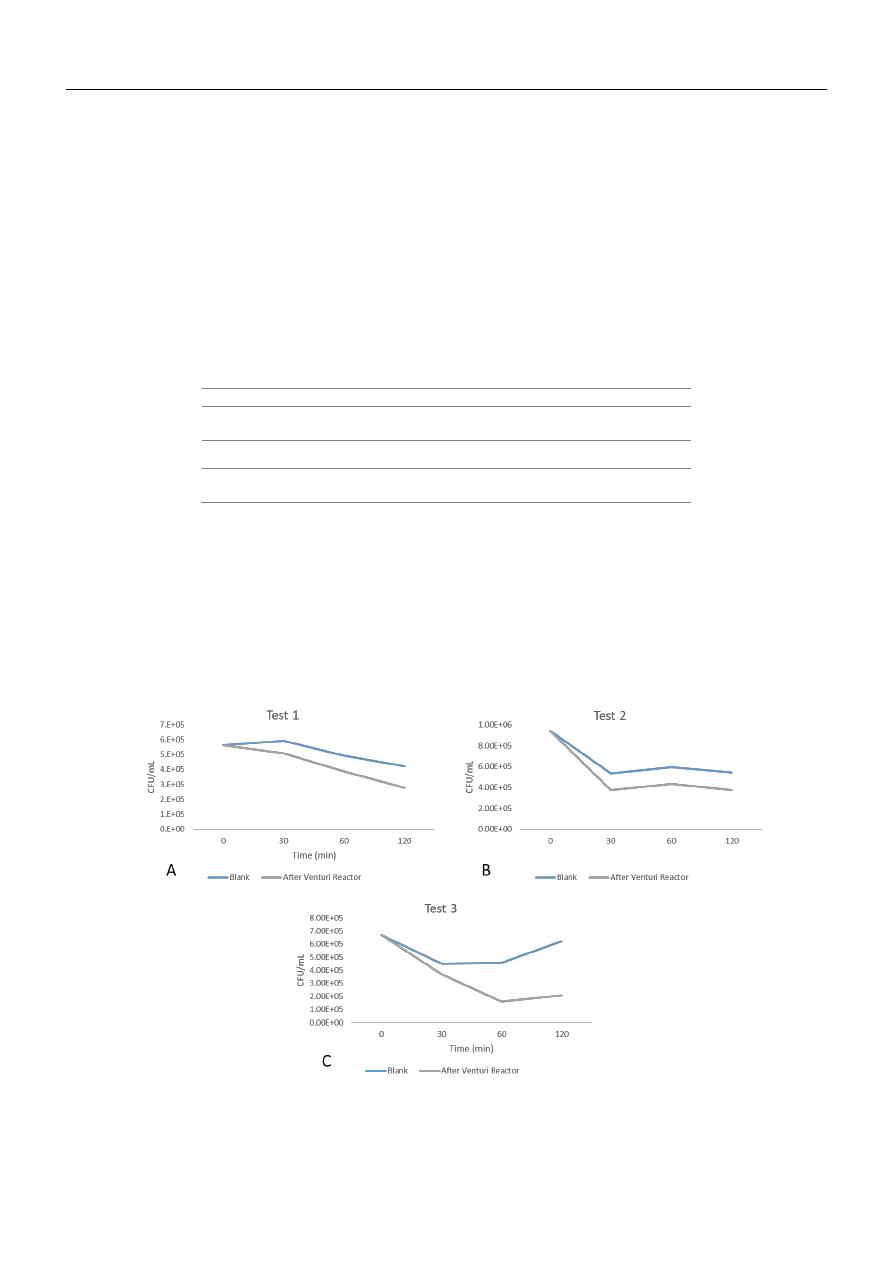
Figure 9. Concentration of E.Coli vs Time with a single Venturi.

Hydrodynamic Cavitation for E. coli Inactivation: Design and Validation of a Venturi Reactor for Water Disinfection
M. Galindo,
J. Saldarriaga and J. Plazas-Tuttle
14
In Test 1, both the blank and treated samples exhibited a gradual decrease in bacterial concentration over time. Nevertheless,
samples collected downstream of the Venturi reactor showed a consistently steeper decline. This behavior suggests that the
Venturi reactor enhances bacterial inactivation beyond natural decay mechanisms. The increasing separation between the
curves over time indicates a cumulative stress effect associated with the cavitation process. The maximum reduction observed
in this test was 50.89% (0.3 log reduction) when comparing initial and final concentrations, reflecting the combined influence
of natural decay and hydrodynamic cavitation.
Test 2 showed a marked initial reduction in bacterial concentration during the first 30 minutes for both the blank and treated
samples. This abrupt decrease suggests the presence of an early-stage inactivation mechanism, which may be associated with
mixing conditions or initial exposure to residual disinfectants. Following this initial drop, both curves exhibited partial
stabilization, with a slight increase in E. coli concentration over time. Despite this behavior, the Venturi-treated samples
maintained consistently lower concentrations throughout the two-hour test period. This indicates that, while the Venturi reactor
does not fully suppress short-term fluctuations or regrowth, it effectively limits their magnitude. The maximum reduction
achieved in this test was 60.42% (0.4 log reduction), reinforcing the reproducibility of the cavitation-assisted effect across
different experimental runs.
Test 3 presented the most pronounced difference between the blank and Venturi-treated samples. While both conditions showed
an initial reduction in bacterial concentration, the blank exhibited a clear increase in CFU/mL at longer times, indicating
bacterial regrowth or experimental variability. In contrast, the Venturi-treated samples maintained substantially lower
concentrations and a more stable temporal profile. The ability of the Venturi reactor to mitigate regrowth observed in the blank
suggests that cavitation-induced effects may cause damage that compromises bacterial recovery. This stabilizing effect is
particularly relevant from an engineering perspective, as it indicates that the reactor not only reduces bacterial concentration
but also limits rebound phenomena commonly observed in disinfection processes.
Table 4. Total bacterial reduction over time considering hydrodynamic cavitation with a single Venturi reactor.
Time(min)
Blank concentration (CFU/mL)
Concentration after the reactor (CFU/mL)
Total
reduction
(%)
Log
reduction
Test No.
1
2
3
1
2
3
0
5.63E+05
9.43E+05
6.70E+05
5.63E+05
9.43E+05
6.70E+05
0
0
30
5.93E+05
5.37E+05
4.50E+05
5.10E+05
3.73E+05
3.70E+05
14-30%
0.06-0.15
60
4.93E+05
5.97E+05
4.57E+05
3.87E+05
4.33E+05
1.60E+05
21-64%
0.1-0.45
120
4.23E+05
5.43E+05
6.20E+05
2.77E+05
3.73E+05
2.10E+05
31-66%
0.16-0.47
When compared to the blank tests, the treated samples exhibited a faster decay rate, however the removal efficiencies
attributable to the reactor are dependent on the experimental test and the sampling time, indicating partial inactivation rather
than complete disinfection. These results confirm that hydrodynamic cavitation acts as an intensification mechanism capable
of accelerating microbial decay processes due to bacterial stress rather than functioning as a standalone disinfection method.
3.3.3
Exploratory Results (Outside the Scope of This Thesis): Evaluation of a Sequential Venturi Configuration
Table 5.Total bacterial reduction over time considering hydrodynamic cavitation with a double Venturi configuration.
Time(min)
Blank concentration (CFU/mL)
Concentration after the reactors (CFU/mL)
Total
reduction
(%)
Log
reduction
Test No.
4
5
6
4
5
6
0
1.70E+07
1.65E+07
1.23E+06
1.70E+07
1.65E+07
1.23E+06
0
0
30
2.07E+07
1.22E+07
1.13E+06
2.21E+07
6.77E+06
9.67E+05
-6.59-
44%
-0.02-0.25
60
1.80E+07
1.47E+07
1.30E+06
1.19E+07
6.13E+06
2.97E+06
-128-58%
-0.35-0.37
120
2.27E+07
1.38E+07
9.67E+05
1.28E+07
7.70E+06
1.17E+06
-20-44%
-0.08-0.25

Hydrodynamic Cavitation for E. coli Inactivation: Design and Validation of a Venturi Reactor for Water Disinfection
M. Galindo,
J. Saldarriaga and J. Plazas-Tuttle
15
Table 5 summarizes the temporal evolution of E. coli concentration for the untreated control (blank) and for samples treated
using a sequential Venturi configuration during Tests 4, 5, and 6. These experiments were conducted as exploratory trials
outside the primary scope of this thesis, with the objective of preliminarily assessing whether a sequential arrangement of
Venturi reactors could enhance cavitation-assisted disinfection.
Overall, the results presented in the table indicate that bacterial reduction trends under the sequential Venturi configuration
were variable and strongly dependent on operational conditions. In Tests 4 and 5, reductions in bacterial concentration were
observed at intermediate exposure times, suggesting that cavitation-related effects were present, particularly during the early
stages of operation. However, these reductions were not consistently sustained over longer periods, and the total removal
efficiencies remained comparable to or lower than those obtained using a single Venturi reactor. Test 6 exhibited a distinct
response, characterized by greater temporal variability in bacterial concentration. In this case, treated samples showed limited
or inconsistent net reduction relative to the blank at certain time points. This behavior suggests that, under the specific hydraulic
conditions of the sequential configuration, cavitation intensity may have been insufficient or unevenly distributed, allowing
partial bacterial recovery or masking cavitation-induced effects. Importantly, this response does not invalidate the presence of
cavitation phenomena but rather highlights the sensitivity of bacterial inactivation to the hydraulic environment in which
cavitation is generated.
When considered collectively, the data from Tests 4, 5, and 6 indicate that the sequential installation of Venturi reactors without
intermediate spacing did not produce a reliable cumulative disinfection effect. The lack of consistent improvement is likely
associated with limited pressure recovery between devices, which may have constrained the ability of the downstream Venturi
reactor to reach the critical pressure drop required for effective cavitation. These exploratory findings emphasize the importance
of reactor configuration and hydraulic design in cavitation-based disinfection systems. While the concept of sequential
cavitation remains of interest, a detailed evaluation and optimization of multi-Venturi arrangements were beyond the scope of
this thesis. Consequently, the results presented here should be interpreted as preliminary observations intended to inform future
research rather than as definitive performance metrics.
3.3.4
Effect of Dissolved Oxygen and Temperature
Table 6.Dissolved Oxygen and Temperature Behavior during Cavitation Experiments.
Time/ Test No.
3
4
5
6
-
OD (mg/L)
T°
OD (mg/L)
T°
OD (mg/L)
T°
OD (mg/L)
T°
0
5.87
20.2
2.27
20.2
3.5
20.3
3.34
20.2
30
3.79
21.1
3.02
21.4
3.68
21.6
4.32
21.6
60
4.25
21.3
3.47
22.8
3.6
23.2
4.67
24
120
3.46
23.4
3.15
27.6
3.38
26.9
3.86
26.5
During the experiments, dissolved oxygen (DO) and temperature were monitored to evaluate additional effects associated
with the operation of the Venturi reactor and the hydraulic system. In all tests, temperature increased with time. After 120
minutes, temperature rises of approximately 3–7 °C, with the highest values recorded in Tests 4, 5, and 6, reaching temperatures
close to 27 °C. This increase is attributed not only to turbulence, pressure losses, and cavitation bubble collapse inside the
Venturi, but also to the continuous operation of the recirculation pump, which adds mechanical energy to the system and
contributes to heat generation.
Despite this increase, all measured temperatures remained within a moderate range and well below levels required to cause
thermal inactivation of microorganisms. Therefore, temperature did not play a direct role in bacterial removal, but it does
confirm sustained energy input and continuous hydraulic stress during the experiments.
Dissolved oxygen showed variable behavior over time. In several tests, DO decreased during the first 30 minutes, likely due
to the change of phase of oxygen due to cavitation, intense turbulence, and oxygen consumption by microorganisms. In other
cases, DO remained stable or slightly increased. Between 30 and 60 minutes, partial recovery of DO was observed in some
tests, which can be explained by enhanced gas–liquid mass transfer promoted by turbulence and a reduction in microbial activity
as bacterial concentrations decreased. At longer reaction times (120 minutes), DO values tended to stabilize or slightly decrease
again, indicating a balance between oxygen transfer and microbial consumption. Overall, no direct correlation was observed

Hydrodynamic Cavitation for E. coli Inactivation: Design and Validation of a Venturi Reactor for Water Disinfection
M. Galindo,
J. Saldarriaga and J. Plazas-Tuttle
16
between dissolved oxygen or temperature and bacterial removal efficiency. The observed microbial inactivation is therefore
mainly attributed to HC effects generated inside the Venturi reactor, rather than to changes in bulk temperature or dissolved
oxygen.
3.4
Study Limitations
Although the Venturi prototype showed promising results, several limitations of this study must be considered. The reduction
in E. coli concentration cannot be attributed exclusively to the hydrodynamic cavitation generated by the Venturi reactor, as
part of the observed decrease may be associated with the natural decay of bacteria in the recirculating tank over time and with
the general experimental conditions. Microbiological analyses also involve inherent sources of uncertainty. Errors related to
dilution preparation, sample handling, plating, incubation, and manual colony counting may affect the accuracy of the results,
particularly at high bacterial concentrations or under conditions where colony quantification becomes challenging.
The experimental evaluation was conducted using a single Venturi reactor under controlled laboratory conditions.
Exploratory tests performed with alternative reactor arrangements were not included in the main performance assessment, as
their detailed hydraulic optimization was beyond the scope of this thesis. Consequently, conclusions drawn in this work are
limited to the single Venturi configuration evaluated. Additionally, the Venturi tube was manufactured using 3D-printed PLA
material. While this material is appropriate for rapid laboratory prototyping, it exhibited limited mechanical resistance under
prolonged operation involving cavitation. After multiple experimental runs, the prototype failed, indicating that PLA is not
suitable for long-term or high-stress operation in cavitation-based systems.
Finally, all experiments were conducted at laboratory scale. Therefore, extrapolation of the observed disinfection
performance to full-scale or real-world applications should be approached with caution, as hydraulic conditions, operational
stability, and material durability may differ significantly at larger scales.
3.5
Comparison with previous studies
To contextualize the performance of the designed Venturi reactor, a comparative table was constructed including
representative studies that explore the use of hydrodynamic cavitation (HC) for microbial disinfection. The selected studies
encompass a range of reactor types, including Venturi tubes, vortex diodes, and orifice-based systems, and target different
microorganisms, primarily E. coli and Staphylococcus aureus. Table 7 summarizes key operational parameters such as reactor
configuration, operating pressure, exposure time, and reported microbial reduction, together with qualitative observations
relevant to system performance. This comparison highlights the diversity of HC-based disinfection approaches and provides a
reference framework for evaluating the technical feasibility and performance trends of the present study.
Table 7. Comparison with previous studies
Study
Reactor
type
Target
organism
Operating
pressure
(bar)
Exposure time
Reported
reduction
Key observations
Jain et al.,
2019
Vortex
diode /
Orifice
E. coli, S.
aureus
0.5–2 (vortex)
/ 2–10
(orifice)
Up to 60
minutes
~99% (2 log)
for E. coli
High efficiency with vortex
design; significantly lower
pressure compared to orifice.
Burzio et al.,
2019
Orifice (4 ×
2.5 mm)
E. coli
7.5
120–360
minutes
~ (99.99%) (4
log)
Recirculation system with thermal
control. Reproducible results at
lab scale.
Badve et al.,
2015
Venturi
Natural
marine
water
5
~15 minutes
~39–99% (0.6-
2 log)
Highly effective without
pretreatment, even in complex
water matrices.
Yadav et al.,
2021
Vortex
diode /
Orifice
E. coli, S.
aureus
0.5 (vortex) /
10 (orifice)
60 minutes
E. coli 70–
99% (0.8-2
log), S. aureus
60% (0.8 log)
Direct comparison between
devices. Consistent results.
Tao et al.,
2016
Venturi
E. coli
0.5–5
45–120 minutes
~ (99%) (2
log)
Geometry effect of the Venturi
evaluated.

Hydrodynamic Cavitation for E. coli Inactivation: Design and Validation of a Venturi Reactor for Water Disinfection
M. Galindo,
J. Saldarriaga and J. Plazas-Tuttle
17
Galindo et
al., 2025
(present
study)
Venturi
(3D-printed
PLA)
E. coli
~1
120 minutes
14-66% (0.06-
0.5 log)
Reactor designed via CFD
simulation; microbiological
validation under lab conditions.
Table 7 shows that previous studies have reported high disinfection efficiencies when HC systems operate under optimized
conditions, typically involving higher inlet pressures, extended exposure times, and reactor geometries specifically designed to
intensify cavitation. In several cases, reported microbial reductions exceed 90% (2–4 log), particularly in vortex-based devices
or orifice reactors operating at pressures well above those evaluated in this work. In contrast, the present study focused on
assessing the feasibility of microbial inactivation using a single Venturi reactor operating at relatively low pressure
(approximately 1 bar). The reactor geometry was designed through CFD simulations and fabricated using 3D-printed PLA,
prioritizing simplicity, low energy demand, and laboratory-scale validation. Under these conditions, partial E. coli inactivation
was observed, with reductions ranging from 14% to 66% (0.06–0.5 log reduction) over a 120-minute recirculation period.
Although these disinfection efficiencies are lower than those reported for high-pressure or highly optimized HC systems,
they are consistent with trends observed in other Venturi-based studies operating at comparable or moderate pressures, where
partial microbial inactivation has also been documented. Importantly, the results demonstrate that measurable cavitation-
assisted disinfection can be achieved even under low-pressure conditions, supporting the potential of Venturi-based HC as a
complementary or preliminary treatment approach rather than a standalone replacement for conventional disinfection
technologies.
4. Conclusions
The results obtained in this research allow concluding that the proposed Venturi device is capable of generating
hydrodynamic cavitation under the evaluated operating conditions. CFD modeling demonstrated a significant pressure drop at
the throat of the Venturi tube, reaching a minimum value of approximately −92,499 Pa, together with a simultaneous increase
in fluid velocity, with peak values close to 14 m/s. These results are consistent with the principles of mass and energy
conservation described by the continuity equation and Bernoulli’s equation, considering a flow rate of 0.00189 m³/s and a
progressive reduction in cross sectional area between the inlet and the throat. Furthermore, the analysis of the water volume
fraction revealed the formation of an extended biphasic mixture region downstream of the throat, confirming the occurrence of
cavitation and validating the use of the reactor for experimental disinfection studies without the need for complex or
multielement configurations.
The experimental trials conducted with Escherichia coli demonstrated that the designed single Venturi reactor generates
hydrodynamic cavitation capable of inducing measurable variations in microbial concentration during recirculation through the
system. Although complete inactivation was not achieved, the results indicate that cavitation contributes to bacterial stress and
partial inactivation, with reductions of up to approximately 60 percent when considering the combined effects of hydrodynamic
cavitation, natural bacterial decay, and the possible presence of residual chlorine in tap water. The variability observed between
experimental runs highlights the sensitivity of the process to operating conditions and reinforces the importance of hydraulic
stability and controlled operation.
Operational observations further emphasized the influence of system configuration and material selection on reactor
performance. The use of a single Venturi configuration enabled stable operation and a clear identification of cavitation related
hydraulic effects. However, limitations associated with the mechanical resistance of the three dimensional printed PLA material
were identified under prolonged cavitating conditions, leading to structural failure of the prototype. This finding indicates that,
while PLA is suitable for laboratory scale prototyping and proof of concept studies, alternative materials should be considered
for extended operation or higher cavitation intensities.
Exploratory tests conducted with alternative reactor arrangements provided additional insight into the role of hydraulic
configuration; however, these evaluations were outside the primary scope of this thesis. The results reinforced the observation
that cavitation performance is highly dependent on pressure recovery, flow distribution, and overall system robustness,
underscoring the need for careful hydraulic design in future studies. The microbiological methodology implemented in this
work proved to be consistent and reproducible. Standardized procedures for bacterial cultivation, serial dilution, and colony
quantification enabled reliable tracking of Escherichia coli concentrations throughout the experimental campaigns.
Nevertheless, inherent uncertainties associated with laboratory scale microbiological testing, such as manual handling, plating
variability, colony counting, and natural bacterial decay in control samples, must be acknowledged. These factors may affect

Hydrodynamic Cavitation for E. coli Inactivation: Design and Validation of a Venturi Reactor for Water Disinfection
M. Galindo,
J. Saldarriaga and J. Plazas-Tuttle
18
the precise attribution of bacterial reduction exclusively to cavitation and should be considered when interpreting disinfection
efficiency.
Overall, the findings of this study indicate that hydrodynamic cavitation generated using a Venturi based reactor represents
a promising complementary approach for water disinfection. The experimental evidence demonstrates that the system
contributes to a measurable reduction in Escherichia coli concentrations under low pressure conditions, supporting its potential
use as a pretreatment or auxiliary process alongside conventional disinfection methods such as chlorination. This approach is
particularly relevant in regions with limited water treatment infrastructure and high prevalence of waterborne diseases, where
simple, low cost, and robust technologies are critically needed. While further studies at larger scales and under real operating
conditions are required, the results obtained at laboratory scale support the feasibility of Venturi based hydrodynamic cavitation
as an accessible and sustainable tool for improving drinking water safety in vulnerable communities.
Future work should focus on improving reactor durability and hydraulic performance through material selection and
geometric optimization. Additional studies evaluating different water qualities, microorganisms, and operational conditions
would allow a more comprehensive understanding of cavitation assisted disinfection mechanisms. Scaling the system to pilot
level operation and assessing its integration with conventional treatment processes would further support the practical
application of this technology.
References
[1] Ayela, F., Cherief, W., Colombet, D., Ledoux, G., Martini, M., Mossaz, S., Podbevsek, D., Qiu, X., & Tillement, O. (2017).
Hydrodynamic Cavitation through “Labs on a Chip”: From Fundamentals to Applications. Oil & Gas Science And Technology – Revue
D’IFP Energies Nouvelles, 72(4), 19.
https://doi.org/10.2516/ogst/2017010
[2] ANSYS Inc. (n.d.). ANSYS FLUENT 12.0/12.1 pressure-velocity coupling. Recuperado el 12 de junio de 2025, de
https://www.afs.enea.it/project/neptunius/docs/fluent/html/th/node373.htm
[3] Badve, M. P., Bhagat, M. N., & Pandit, A. B. (2015). Microbial disinfection of seawater using hydrodynamic cavitation. Separation
And Purification Technology, 151, 31-38. https://doi.org/10.1016/j.seppur.2015.07.020
[4] Bautista, J. C. (2022). Inactivación de virus y degradación de compuestos orgánicos a través de cavitación hidrodinámica en
microrreactores. Universidad de los Andes.
[5] Brennen, Christopher. (2011). An Introduction to Cavitation Fundamentals.
[6] Burzio, E., Bersani, F., Caridi, G., Vesipa, R., Ridolfi, L., & Manes, C. (2019). Water disinfection by orifice-induced hydrodynamic
cavitation. Ultrasonics Sonochemistry, 60, 104740. https://doi.org/10.1016/j.ultsonch.2019.104740
[7] Carpenter, J., Badve, M., Rajoriya, S., George, S., Saharan, V. K., & Pandit, A. B. (2016). Hydrodynamic cavitation: an emerging
technology for the intensification of various chemical and physical processes in a chemical process industry. Reviews In Chemical
Engineering, 33(5).
https://doi.org/10.1515/revce-2016-0032
[8] Čehovin, M., Medic, A., Scheideler, J., Mielcke, J., Ried, A., Kompare, B., & Gotvajn, A. Ž. (2017). Hydrodynamic cavitation in
combination with the ozone, hydrogen peroxide and the UV-based advanced oxidation processes for the removal of natural organic
matter from drinking water. Ultrasonics Sonochemistry, 37, 394-404. https://doi.org/10.1016/j.ultsonch.2017.01.036
[9] Chen, D., Sharma, S. K., & Mudhoo, A. (2011). Handbook on Applications of Ultrasound. En CRC Press eBooks.
https://doi.org/10.1201/b11012
[10]
Guzmán, Nava & Bevilacqua (2016). Vigilancia de la calidad del agua para consumo humano en Colombia: desafíos para la salud
ambiental. Revista de la Escuela Nacional de Salud Pública, 34(2). https://doi.org/10.17533/udea.rfnsp.v34n2a06
[11]
Jain, P., Bhandari, V. M., Balapure, K., Jena, J., Ranade, V. V., & Killedar, D. J. (2019). Hydrodynamic cavitation using vortex
diode: An efficient approach for elimination of pathogenic bacteria from water. Journal Of Environmental Management, 242, 210-219.
https://doi.org/10.1016/j.jenvman.2019.04.057
[12]
Jyoti, K., & Pandit, A. (2004). Effect of cavitation on chemical disinfection efficiency. Water Research, 38(9), 2249-2258.
https://doi.org/10.1016/j.watres.2004.02.012
[13]
Kosel, J., Gutiérrez-Aguirre, I., Rački, N., Dreo, T., Ravnikar, M., & Dular, M. (2017). Efficient inactivation of MS-2 virus in
water by hydrodynamic cavitation. Water Research, 124, 465-471. https://doi.org/10.1016/j.watres.2017.07.077
[14]
Kuldeep, N., & Saharan, V. K. (2016). Computational study of different venturi and orifice type hydrodynamic cavitating devices.
Journal Of Hydrodynamics, 28(2), 293-305. https://doi.org/10.1016/s1001-6058(16)60631-5
[15]
Kumar, A., Ghobadian, A., & Nouri, J. M. (2020). Assessment of Cavitation Models for Compressible Flows Inside a Nozzle.
Fluids, 5(3), 134. https://doi.org/10.3390/fluids5030134
[16]
Lafuente & Cevallos. (2018). Desinfección bacteriana de aguas residuales utilizando cavitación hidrodinámica a través de un tubo
Venturi. Congreso de Ciencia y Tecnología ESPE, 13(1). https://doi.org/10.24133/cctespe.v13i1.808
[17]
Li, T., Liu, B., Zhou, J., Xi, W., Huai, X., & Zhang, H. (2020). A Comparative Study of Cavitation Characteristics of Nano-Fluid
and Deionized Water in Micro-Channels. Micromachines, 11(3), 310. https://doi.org/10.3390/mi11030310
[18]
Maji, P., Ghosh, A., Banik, A., & Raj, A. (2023). Comparison between Sabouraud Dextrose Agar (SDA) and Potato Dextrose Agar
(PDA) with Banana Peel (BP) for studying fungi in the air by settle-plate method. International Journal of Scientific Development and
Research (IJSDR), 8(7). https://doi.org/10.13140/RG.2.2.28639.23201

Hydrodynamic Cavitation for E. coli Inactivation: Design and Validation of a Venturi Reactor for Water Disinfection
M. Galindo,
J. Saldarriaga and J. Plazas-Tuttle
19
[19]
MinSalud & MinVivienda. (2022). Informe Nacional de Calidad del agua para Consumo humano. Gobierno de Colombia.
https://www.superservicios.gov.co/sites/default/files/inline-files/Informe-nacional-calidad-del-agua-para-consumo-humano-2022.pdf
[20]
Rodríguez-Angeles, G. (2002). Principales características y diagnóstico de los grupos patógenos de Escherichia coli. Instituto de
Diagnóstico y Referencia Epidemiológicos. México, D.F., México, 44, 464-475. https://www.adiveter.com/ftp_public/E.coli.pdf
[21]
Sánchez, P. F. E., R, D. N., Cruz, O. L. R., Torres, A. H. M., & Herrera, M. E. V. (2017). Simulación y Conteo de Unidades
Formadoras de Colonias. Revista Electrónica de Computación, Informática, Biomédica y Electrónica, 6(1), 97-111.
https://doaj.org/article/cc219aa0f5b44975abcd55581158dac8
[22]
Schnerr, G.H.; Sauer, J. Physical and numerical modelling of unsteady cavitation dynamics. In Proceedings of the 4th International
Conference on Multiphase Flow, New Orleans, LA, USA, 27 May–1 June 2001; Volume 1
[23]
Shah, Y., Pandit, A., Moholkar, V. (1999). Cavitation Reaction Engineering. Springer US, New York.
[24]
Sun, H., Qin, J., Yi, L., Ruan, Y., Sun, Y., Wang, J., & Fang, D. (2022). Study on negative pressure assisted hydrodynamic
cavitation (NPA-HC) degradation of methylene blue in dye wastewater. Process Safety And Environmental Protection, 181, 1-13.
https://doi.org/10.1016/j.cherd.2022.03.003
[25]
Sun, X., Liu, J., Ji, L., Wang, G., Zhao, S., Yoon, J. Y., & Chen, S. (2020). A review on hydrodynamic cavitation disinfection: The
current state of knowledge. The Science Of The Total Environment, 737, 139606.
https://doi.org/10.1016/j.scitotenv.2020.139606
[26]
Tao, Y., Cai, J., Huai, X., Liu, B., & Guo, Z. (2016). Application of Hydrodynamic Cavitation to Wastewater Treatment.
Chemical Engineering & Technology, 39(8), 1363-1376. https://doi.org/10.1002/ceat.201500362
[27]
Tomita, Y., Shima, A. (1990). High-speed photographic observations of laser-induced cavitation bubbles in water. Acta Acustica
United Acustica 71, 161–171
[28]
Volk, M., Molan, K., Šavli, D., Terlep, S., Levičnik-Höfferle, Š., Gašpirc, B., Lukač, M., Jezeršek, M., & Stopar, D. (2024). Biofilm
removal from Difficult-to-Reach places via secondary cavitation within a constrained geometry mimicking a Periodontal/Peri-Implant
pocket. Ultrasonics Sonochemistry, 104, 106832.
https://doi.org/10.1016/j.ultsonch.2024.106832
[29]
World Health Organization: WHO. (2024, March 7th). Diarrhoeal disease. https://www.who.int/news-room/fact-
sheets/detail/diarrhoeal-disease
[30]
Wilcox, D.C. (2006) Turbulence Modeling for CFD. 3rd Edition, DCW Industries, Canada, CA, USA.
[31]
Yadav, M., Sharma, J., Yadav, R. K., & Gole, V. L. (2021). Microbial disinfection of water using hydrodynamic cavitational
reactors. Journal Of Water Process Engineering, 41, 102097. https://doi.org/10.1016/j.jwpe.2021.102097
[32]
Zhao, L., Sun, L., Mo, Z., Du, M., Huang, J., Bao, J., Tang, J., & Xie, G. (2019). Effects of the divergent angle on bubble
transportation in a rectangular Venturi channel and its performance in producing fine bubbles. International Journal Of Multiphase Flow,
114, 192-206. https://doi.org/10.1016/j.ijmultiphaseflow.2019.02.003
[33]
Zupanc, M., Pandur, Ž., Perdih, T. S., Stopar, D., Petkovšek, M., & Dular, M. (2019). Effects of cavitation on different
microorganisms: The current understanding of the mechanisms taking place behind the phenomenon. A review and proposals for further
research. Ultrasonics Sonochemistry, 57, 147-165. https://doi.org/10.1016/j.ultsonch.2019.05.009
