External Abrasion Caused by Leakages in
Potable Water Distribution System Pipes
Daniela Rojas
1
; Kevin Vargas
2
; Andrés Cortés
3
; Sebastián Rocha
4
; Pablo París
5
;
Viviana Riveros
6
; and Juan Saldarriaga, M.ASCE
7
Abstract: External abrasion caused by leaks in pipe connections is a constant risk for water distribution systems (WDSs). Phenomena related
to pipe leakages may lead not only to flow losses and pressure drops in locations where they occur but also potential damage in buried pipes
due to soil fluidization. The aim of this paper is to demonstrate that pipe failures can be developed by this leakage phenomenon that causes
soil fluidization. Through experimental research using a model with pipes of various materials, the impact of a leak in the outer walls of a
buried pipe was simulated. Results showed that regardless of the material, size, or any other input variable, every pipeline is vulnerable
to external abrasion. A future improved model could be developed using water under pressure to perform simulations, which may lead to
further contributions. Results from this study suggest that improving materials should not be the only concern when designing water net-
works, and particular attention should be paid to enhance the quality of pipe connections.
DOI:
10.1061/(ASCE)PS.1949-1204.0000503
.
© 2020 American Society of Civil Engineers.
Introduction
Currently, for many water utilities the implementation of water
distribution systems (WDSs) includes not only the hydraulic and
construction cost analysis, but also the operational, maintenance,
and rehabilitation activities required throughout their life cycle.
The good performance of a WDS can be influenced by the selection
of pipe materials and their resistance to damage due to external fac-
tors. Deterioration of pipelines is related to the occurrence of chemi-
cal, biological, or laboratory phenomena that produce effects with
different degrees of severity depending on the response of each pipe
material. Some pipelines may end up in possible failures or even in
rupture, leading to the malfunction of the system and additional costs
for water authorities. Many numerical and experimental studies
analyze the effects of pipes that are exposed to aggressive environ-
ments, such as corrosion, extreme temperature, abrasion, and fatigue.
Internal abrasion in pipes is a thoroughly studied research topic
in urban drainage systems; pipeline failure can be caused by sedi-
ments transported in wastewater and stormwater that wear down the
inner surface of pipes. However, in WDSs, internal abrasion is rather
unusual because the transported water must ensure safe consump-
tion under established water quality standards (i.e., nonpresence of
sediment particles). Instead, scouring damage in potable water pipes
is mostly due to external abrasion. In the hydraulics of modern
WDSs, this has not been considered an important issue.
Different theories try to explain the reason for wear on the outer
walls of pipes. For instance, rodents were associated with the abra-
sion of pipes because orifices observed resembled this animal
’s at-
tack. Indeed, the National Sanitation Foundation (NSF) developed
a series of tests to determine the threat of rodents to PVC pipes. It
was noticed that rodents only attacked pipes when the pipes inter-
fered with their path to a food source and that there were no cases of
total penetration of pipes, as is usually seen in actual failure situa-
tions (
National Sanitation Foundation 1955
). Therefore, this idea
was rejected, and new theories were proposed to explain external
abrasion through other mechanisms associated with the structural
behavior and hydraulics of pipes.
The most widely accepted theory indicates that interactions be-
tween the leaky coupling of pressurized pipes and surrounding soil
might be considered as a main cause (
Majid et al. 2010
). The oc-
currence of leaks can be defined as the failure of a pipe, which is a
common problem that causes inefficient energy distribution and
low-pressure conditions throughout networks (
Alsaydalani 2017
).
Many researchers have focused on understanding the influence of
various factors in the behavior of leaks because it is important to
define the level of damage in pipes (breakages, deformation, or
deterioration). Some of the factors studied are associated with leak
hydraulics, pipe material and properties, and soil hydraulics. Exper-
imental tests have been carried out to analyze the performance of
leakage discharge and the pressure
–leakage relationship by includ-
ing different pipe materials, orifice sizes and shapes, and pressure
rates (
de Marchis et al. 2016
;
Alsaydalani 2017
). Nevertheless, the
models developed ignored the effects of the surrounding soil.
1
Research Assistant, Centro de Investigaciones en Acueductos y
Alcantarillados, Universidad de los Andes, Carrera 1 Este No. 19A-40,
Bogotá 110221, Colombia. Email: d.rojas1887@uniandes.edu.co
2
Research Assistant, Centro de Investigaciones en Acueductos y
Alcantarillados, Universidad de los Andes, Carrera 1 Este No. 19A-40,
Bogotá 110221, Colombia. Email: ka.vargas2130@uniandes.edu.co
3
Research Assistant, Centro de Investigaciones en Acueductos y
Alcantarillados, Universidad de los Andes, Carrera 1 Este No. 19A-40,
Bogotá 110221, Colombia. Email: af.cortes1548@uniandes.edu.co
4
Research Assistant, Centro de Investigaciones en Acueductos y
Alcantarillados, Universidad de los Andes, Carrera 1 Este No. 19A-40,
Bogotá 110221, Colombia. Email: js.rocha@uniandes.edu.co
5
Research Assistant, Centro de Investigaciones en Acueductos y
Alcantarillados, Universidad de los Andes, Carrera 1 Este No. 19A-40,
Bogotá 110221, Colombia. Email: pabloparis15@gmail.com
6
Research Assistant, Centro de Investigaciones en Acueductos y
Alcantarillados, Universidad de los Andes, Carrera 1 Este No. 19A-40,
Bogotá 110221, Colombia. Email: yv.riveros1521@uniandes.edu.co
7
Professor, Dept. of Civil and Environmental Engineering, Universidad
de los Andes, Carrera 1 Este No. 19A-40, Bogotá 110221, Colombia (cor-
responding
author).
ORCID:
https://orcid.org/0000-0003-1265-2949.
Email: jsaldarr@uniandes.edu.co
Note. This manuscript was submitted on December 19, 2019; approved
on June 15, 2020; published online on July 31, 2020. Discussion period
open until December 31, 2020; separate discussions must be submitted
for individual papers. This paper is part of the Journal of Pipeline Systems
Engineering and Practice, © ASCE, ISSN 1949-1190.
© ASCE
04020046-1
J. Pipeline Syst. Eng. Pract.
J. Pipeline Syst. Eng. Pract., 2020, 11(4): 04020046
Downloaded from ascelibrary.org by Universidad de los Andes on 03/08/22. Copyright ASCE. For personal use only; all rights reserved.
Hence, other research emphasize dealing with leakage modeling
in water distribution systems by considering the influence of soil
characteristics on the leakage discharges from pipes. Principally,
the interaction between leakages and the surrounding soil has been
studied extensively because erosional forms in pipes and in situ
fluidization are strongly related to the washing of soil particles pro-
duced by these discharges (
Mih and Kabir 1983
). This also may
lead to damage in the foundations of buildings and roads, which
impacts the safety of neighboring populations and increases costs
for water distribution companies.
Because of this potential damage, it has been necessary to ana-
lyze the effects of these events in terms of the structure and hydraul-
ics of both pipes and soil. A research project to analyze the effect of
the soil environment around leaking water pipes was carried out by
van Zyl et al. (
2013
) that emphasized the phenomenon of soil flu-
idization. It was found that extended fluidized and mobile zones are
inevitable and almost independent of orifice size. Similarly, Fox
et al. (
2016
) investigated the dynamics of leakage behavior consid-
ering the significance of soil conditions. In addition, Latifi et al.
(
2018
) showed through several experimental tests that the geotech-
nical properties of the soil around a pipe could influence the
amount of leakage discharge. Nonetheless, all these previous works
focused only on how the performance of leakages changes in re-
lation to the properties of the soil medium that covers the pipes, or
vice versa. In those tests, different types of openings were created to
simulate leakages, but few were designed to recreate the moment
when cracks appear and failure occurs in pipes.
Few studies have evaluated resistance to weariness in different
pipe materials and the structural effects caused by leaky couplings.
The most recent study performed tests on scouring outside of pipe
materials at leaking sites caused by soil fluidization (
Pike et al.
2018
). Five parameters were investigated in a sensitivity analysis,
and it was found that the leak jet orientation had the greatest impact
on the scouring rate. Other factors, such as the leakage flow rate,
sand particle size, pipe material, and cover depth, were also evalu-
ated with respect to how they impacted the increase in scouring
damage on tested pipes.
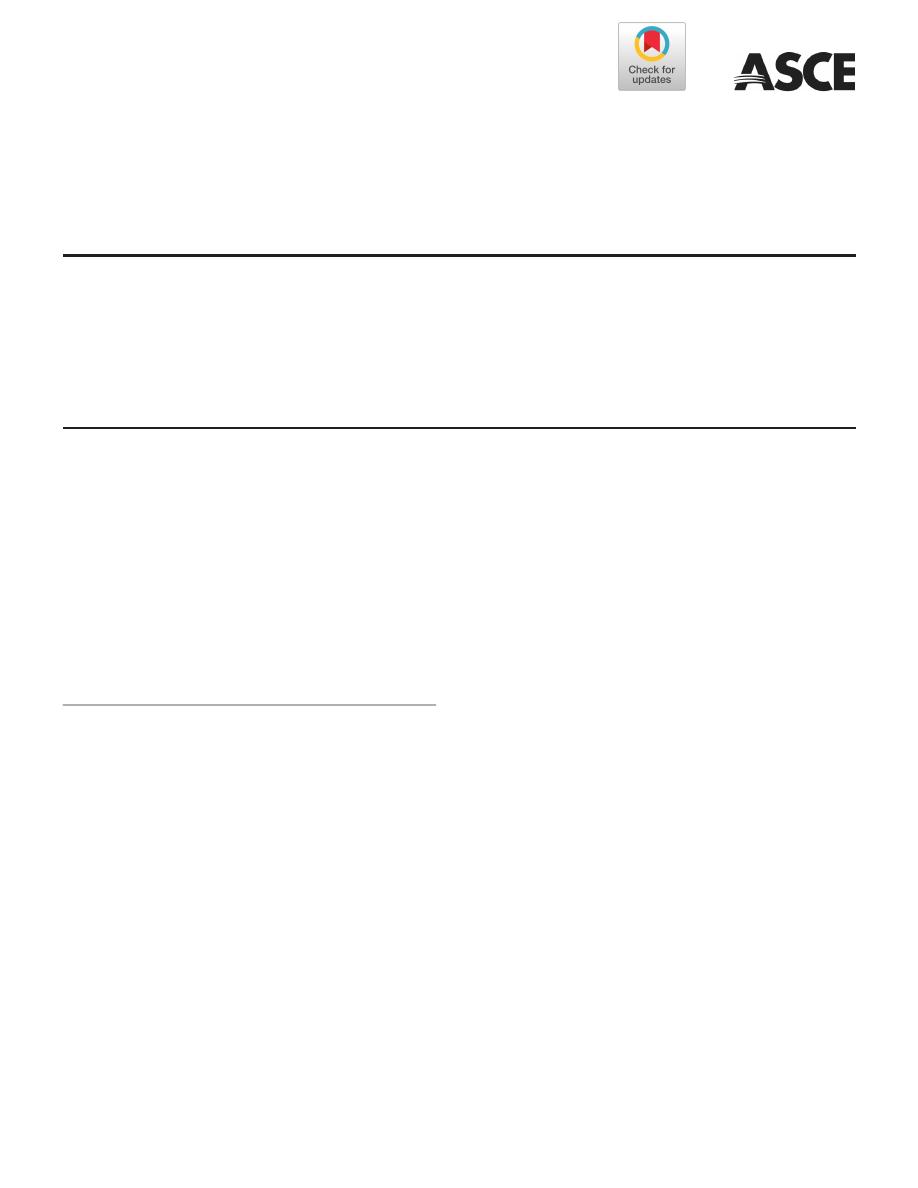
From the results of this research, it is possible to assert that a
main cause of external abrasion in pipes could be associated with
either leaky joints or defects in couplings between household fit-
tings and pipe mains that were not properly installed during the
construction of networks. Therefore, leaks are eventually generated
due to the pressure of the water flow inside those pipes (Fig.
1
).
The water jets discharged at high pressure rates move through
the granular material of the soil that covers the pipe and produces
swirls that erode the surface of the pipes until the walls end up
breaking.
Therefore, the aim of this research is to analyze how external
abrasion causes this type of drilling in pipes of water distribution
networks (WDNs) through several experimental tests. It also seeks
to describe this phenomenon and identify differences in results
from the variation of input conditions. To achieve this, a laboratory
model was built in the Hydraulic Laboratory of the Universidad de
los Andes (Bogotá, Colombia), where the conditions of buried
pipes in situ were reproduced. Multiple experiments were per-
formed varying the initial conditions, such as material, pipe sizes,
and water pressure. It is important to mention that the only limi-
tation of the simulation was that the model could not be pressurized
internally as in a real-life system. However, this does not mean that
the results are not accurate, but this fact should not be taken into
account when interpreting the findings.
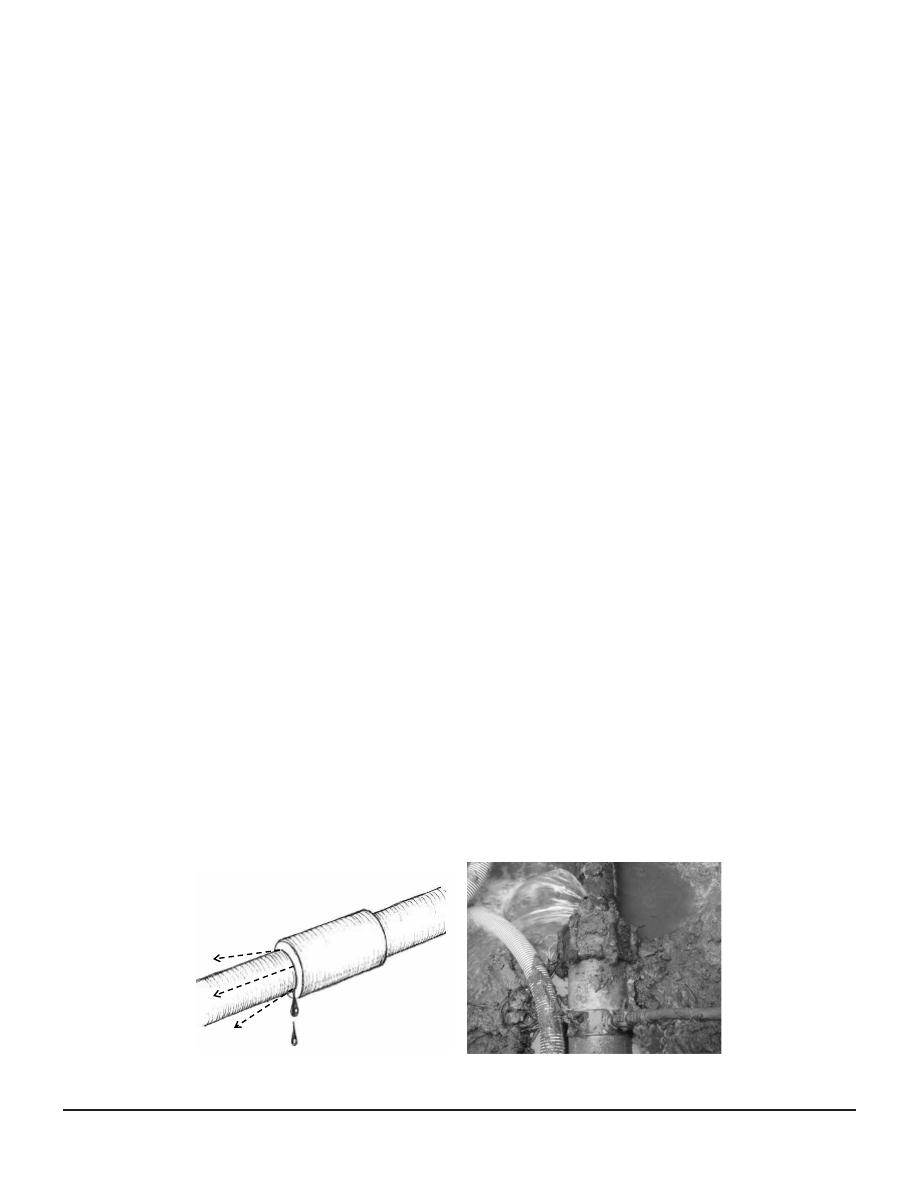
Model Description
The laboratory model seen in Fig.
2
was made up of a tank built
with 6.5-mm-thick steel sheets. The dimensions of the tank were
0.7 m wide, 0.75 m high, and 2.5 m long. Initially, the top of the
tank was uncovered so the tested pipes and granular material (local
soil sample) could be introduced. Soil conditions were exactly the
same for all tests, and three lifts of
0.15 m each were used. Com-
paction was done manually using a single-direction plate, and soil
humidity was 10%
–14%. Afterwards, a top cover of the same steel
material and thickness was built to maintain the internal pressure on
the soil and isolate the internal conditions from the outside. To en-
sure that the soil would be pressurized, a total of 30 screws were
used to secure the lid to the tank.
Two steel cover plates
0.3 m wide and 0.4 m high were installed
on both the front and back part of the tank. The front cover was
built with two types of openings where the test and water supply
pipes were placed. The latter was connected on one end to the lab-
oratory water supply system through a series of
76.2-mm (3-in:)
galvanized steel pipes using a male threaded adapter [Fig.
3(a)
]
and from the other end (inside the tank) to a new steel accessory
built to allow the simulation of leakage. This was made by design-
ing the accessory with a shape that guaranteed a transition from a
circular cross-sectional area of the water supply pipe to a rectan-
gular cross-sectional area that simulated a thin jet of a leaky cou-
pling (
2.3 × 40.9 mm). To guarantee a smooth transition of the
water flow without generating a water impact, a 45° short nipple
was used. This angle was determined as being suitable for avoiding
an abrupt change in water direction and for not increasing the hori-
zontal distance of the contact zone between the test pipe and the
(a)
Leaking PVC water pipe
(b)
Fig. 1. (a) Example of potential leaks in a pipe; and (b) how it looks in a real situation.
© ASCE
04020046-2
J. Pipeline Syst. Eng. Pract.
J. Pipeline Syst. Eng. Pract., 2020, 11(4): 04020046
Downloaded from ascelibrary.org by Universidad de los Andes on 03/08/22. Copyright ASCE. For personal use only; all rights reserved.
simulated leak at the joint. For the purposes of this study, this
accessory will be referred to as the flute [Fig.
3(b)
].
On the other hand, the back cover had only one type of opening
to hold the other end of the test pipe. Thus, both ends of each test
pipe were exposed to atmospheric conditions and could be moni-
tored from either opening by a video camera.
Because the experiment considered different test pipes with dis-
tinct diameters and materials, several side covers were built with the
corresponding male unions so the pipes would be held properly in
place. The vertical distance between the opening of the test pipe
and the one coming from the water supply pipe also varied to en-
sure that, despite the changes in the diameter and thickness of the
test pipes, the nozzle of the flute would always be parallel and suf-
ficiently close to the wall of the pipe [Fig.
4(a)
].
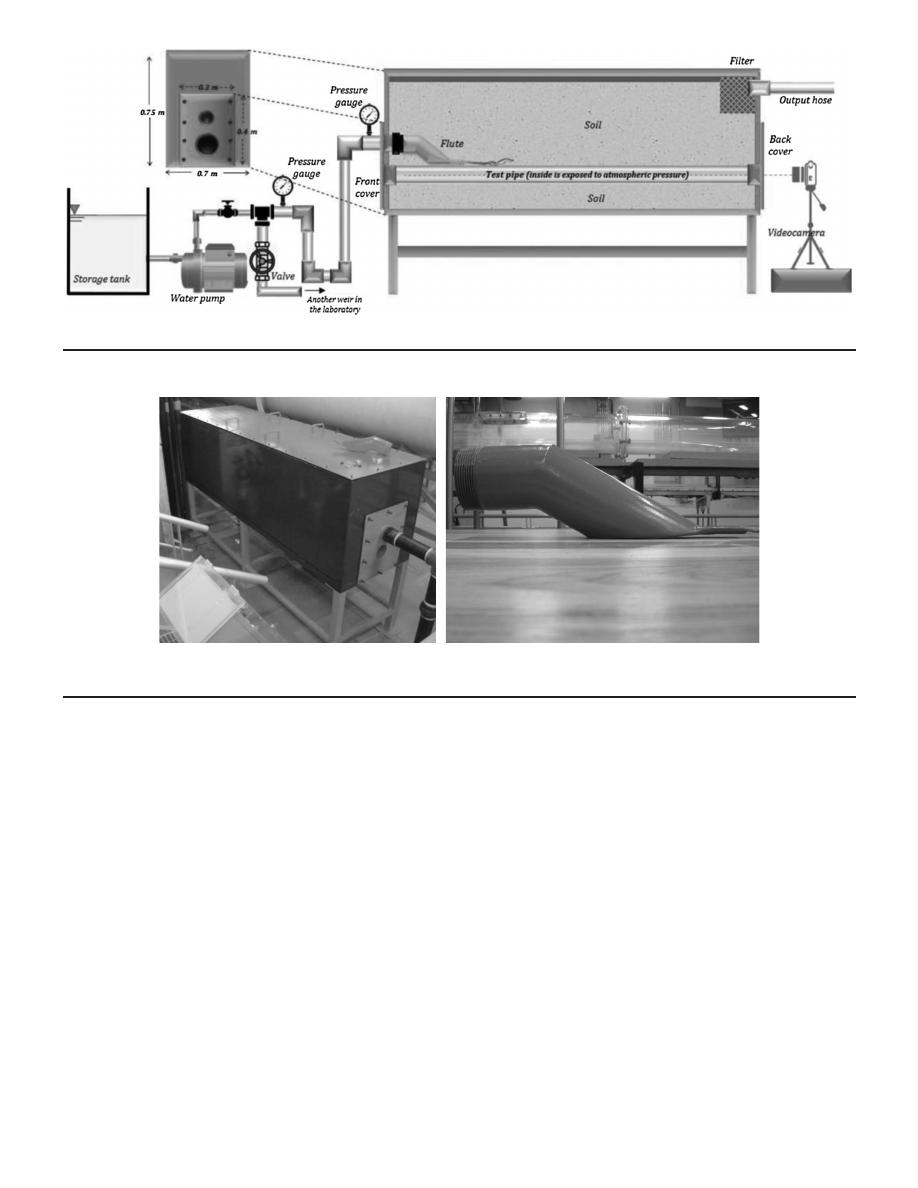
Additionally, the design included another
76.2-mm (3-in:) open-
ing in the upper right side of the tank to allow the connection
of a hose to remove the excess water from the saturated soil of
the model. To avoid significant losses of sand particles through the
hose, a filter made with mesh and gravel was placed right before
the output opening to retain as much soil material as possible
[Fig.
4(b)
]. This connection ended in one of the weirs of the labo-
ratory, where the water returned to the supply system.
It is important to mention that to regulate the water pressure
entering the tank, a pump was connected to the galvanized steel
pipes at the beginning of the assembly and a valve was used to
control the water flow required for each test. When it was com-
pletely closed, the water was transported toward another weir of the
laboratory, but as it was gradually opened, the water flowed toward
the model with the desired pressure. Thus, the input conditions
were achieved without exceeding the capacity of the pump.
Instrumentation consisted of two pressure gauges [electronic
Kobold MAN-LD (KOBOLD Messring GmbH, Hofheim, Ger-
many) [range 0
–100 kPa (0–1 bar)], accuracy 0.1%) and a
bourdon gauge [range 0
–1.1 MPa (0–160 psi)], accuracy 1%)],
a video camera, and an ultrasonic micrometer. The first pressure
gauge was placed right before the entrance of the model to obtain
the water pressure at the output of the flute. However, to increase the
reliability of the data, the second gauge was placed a few millimeters
after the valve, close to the pump. During the tests, it was found that
both measures were quite similar as water flow was relatively small
and head losses were negligible. Hence, only readings of the elec-
tronic gauge were reported as results.
The video camera was used to continuously record the interior
of the test pipes to observe the exact moment when the failure
(a)
(b)
Fig. 3. (a) Experimental setup for testing external abrasion; and (b) lateral view of flute.
Fig. 2. Experimental setup for testing external abrasion (side view).
© ASCE
04020046-3
J. Pipeline Syst. Eng. Pract.
J. Pipeline Syst. Eng. Pract., 2020, 11(4): 04020046
Downloaded from ascelibrary.org by Universidad de los Andes on 03/08/22. Copyright ASCE. For personal use only; all rights reserved.
occurred in each test pipe. This helped to keep exact track of the
time in order to stablish the duration of the tests from the begin-
ning until each pipe failed. Finally, the ultrasonic micrometer (The
Woodlands, Texas) Check-Line TI-007 (range
0.15–25.4 mm,
accuracy
0.001 mm) was used to measure only the thickness
of the PVC pipes in the damaged area. The micrometer uses a
sensor that emits electronic signals to the material and then
records the time it takes the signal to return. A digital device re-
ceives the readings and associates the reduction of wall thickness
in terms of a variable such as the function of the wave velocity
moving through the material tested.
Tests
A total of 13 tests were carried out using pipes with diameters of
101.6, 152.4, and 203.2 mm (4, 6, and
8 in:, respectively) and made
of different materials such as PVC (with biaxially oriented particles),
polyethylene, and ductile iron. These pipe properties were selected
because they are commonly used for local WDNs and couplings in
household connections, in accordance with local regulations. The
values for the input parameters for each test are presented in Table
1
.
Taking into account the real conditions of a WDN, test pressures
ranged between 50 and 200 kPa [5.8 and
20.4 m of water gauge
(mH2O)] depending on the material and diameter of the pipe. For
trials with polyethylene and PVC pipes, pressure values of 50, 90,
and 120 kPa were initially considered, while for ductile iron pipes,
150 and 200 kPa were used. At the beginning of each test, the pres-
sure was first verified with both manometers in order to choose the
right value for each type of pipe. Because polyethylene and PVC
pipes with the largest diameter [203.2 mm (
8 in:)] have greater wall
thicknesses, higher test pressures had to be considered using values
of 150 and 200 kPa. Therefore, realistic conditions were intended to
be simulated by ensuring that the pressures were not over- or under-
estimated for each type of test pipe.
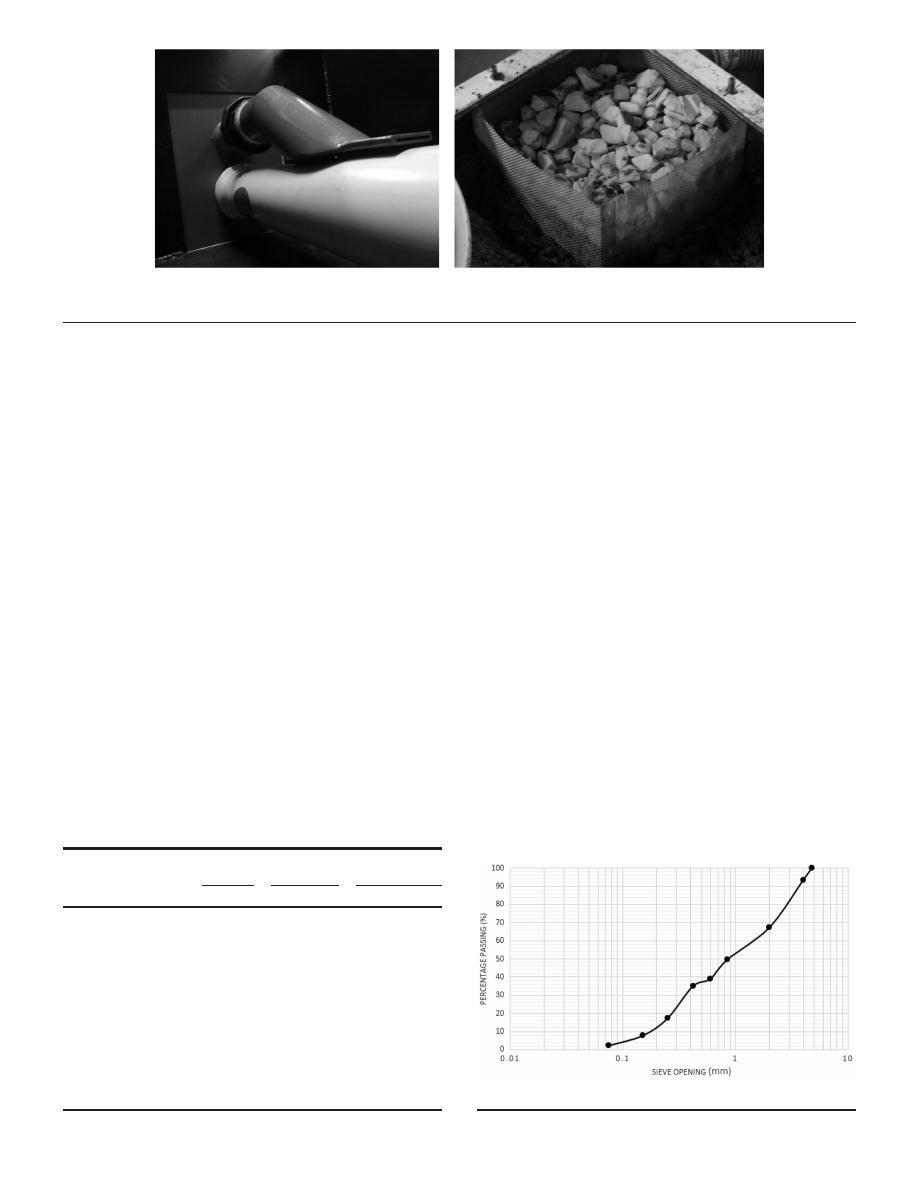
As for the soil environment surrounding the test pipe, a sample
with properties similar to those of the infill soil commonly used in
local interventions once pipes are installed was used. According to
the Unified Soil Classification System (USCS), the test soil was
well-graded sand with gravel (SW).
The sample was uneven and very well graded, containing sand
particles of a wide range of sizes and a smaller portion of gravel and
silty material, as can be seen in the soil gradation curve in Fig.
5
.
The coefficient of uniformity (
Cu) was 8.78 and curvature coeffi-
cient (
Cc) was 0.524.
The assembly consisted of installing the 2.5-m test pipes in the
tank with their corresponding fittings and alternating both side cov-
ers whenever the diameter of the selected pipes changed. Some
pipes had bell-and-spigot (rubber rings) ends, while others did
not, so it was necessary to use either dresser couplings or a hermetic
seal with neoprene on a smaller opening. After verifying that the
test pipes were properly placed and secured, the soil sample was
added and compacted using methods of compaction commonly
seen in field labor. However, neither power tools nor international
(a)
(b)
Fig. 4. (a) Flute placed for pipe test; and (b) gravel filter to avoid sediment loss through output pipe.
Table 1. Values of input parameters for external abrasion tests
Test
number
Material
Thickness
Nominal
diameter
Test pressure
(mm)
(in.)
(mm)
(kPa)
(mH
2
O)
1
PVC
2.75
4
101.6
92
9.4
2
PVC
2.75
4
101.6
117
11.9
3
PVC
2.75
4
101.6
57
5.8
4
PVC
2.75
4
101.6
57
5.8
5
PVC
4.12
6
152.4
117
11.9
6
PVC
4.12
6
152.4
92
9.4
7
Ductile iron
9.97
6
152.4
200
20.4
8
Ductile iron
9.97
6
152.4
155
15.8
9
PVC
5.49
8
203.2
155
15.8
10
PVC
5.49
8
203.2
117
11.9
11
Polyethylene
11.95
8
203.2
155
15.8
12
Polyethylene
11.95
8
203.2
200
20.4
13
Ductile iron
9.97
6
152.4
155
15.8
Fig. 5. Soil gradation curve of sample used in model.
© ASCE
04020046-4
J. Pipeline Syst. Eng. Pract.
J. Pipeline Syst. Eng. Pract., 2020, 11(4): 04020046
Downloaded from ascelibrary.org by Universidad de los Andes on 03/08/22. Copyright ASCE. For personal use only; all rights reserved.
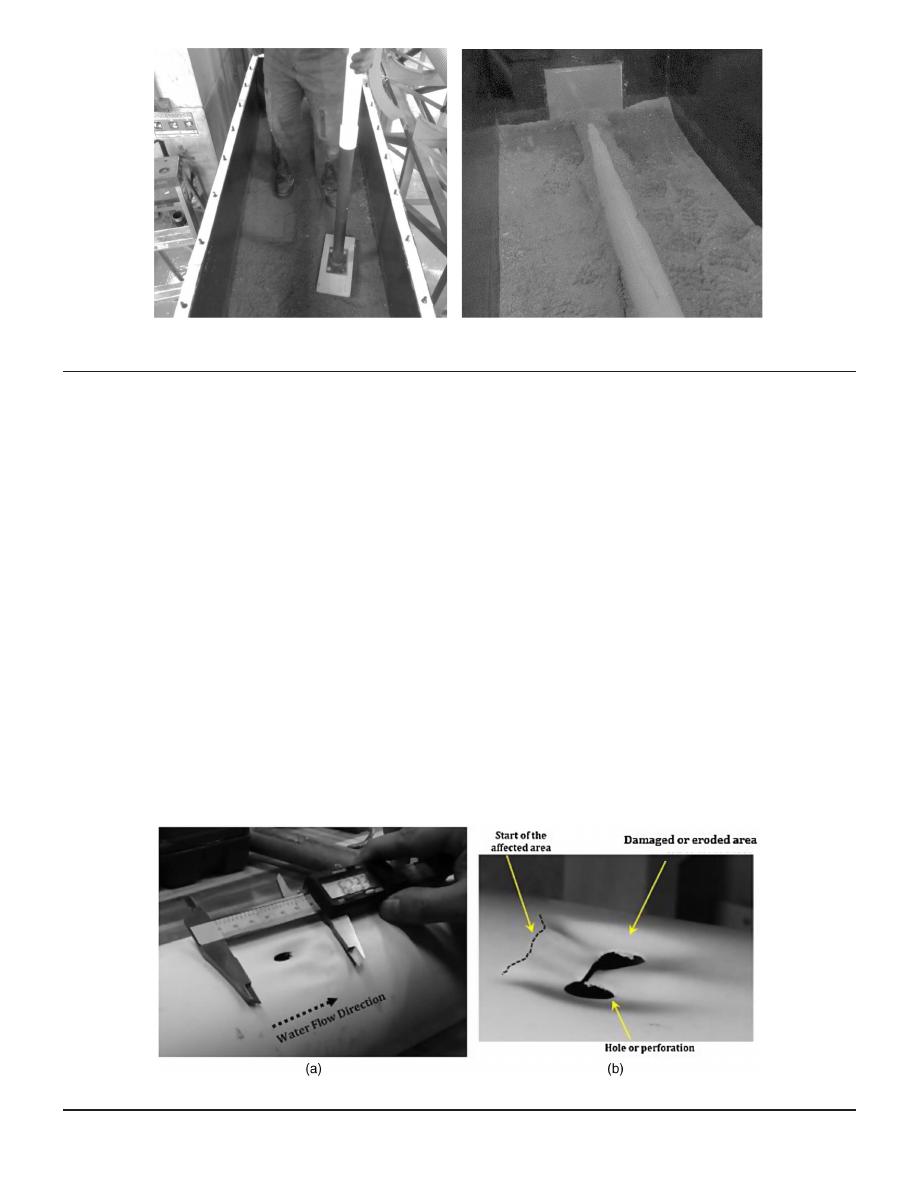
standards, such as the Proctor compaction test, were used. Fig.
6(a)
shows how the compaction was done using handmade tools and
nonstandardized regulations until the tank was completely filled
with the soil material [Fig.
6(b)
], and then the upper cover was
placed and hermetically sealed. Then the electronic gauge was in-
stalled, the pump turned on, and the valve opened to the desired
pressure. Finally, the video camera was located to the side of the
tank to record the inner part of the test pipe.
The tests were then developed until each pipe failed, i.e., the
moment cracks appeared on the top surface of the pipe near the
jet impact zone; this was determined by using the video camera
recordings to detect the exact time at which water and soil started
to enter the test pipe. These time measurements were different for
each tested pipe. Because of the cracks, a soil fluidization phe-
nomenon occurred and water with sediment particles started pass-
ing through the hole. Right after this, the pump was turned off so
both the water flow and video recording stopped, then each test
pipe was internally disassembled. The soil sample was removed
without affecting the pipe walls, and pictures of the results obtained
were taken. Finally, the tested pipe was uninstalled to measure and
analyze the dimensions of the failure before moving to the next
test pipe.
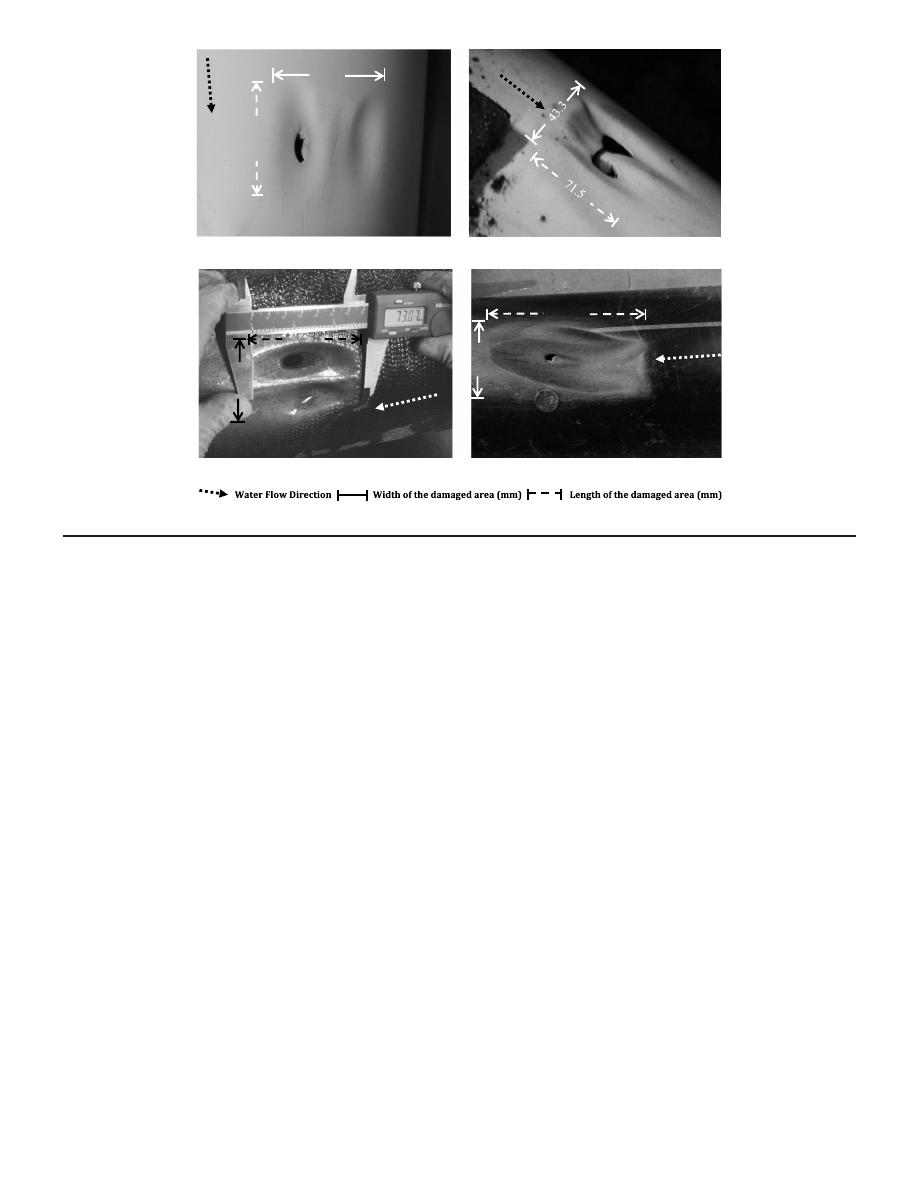
Two types of scouring damage were observed through all the
tests, such as holes caused by the piercing of the pipes and a dam-
aged area surrounding it. Failure measurements of both the width
and length of the hole and the damaged area were registered using
an electronic caliper [Fig.
7(a)
]. Fig.
7(b)
shows the typical shape
seen in most of the failures of tested pipes, although each pipe pre-
sented slight changes in the areas affected by the wear. For PVC
pipes, the wall thickness in the damaged area was also measured
using the ultrasonic micrometer. Finally, an additional granulomet-
ric analysis of soil was carried out when a significant amount of soil
material got inside the tested pipes.
Results and Analysis
The results obtained from each test showed that failures were inevi-
table regardless of the surface material of the tested pipe, caused by
the interaction of many input variables such as pressure, test time
until failure, diameter, and wall thickness. All tested pipes pre-
sented scouring damage due to the impact of the simulated leakage
jet and scouring of soil particles against the pipe. The deterioration
process started with the weariness of the walls of the pipes caused
(a)
(b)
Fig. 6. (a) Soil compaction method; and (b) soil medium progressively compacted.
Fig. 7. (a) Failure measurements of PVC tested pipe; and (b) characteristics of scour damage seen.
© ASCE
04020046-5
J. Pipeline Syst. Eng. Pract.
J. Pipeline Syst. Eng. Pract., 2020, 11(4): 04020046
Downloaded from ascelibrary.org by Universidad de los Andes on 03/08/22. Copyright ASCE. For personal use only; all rights reserved.
by the water pressure coming out of the flute at a constant abrasion
rate. In general, the behavior of the failures was very similar among
tests, while there were differences in the size and location of the
perforations.
Usually damage began close to the outlet of the flute and
developed several centimeters downstream. The affected areas
showed well-defined elongated shapes that tended to be oval and
extended mainly in the direction in which the water jet was ejected.
As seen before, some pipe tests (Tests 2, 4, 5, and 7) showed two
valleys with a crest in the middle that had greater wall thickness,
while in the other tests a single valley was formed. This damaged
shape followed no detectable trend. For example, comparing results
in Fig.
8
, it can be seen that perforations did not always appear
when two valleys were formed, and holes that would go through
both valleys occurred even less frequently. There were two tests
(Tests 3 and 8) where no perforations occurred, so they were re-
peated using the same input conditions, and on the second attempt
the perforation indeed appeared.
Furthermore, it is noteworthy that, in the case of ductile iron
pipes, not only abrasion problems were recorded but also corrosion.
This happened because the movement of the particles removed the
protective coating of the pipes; therefore, water could come into
contact with the metal wall and oxidation occurred.
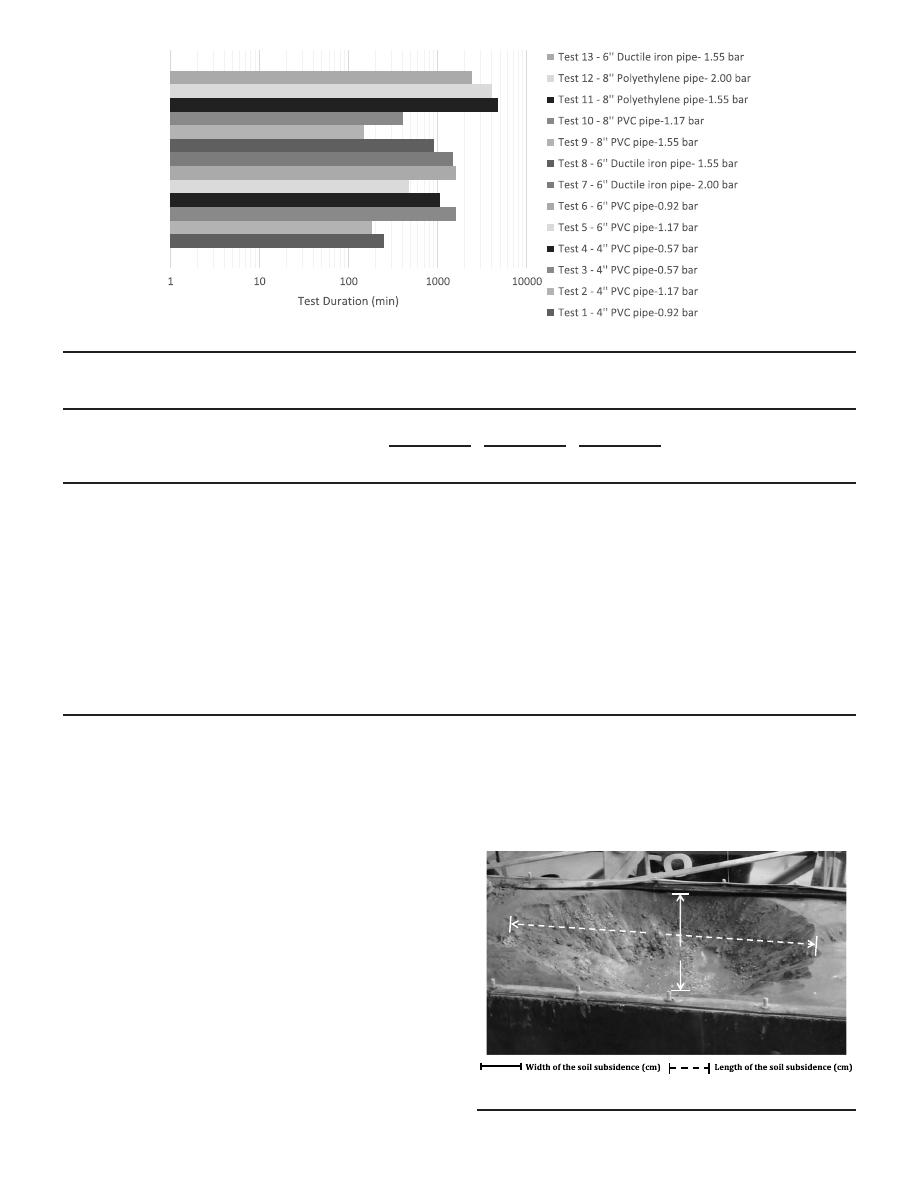
Likewise, from the results obtained for the 13 tests, it is impor-
tant to highlight the correlation between input and output variables.
For example, the pipe resistance is clearly affected by the relation
between the initial parameters of pipe size and wall thickness. If
only failure time is analyzed, it can be seen in Fig.
9
that Test
10 lasted 2 h more than Test 5 and almost 4 h more than the second
test because of the larger diameter and thickness.
On the other hand, the pipe material also presented some
differences in the results, as seen in Table
2
, as ductile iron and
polyethylene had a performance far superior to that of PVC. When-
ever the latter was tested, the results were always worse than with
the other materials, even at lower pressures. Knowing that test pres-
sure is a major factor in determining the duration of a test, and con-
sidering that it is an inversely proportional relationship, the time
differences ranged between 40 and
150 h under equal input con-
ditions. Another correlation can be noted in the time from pipe fail-
ure and the end of the test; this time is proportional to the size of
the holes and, to a lesser extent, to the damaged area. In this table,
width refers to the dimension perpendicular to the flow (across the
pipe) and the length corresponds to that dimension parallel to the
flow (along the pipe). This notation also applies to soil subsidence;
however, in subsidence there is another dimension, depth, which is
measured vertically.
It can be also noticed that pressure affects considerably the sizes
of the perforations, damaged area, and soil subsidence. As shown in
the following table, for all test pipes of the same size, the dimen-
sions of the perforations and damaged areas were larger as the pres-
sure increased. On the other hand, for PVC pipes at the same water
pressure, the dimensions of the perforations and damaged areas are
smaller for larger pipe diameters evidencing a higher resistance of
the material. In all cases, the dimensions of the soil subsidence de-
pended mostly on the water pressure (at higher pressure, bigger
dimensions) and the test duration. At lower pressures the tests were
longer, which means more time for the water jet to impact the soil
and increase the damage dimensions.
The uncertainty in the results is not negligible since there is sig-
nificant variability in the data between tests, and some exceptions
were noticed. This means that results might have errors that must
be taken into account in the analysis and conclusions about the
test. The main factors inducing this phenomenon could be related
to randomness in the process of soil compaction or in the exact
35.5
49.7
131.9
73.1
53.3
55.2
(a)
(b)
(c)
(d)
Fig. 8. Worn areas of different tested pipes.
© ASCE
04020046-6
J. Pipeline Syst. Eng. Pract.
J. Pipeline Syst. Eng. Pract., 2020, 11(4): 04020046
Downloaded from ascelibrary.org by Universidad de los Andes on 03/08/22. Copyright ASCE. For personal use only; all rights reserved.
position of the flute. Despite these factors, from a global perspec-
tive, the results of this research are precise in showing how external
abrasion occurs in drinking water pipes.
Another aspect to discuss is soil fluidization, which affects
the soil arrangement and destabilizes the surrounding environment
(Fig.
10
). At first, an assumption was made that the bore in the
soil surface was formed because the tank was not completely
filled. However, after several trials it was observed that the water
jet affected the structure of the granular material owing to soil
fluidization.
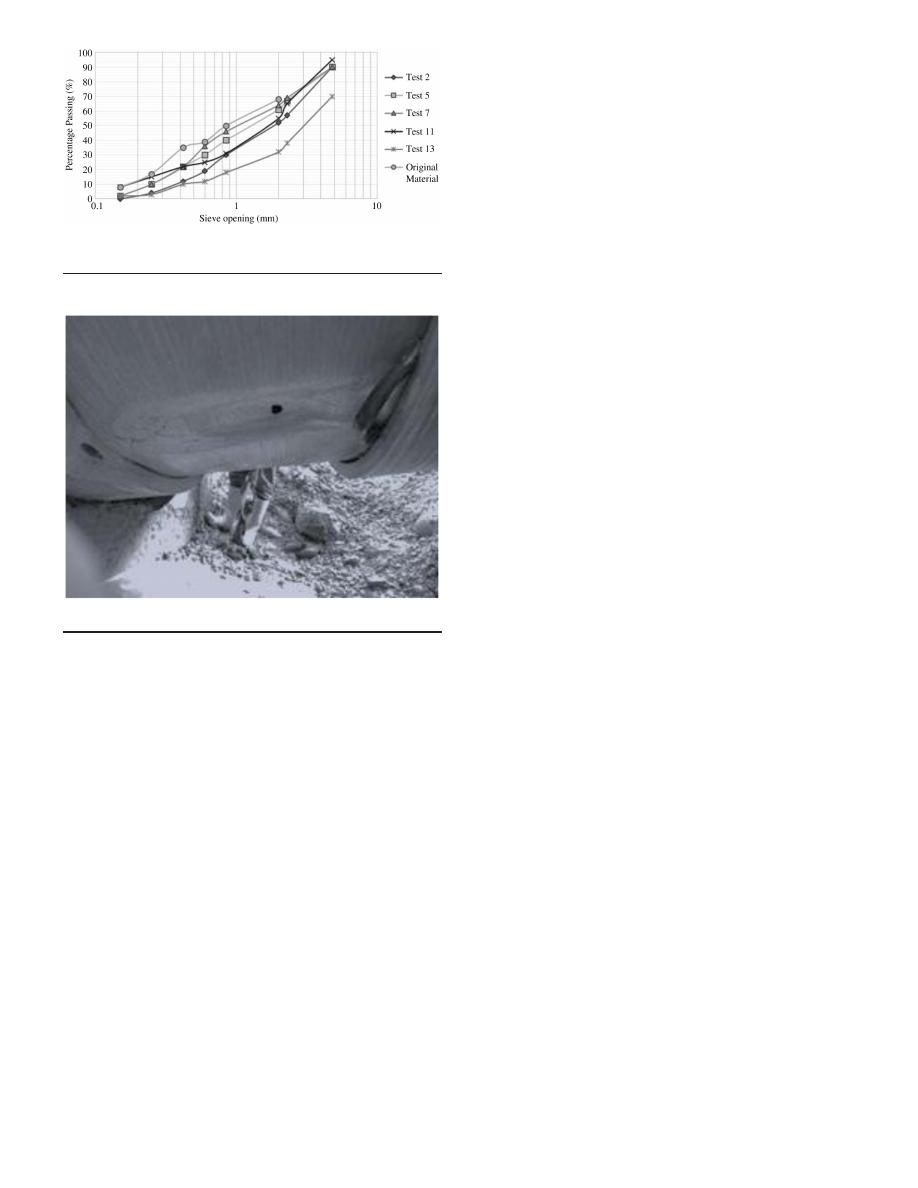
A significant amount of studies have been carried out on this
topic, but the most relevant one for this research is the one by
van Zyl et al. (
2013
). This research aimed to understand the effects
of leaks (through orifices) in a water distribution pipe in the sur-
rounding soil throughout several tests (
van Zyl et al. 2013
). During
this process, the finest particles were washed out, and as time
passed only material of larger particle size was found near the noz-
zle area. Granulometric analysis was conducted on the soil material
that entered the test pipes through holes, assuming that it corre-
sponded to the same type of sample as the one in the tank that
remained near the nozzle of the flute. Indeed, Fig.
11
shows that
the samples collected from each test had particles with sizes (on
average) larger than in the original mixture.
The results presented in this research offer information that can
be used as a guide on how pipeline failures are generated due to
Table 2. Overall results of tests
Test
No.
Material
Diameter
(mm)
Test
pressure
[kPa (bar)]
Test duration
Dimensions
of perforation
Dimensions of
damaged area
Dimensions of
soil subsidence
Depth
(cm)
Time since
pipe failed
until test
is stopped
Weight of
soil material
inside pipe
(g)
Width
(mm)
Length
(mm)
Width
(mm)
Length
(mm)
Width
(cm)
Length
(cm)
1
PVC
101.6
92 (0.92)
4 h 10 min
5.26
12.79
38.74
62.33
N/A
N/A
N/A
N/A
N/A
2
PVC
101.6
117 (1.17)
3 h 4 min
7.40
20.90
45.80
66.29
53
70
11
11 min
9,200
3
PVC
101.6
57 (0.57)
26 h 22 min
N/A
N/A
42.08
49.20
34
47
4
N/A
N/A
4
PVC
101.6
57 (0.57)
17 h 44 min
4.66
10.03
35.51
49.73
32
34
2
1 h 9 min
N/A
5
PVC
152.4
117 (1.17)
7 h 51 min
9.3
14.5
43.37
71.5
61
83
14
1 h 49 min
20,981
7.9
15.9
6
PVC
152.4
92 (0.92)
26 h 38 min
3.34
8.48
44.11
62.42
43
62
9
4 min
N/A
7
Ductile iron
152.4
200 (2.00)
24 h 32 min
7.87
13.89
53.29
73.07
70
92
20
13 min
17,340
8
Ductile iron
152.4
155 (1.55)
150 h
N/A
N/A
57.2
92.75
70
96
19
N/A
N/A
9
PVC
203.2
155 (1.55)
2 h 30 min
4.33
22.87
23.11
95.11
50
94
10
30 min
7,035
10
PVC
203.2
117 (1.17)
6 h 50 min
4.71
14.65
43.49
86.86
54
85
9
5 min
N/A
11
Polyethylene
203.2
155 (1.55)
79 h 5 min
5.79
8.93
55.22
131.87
65
95
34
20 min
7,980
12
Polyethylene
203.2
200 (2.00)
69 h 40 min
6.82
7.04
41.2
153.11
70
143
20
34 min
N/A
53.2
13
Ductile iron
152.4
155 (1.55)
39 h 48 min
10.07
21.47
33.33
107.44
70
122
23
29 min
4,689
Fig. 9. Test duration for every test made.
83
61
Fig. 10. View of land subsidence in Test 5.
© ASCE
04020046-7
J. Pipeline Syst. Eng. Pract.
J. Pipeline Syst. Eng. Pract., 2020, 11(4): 04020046
Downloaded from ascelibrary.org by Universidad de los Andes on 03/08/22. Copyright ASCE. For personal use only; all rights reserved.
external abrasion in the laboratory. Nonetheless, it is essential to
take into account the differences between the conditions used in
this research and what happens in a real-life scenario. In the latter,
the breakdown of pipes could be principally caused by the internal
pressure of the water flow rather than the wear-off of the surface as
leaks appear. This is a consequence of reducing the thickness of the
pipe wall, which eventually will not be able to withstand the forces
generated by water and will fail in a rather dramatic way.
Finally, a real external abrasion case is shown in Fig.
12
that
exhibits erosion characteristics very similar to what was found in
laboratory tests. In this case, the pipeline was a GRP Pipe 2200 that
was 272 mm in diameter with a wall thickness of 29 mm. The ex-
ternal abrasion was caused by Movement 273 of the O-ring seal
under a pressure of 20 bar.
Conclusions
Owing to the deterioration and failure of pipes in WDNs and sew-
age systems, rehabilitation and maintenance activities are becom-
ing a very important concern for water utilities. The study and
analysis of the causes and effects of certain damage to water pipes
must be taken into account in the definition of technical specifica-
tions that influence the design and operation of water systems.
Abrasion is a widely studied phenomenon, since both the inner
and outer walls of pipes can undergo continual damage by external
factors until leaks or breakages occur.
This research aimed to analyze the impact of external abrasion
when leaks appear in the joints of water pipes and interact with the
surrounding soil. A laboratory model was built to simulate the con-
ditions of an underground pipe with a leaky joint. A total of 13 tests
were carried out in the laboratory using a setup where pipes made
of different materials and having different diameters were installed
under a soil sample that was selected according to local character-
istics. Realistic soil compaction techniques were applied manually,
and both flow and pressure conditions were controlled for each test.
Pipe failures occurred after a range of
20–100 h depending on the
tested pipe.
The results indicated that all pipes in a WDN are vulnerable to
the effects of external abrasion. Leaks in joints or domestic con-
nections can produce scouring damage in the outer walls of a pipe
due to the combination of the force of water jets coming out of the
pressurized pipe and the swirls of particles of the surrounding soil.
The thin water jets wash the finest particles away, leaving the larger
ones to scour the surface. Once leakage appears, the damaged area
will start to grow, and it is just a matter of time before not only the
pipe fails but also soil fluidization begins to interfere. It was noticed
that as the tests proceeded, a bore appeared in the surrounding soil
caused by the impact of the water jets in the soil arrangement and
some soil particles going were lost through leaks. In real situations,
soil fluidization could affect the pavement structure of a street
above the WDN and cause damage to other urban infrastructures.
Metal surfaces suffer not only external abrasion but also oxidation,
which can accelerate damage in pipes; in addition, the oxidation
may exacerbate sanitation and environmental issues with water
quality.
Since the model configuration presented in this research was
established for understanding the external abrasion phenomenon
in pipes of WDNs, the results obtained are tied to the input param-
eters and experimental approach of creating an additional accessory
for simulating the jet of a leaky joint. Therefore, it must not be
assumed that the performance of the pipe failures shown here
are the same as in reality. While the limited conditions in the labo-
ratory can only reproduce progressive failures, in real cases the
walls of pipes cannot resist the high internal pressure of flow trying
to be ejected through a small orifice, and quick interventions must
be implemented. If more accurate real-world leakage performance
needs to be represented in a future study on external abrasion, it is
highly recommended to improve the approach of the experimental
setup. This could be done by including other variables, such as
water flow through a pipe under pressurized conditions, or adding
defective connections to create real leaks of various sizes.
Water utilities may use these results as a guide to improve the
techniques and quality of connections of pipe fittings, rather than
criteria for selecting the piping material during the design of water
networks. This research showed how leakages have a significant
influence on the condition of water pipelines, as the phenomenon
of external abrasion can wear the walls of pipes until failure. This is
an important issue that should be tracked and addressed by water
utilities considering that most leakages of this type are usually hid-
den underground until serious impacts emerge. Water service can
be affected and then an immediate and more complex rehabilitation
process will be required. Therefore, this analysis might help prevent
situations related to breakages in pipes that would require costly
rehabilitation activities before the end of their operational life.
Finally, it is important to carry out tests using different pipe
materials of varying thickness, diameter, pressure, and, perhaps,
soil gradations and compactions. This could lead practitioners to
choose pipe junction systems and seals that perform best in those
different scenarios.
Fig. 11. Granulometric curves of material found in inner part of pipe at
end of test and original mixture.
Fig. 12. External abrasion real case.
© ASCE
04020046-8
J. Pipeline Syst. Eng. Pract.
J. Pipeline Syst. Eng. Pract., 2020, 11(4): 04020046
Downloaded from ascelibrary.org by Universidad de los Andes on 03/08/22. Copyright ASCE. For personal use only; all rights reserved.

Data Availability Statement
Some or all data, models, or code that support the findings of this
study are available from the corresponding author upon reasonable
request.
References
Alsaydalani, M. O. A. 2017.
“Influence of cavitation phenomenon on the
hydraulic behavior of leaks in water distribution systems.
” J. Water
Supply Res. Technol. AQUA 66 (5): 327
–339.
https://doi.org/10.2166
/aqua.2017.013
.
De Marchis, M., C. M. Fontanazza, G. Freni, V. Notaro, and V. Puleo. 2016.
“Experimental evidence of leaks in elastic pipes.” Water Resour. Man-
age. 30 (6): 2005
–2019.
https://doi.org/10.1007/s11269-016-1265-2
.
Fox, S., R. Collins, and J. Boxall. 2016.
“Physical investigation into
the significance of ground conditions on dynamic leakage behaviour.
”
J. Water Supply Res. Technol. AQUA 65 (2): 103
–115.
https://doi.org
/10.2166/aqua.2015.079
.
Latifi, M., S. T. Naeeni, and A. Mahdavi. 2018.
“Experimental assessment
of soil effects on the leakage discharge from polyethylene pipes.
” Water
Sci. Technol. Water Supply 18 (2): 539
–554.
https://doi.org/10.2166/ws
.2017.134
.
Majid, Z. A., R. Moshin, Z. Yaacob, and Z. Hassan. 2010.
“Failure analysis
of natural gas pipes.
” Eng. Fail. Anal. 17 (4): 818–837.
https://doi.org
/10.1016/j.engfailanal.2009.10.016
.
Mih, W. C., and J. Kabir. 1983.
“Impingement of water jets on nonuniform
streambeds.
” J. Hydraul. Eng. 109 (4): 536–548.
National Sanitation Foundation. 1955. A study of plastic pipe for potable
water supplies. Ann Arbor, MI: School of Public Health, Univ. of
Michigan.
Pike, S., J. van Zyl, and R. Clayton. 2018.
“Scouring damage to buried
pipes caused by leakage jets: Experimental study.
” J. Pipeline Syst.
Eng. Pract. 9 (4): 04018020.
https://doi.org/10.1061/(ASCE)PS.1949
-1204.0000328
.
Van Zyl, J. E., M. O. Alsaydalani, C. R. Clayton, T. Bird, and A. Dennis.
2013.
“Soil fluidisation outside leaks in water distribution pipes—
Preliminary observations.
” Proc. Inst. Civ. Eng. Water Manage. 166 (10):
546
–555.
https://doi.org/10.1680/wama.11.00119
.
© ASCE
04020046-9
J. Pipeline Syst. Eng. Pract.
J. Pipeline Syst. Eng. Pract., 2020, 11(4): 04020046
Downloaded from ascelibrary.org by Universidad de los Andes on 03/08/22. Copyright ASCE. For personal use only; all rights reserved.
