
Battle of the Water Networks District Metered Areas
Juan Saldarriaga, A.M.ASCE
1
; Jessica Bohorquez
2
; David Celeita
3
; Laura Vega
4
;
Diego Paez
5
; Dragan Savic, A.M.ASCE
6
; Graeme Dandy, M.ASCE
7
; Yves Filion
8
;
Walter Grayman, M.ASCE
9
; and Zoran Kapelan
10
Abstract: The Battle of Water Networks District Metered Areas (BWNDMA) was the latest of the Battle of Water Networks competition
series held at the 18th Water Distribution Systems Analysis Conference (WDSA 2016) as part of ASCE
’s Environmental and Water
Resources Institute (EWRI) stand-alone conferences in Cartagena, Colombia in July 2016. In these competitions, the main objective
was to address a specific problem related to water distribution systems (WDS) regarding how to optimize the design and operation of
the system
’s main components. This time, the competition was focused on the challenge of WDS network sectorization, that is, determination
of the new district metered areas (DMAs) for an existing network. Design requirements involved constraints related to costs, pressure uni-
formity, and water quality. Changes in valve and pump operations were needed to supply demands at adequate pressures and acceptable water
quality for the given supply scenarios: a wet season and a dry season with water shortages. Seven teams from different parts of the world
participated in the BWNDMA and presented their solutions at a special session during the 18th WDSA. This article summarizes the BWNDMA
teams
’ approaches, outcomes, and learned lessons for solving the challenging stated problem. An analysis of some of the decisions that were
taken is presented; for instance, some teams ignored the demand similarity criterion, the water age criterion, the pressure restrictions, or the
constraints in the water rate that could be extracted from sources. The approaches developed in the BWNDMA represent the state-of-the-art
with respect to the analysis of hydraulic conditions in DMAs of real-world water distribution networks for which it is mandatory to make
efficient use of available water resources.
DOI:
10.1061/(ASCE)WR.1943-5452.0001035
. © 2019 American Society of Civil Engineers.
Author keywords: Water distributions systems; District metered areas; Optimization; Metaheuristics; Design and operational trade-offs.
Introduction
The Battle of Water Networks District Metered Areas (BWNDMA)
was the sixth battle competition held as part of the Water Distri-
bution Systems Analysis Conference (WDSA) series. The compe-
tition dates back to 1985, with the Battle of Networks Models
(BNM) (
Walski et al. 1987
) held at Buffalo, NY, as a part of the
Computers in Water Resources Conference of the American Soci-
ety of Civil Engineers (ASCE). Subsequent battles included the
Battle of Water Sensor Networks (BWSN) for the 8th WDSA
Conference in Cincinnati, Ohio (
Ostfeld et al. 2008
), the Battle
of the Calibration Networks (BWCN) held at the 12th WDSA
Conference in Tucson, Arizona (
Ostfeld et al. 2012
), the Second
Battle of Water Networks Design (BWN-II) in the 14th WDSA
Conference in Adelaide, Australia (
Marchi et al. 2014
), and the
more recent Battle of Background Leakage Assessment for Water
Networks (BBLAWN) held at the 16th WDSA Conference in Bari,
Italy (
Giustolisi et al. 2016
).
Since the beginning of this battle competition, the goal was to
attract groups or individuals from academia, consulting firms, and
water utilities to submit strategies and proposals for addressing com-
plex problems in real water distribution systems (WDS). In the first
battle competition, the original BNM sought to bring together re-
searchers and engineers to propose solutions for the WDS design
(
Walski et al. 1987
). For this first edition of the competition, the pro-
posed network had features and problems that may be found in a real
network. To solve the problem, traditional and well-known methods
and strategies were applied by each team (
Walski et al. 1987
). There-
fore, each group applied its own research to the same problem, which
started to be known as a way of benchmarking new methods.
The BWNDMA at the WDSA 2016 Conference invited groups
and participants to propose a solution for the operation of the
E-Town network, providing a complex benchmark network to test
state-of-the-art methods, similarly to the first BNM. The results of
the participant teams for the BWNDMA were presented at a special
session during the 18th WDSA Conference in Cartagena, Colombia,
in July 2016. The BWNDMA
’s goal was to attract groups with differ-
ent backgrounds to propose a method for solving a challenging prob-
lem regarding a WDS under several restraints and conditions. The
objective of this paper is to present the BWNDMA problem, define
1
Professor, Dept. of Civil and Environmental Engineering, Universidad
de los Andes, Mario Laserna Bldg., Bogotá 111711, Colombia (corre-
sponding author). Email: jsaldarr@uniandes.edu.co
2
Lecturer, Dept. of Civil and Environmental Engineering, Universidad
de los Andes, Mario Laserna Bldg., Bogotá 111711, Colombia.
3
Researcher, Dept. of Civil and Environmental Engineering, Universi-
dad de los Andes, Mario Laserna Bldg., Bogotá 111711, Colombia.
4
Researcher, Dept. of Civil and Environmental Engineering, Universi-
dad de los Andes, Mario Laserna Bldg., Bogotá 111711, Colombia.
5
Ph.D. Candidate, Dept. of Civil Engineering, Queen
’s Univ., Kingston,
ON, Canada K7L 3N6.
6
Professor, Centre for Water Systems, Univ. of Exeter, Exeter EX4 4QF,
UK.
7
Professor, School of Civil, Environmental and Mining Engineering,
Univ. of Adelaide, Adelaide 5005, Australia.
8
Associate Professor, Dept. of Civil Engineering, Queen
’s Univ.,
Kingston, ON, Canada K7L 3N6.
9
Independent Consulting Engineer and EWRI Environmental and Water
Resources Systems Committee Member, 7141 Thornhill Dr., Oakland,
CA 94611.
10
Professor, Centre for Water Systems, Univ. of Exeter, Exeter EX4
4QF, UK.
Note. This manuscript was submitted on April 25, 2018; approved on
August 17, 2018; published online on January 26, 2019. Discussion period
open until June 26, 2019; separate discussions must be submitted for
individual papers. This paper is part of the Journal of Water Resources
Planning and Management, © ASCE, ISSN 0733-9496.
© ASCE
04019002-1
J. Water Resour. Plann. Manage.
J. Water Resour. Plann. Manage., 2019, 145(4): 04019002
Downloaded from ascelibrary.org by Universidad de los Andes on 03/08/22. Copyright ASCE. For personal use only; all rights reserved.

the rules and the assessment method for the competition, and con-
clude with a comparison of the results submitted by the partici-
pant teams.
Background
The concept of DMA management was introduced in the 1990s by
the United Kingdom water industry; at first, DMAs were defined as
discrete areas of a distribution system usually created by the closure
of valves or the complete disconnection of pipes, in which the
quantities of water entering and leaving the area are metered
(
Water Loss Task Force 2007
). The United Kingdom
’s water indus-
try argued that the use of DMAs should not be regarded as a quick
fix but as a long-term commitment between decision makers and
water utilities. The introduction of the DMA concept in WDS was
first proposed as a tool for reducing leakage in the system. How-
ever, definition of boundaries for a DMA sectorization is a complex
task because it has to consider economic as well as hydraulic as-
pects of WDS, such as the high number of variables and constraints
in the system (
Savic and Ferrari 2014
).
Currently, an opportunity exists to change the traditional man-
agement approach of WDS from passive to proactive. For instance,
most water utilities have only a reactive leakage management pro-
tocol, repairing broken or burst water mains and leaks that have
been reported by customers or that have become visible on the sur-
face. Nonetheless, researchers have found that unreported leaks,
which are not visible to the water supplier or to customers, may
account for larger amounts of lost water (
Thornton et al. 2008
)
given that these leaks run constantly for long periods until the water
supplier identifies the leakage and reacts to it. For this reason, re-
searchers identified the feasibility of considering proactive and
smart approaches based on current monitoring and control technol-
ogies, together with the introduction of DMAs. The partitioning of
WDS may be permanent or temporary; permanent districts defined
are called a DMA partitioning. This partition may be done through
the insertion of boundary valves and flow meters at the entrance
of each subsystem; these boundary or gate valves can be closed
permanently or controlled remotely (
Di Nardo et al. 2014
).
Traditional approaches in urban WDS are based on looped sys-
tems in which multiple flow paths connect each demand node in a
city. Looped systems provide redundancy and thereby prevent stag-
nation and accomplish relatively uniform water pressure and high
network resilience
—considered important elements of a reliable
supply service (
Ferrari et al. 2014
). However, good reasons exist
to believe that it may be convenient to divide the network into
independent DMAs.
Researchers agree that the partitioning of a network with DMAs
may represent challenges in water distribution; however, most of
them consider that the benefits of DMAs are greater than the draw-
backs. The main benefits of DMAs are (1) better pressure control
management techniques; (2) easier identification and reduction of
water losses and leakage; (3) better control of flows to improve
water balance; and (4) more efficient control of the spread of dan-
gerous contaminants and pollutants, which may protect customers
from attacks (
Scarpa et al. 2016
;
Di Nardo et al. 2014
). In contrast,
the main drawback of DMAs is that network resilience may be
lower than in the original network because fewer flow paths are
available to connect supply sources and demand nodes. This de-
creased resilience may have a negative impact in emergencies,
for example, fire flows, pipe bursts, control system failures, and
pump station failures (
Scarpa et al. 2016
).
Nevertheless, despite the drawbacks previously mentioned, in
some cases, DMA partitioning may have a positive impact on
the system. For instance, when a city has several water supply sour-
ces, each with its own water quality, it may be difficult to predict
and control this parameter within the network
—a common scenario
in developing countries. In this case, the benefits of a resilient net-
work are less important than the benefits of controlling the water
sources that provide water to each DMA (
Di Nardo et al. 2014
).
In addition to water quality issues, there are several cases in which
the existence of multiple interconnected water supply sources may
represent considerable losses by unaccounted-for-water, which is
the case for some cities in Mexico (
Tzatchkov et al. 2006
).
Furthermore, because every district is completely isolated,
DMAs may reduce the risk of accidental or malicious contami-
nation of the entire WDS, which provides effective protection
of the system (
Di Nardo et al. 2014
). Isolating districts is also
useful when maintenance and burst repairs are scheduled be-
cause it allows utilities to disconnect only those parts of the
network that have been affected. Sectorization is useful to mon-
itor leakage in each district and can be undertaken by analyzing
the minimum night flow due to the full isolation and the meas-
urement of flows in several key control points of the network.
Because of permanent pressure control, it is possible to maintain
low leakage levels in the WDS (
Ferrari et al. 2014
). Smaller
DMAs would make it easier to identify small leakages but
are inconvenient and more expensive because they require more
pipe closures and the installation of more valves between DMAs
(
Scarpa et al. 2016
). Thus, an optimal number of DMAs must be
determined to make good use of leakage detection teams and
equipment.
Finally, worth noting is that redesigning a WDS to include
DMAs is not a trivial issue. If this task is not performed carefully,
it may lead to supply problems, reduced reliability, and decreased
water quality (
Ferrari et al. 2014
). Important aspects exist to veri-
fying each proposed DMA partitioning and, thus, ensure that the
network behaves properly in emergencies. The most important as-
pects are fire flow emergency response and water quality controls.
One way to control the latter is to consider the water age in the net-
work (
Scarpa et al. 2016
). Water quality is an important factor given
the differences between looped networks and partitioned networks
because it is possible that several dead ends are created in the latter,
which may have a negative impact on water age in the network.
For these reasons, it is important to compare the performance
between the original looped WDS and its corresponding partitioned
version. Murray et al. (
2010
) showed that it is possible to define
DMAs in a WDS without compromising either reliability in water
supply or water quality in the system. Network performance was
found to decrease when connections between DMAs cannot be
avoided and water can flow to a downstream DMA. Thus, it is impor-
tant to use independent DMAs (
Murray et al. 2010
). In addition, be-
cause isolated DMAs are supplied directly by the transmission main, a
WDS is therefore more reliable, water quality is better, and the
possible spread of contaminants is reduced (
Murray et al. 2010
).
Grayman et al. (
2009
) found that, in large systems, there are no
significant differences in water quality that is calculated as the
water age of the network. When comparing a looped network
with its sectorized counterpart, there can be significant variations
in water age in nodes. However, when the entire network is con-
sidered, variations were not significant. Comparing fire flows,
the authors found that a variation of about 18% existed in the
number of nodes with acceptable pressures to comply with fire
flows in large networks. However, sectorization was found to
significantly improve water security related metrics, reducing
the number of people and pipes exposed to contamination inci-
dents by 60%
–85% (
Grayman et al. 2009
). For these reasons, it
is possible to conclude that the drawbacks of sectorization are
© ASCE
04019002-2
J. Water Resour. Plann. Manage.
J. Water Resour. Plann. Manage., 2019, 145(4): 04019002
Downloaded from ascelibrary.org by Universidad de los Andes on 03/08/22. Copyright ASCE. For personal use only; all rights reserved.

less significant than the benefits obtained in the tested metrics, at
least in large systems.
Problem Description
The municipality of E-Town, an important city in Colombia, sought
to change its current infrastructure given problems related to water
distribution. This town had promising growth opportunities from
its tourist potential and Colombia
’s overall economic growth. How-
ever, E-Town was experiencing some issues with the operative
configuration of its WDS, mainly from scarce water sources.
The city
’s water utility was interested in modifying the current
DMA configuration to make efficient use of available water and to
propose several infrastructure changes for 2022. A calibrated
hydraulic model of the current network that included some of
the proposed interventions in the future was used to solve the
BWNDMA problem. The network model included forecasted de-
mands, demand patterns, existing pump and tank characteristics,
and current valve controls (i.e., participant teams did not need to as-
sess population growth nor changes in demand because they were
already included in the .inp file). The model showed that the existing
DMA configuration was not able to deliver water efficiently because
considerable differences existed in the pressure conditions in the city
and because some tanks were not being used.
The main goal in this problem was to propose a new DMA con-
figuration to allow the water utility to function, for instance, with
the minimal number of DMAs possible, each one with a similar
total demand. Other objectives were to guarantee pressure uniform-
ity across the municipality, meet water quality goals, and ensure
efficient system operation for a variety of weather conditions
throughout the year.
Three water treatment plants (WTPs) supply E-Town
’s WDS:
Bachue, Cuza, and Bochica. During the wet seasons (March,
April, May, September, October, and November), these WTP can
supply all of the water demanded by E-Town; however, during the dry
seasons (December, January, February, June, July, and August), the
water utility is forced to use an aquifer to meet demand. This water is
redirected to two pump stations: Mohan and Fagua.
For the competition, the proposed DMA configuration must
be designed for the wet season, which was the most common
weather pattern in E-Town. Nevertheless, participant proposals
needed to provide a list of the operational changes that should
be implemented in the system for the dry season to fulfill its
hydraulic requirements. In 2014, the E-Town WDS had defined
some DMAs. By that year, the city was supplied by several
pump stations that took water from an aquifer, and Poporo WTP
provided 40% of the water from surface sources. However, with
this supply configuration, the city had serious problems ensuring
reliable water delivery. The supply configuration that will operate
from 2022 eliminated the Poporo WTP (which started working
only as a storage tank) because a substantial portion of new de-
velopments in the city have been built at higher elevations than in
the old city. Thus, Poporo WTP can no longer service them.
E-Town Network Description
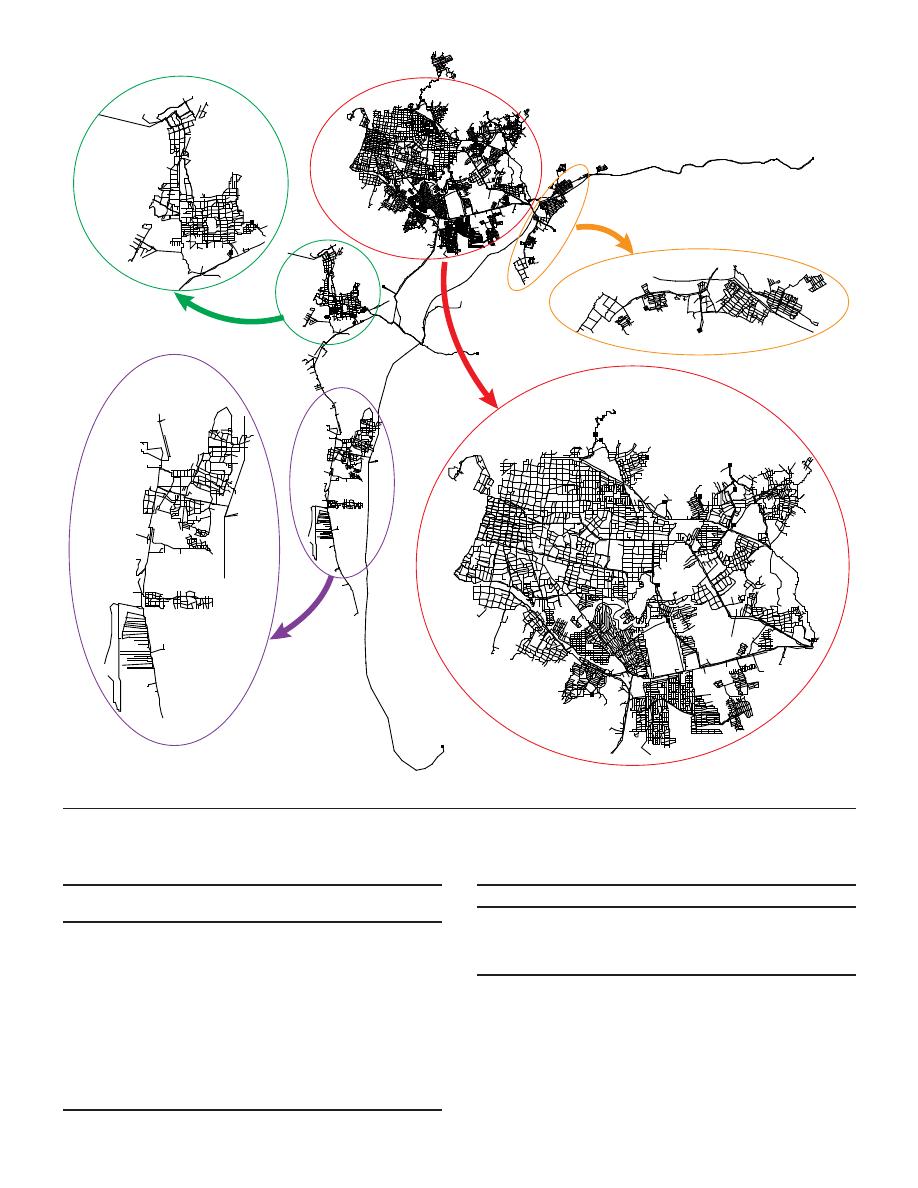
The E-Town network is large and complex; it consists of 11,063
nodes, five reservoirs (constant head), 17 water tanks (variable
head), 13,896 pipes, three pumps, and 14 valves organized in an
initial configuration of 15 DMAs that need to be updated, as is
shown in Fig.
1
. The range of demand and nondemand node ele-
vations in the system is between 0 and 198.5 m above sea level.
However, approximately 70% of the nodes in the network have
an elevation lower than 25.2 m. For that reason, it is possible to
conclude that E-Town is mostly a flat coastal system. The system
was simulated for a total extended period duration of 168 h. This
network was modified to preserve the anonymity of the real network
on which E-Town is based. All data for existing network compo-
nents were available in the EPANET version 2.00.12 (
USEPA
2002
) input file ETown.inp, which was provided as supplemental
material to the participant teams.
For the BWNDMA, several simplifications were made to avoid
the inclusion of more variables in the problem. For instance, it was
stated that the interest rate does not change over time to simplify
this problem (i.e., the capital costs were annualized considering a
0% discount rate). Thus, for the evaluation of the submitted solu-
tions, only one year was considered. However, it is important to
clarify that a real-world design problem must consider both the in-
terest rate and the design life of the project to perform a capital
costs assessment because most of the time water works are funded
with bonds or state-emitted debt (
Davis 2010
). Considering these
simplifications, the new pipe diameters available for the network
redesign are given in Table
1
. This table shows annual costs for
new pipes, annual costs for new parallel pipes (these have a
20% additional cost), and annual valve costs for a range of available
pipe diameters. These annual costs are used to calculate the capital
costs for that proposed solution. It was stated that for E-Town,
replacing pipes with a diameter smaller than 152 mm to reduce
disturbances to the city
’s operations was not cost-efficient. The ab-
solute roughness
ðk
s
or εÞ for all of the diameters was 0.01 mm
and the minor loss coefficient per length unit was set to 0.02 per
meter.
The installation of pressure reducing valves (PRVs) is allowed
to achieve the desired DMA configuration. The pressure settings on
controlled nodes could not vary over time. Therefore, the settings
could only be changed between seasons (wet and dry). The main
objective of installing PRVs in the system was to define different
DMAs. For this reason, a maximum of two PRVs installed at the
entrance of each DMA was allowed. E-Town
’s water utility had
already installed flow control valves (FCVs), and the status and
settings of these elements could be changed at no additional cost.
However, the valve settings could only be modified between wet
and dry seasons. Thus, the status and settings of the FCVs could
not be changed during the simulation.
Because of the increased demands, more storage capacity in the
system could be added, but only by adding more capacity in the
existing tank locations given land property rights. The new tanks
were assumed to have the same height and bottom elevation as ad-
jacent existing tanks; thus, there was no need to install new valves
to control the system. New tanks had standard prespecified sizes as
presented in Table
2
, along with their annual maintenance costs.
These costs include the connection of the new tank to the network.
E-Town
’s WDS had several tanks that were out of service (control
valves to the tanks in the hydraulic model were closed). Battle com-
petitors were allowed to use these tanks by installing FCVs at the
tanks at no additional cost.
E-Town
’s WDS was supplied mainly by surface sources, except
during the dry season, when it was necessary to pump water from
the city
’s aquifer. The three pump stations included in the original
model corresponded to the two wells from which water was ob-
tained (Mohan pump station has two pumps). These pump stations
could operate all day during the dry season, and adding hydraulic
controls in the model was permitted. Using time-controlled pumps
or variable speed pumps or modifying the pump curves was not
possible. It is important to clarify that, for the BWNDMA, energy
costs were not considered. However, a real-world design problem
must consider energy costs because they might be one of the largest
costs in the system.
© ASCE
04019002-3
J. Water Resour. Plann. Manage.
J. Water Resour. Plann. Manage., 2019, 145(4): 04019002
Downloaded from ascelibrary.org by Universidad de los Andes on 03/08/22. Copyright ASCE. For personal use only; all rights reserved.
Supply Scenarios
As was stated previously, E-Town had two different supply scenar-
ios: wet season and dry season. Addressing the problem was re-
quired for the wet season, which was the predominant one;
however, the system had to perform for the dry season scenario
as well, with both being assessed using the same criteria.
Fig. 1. E-Town water distribution system layout.
Table 1. Pipes and PRVs annual costs
Diameter
(mm)
New pipe
costs ($/m)
Parallel pipe
costs ($/m)
PRVs installation
costs ($)
102
—
—
315
152
—
—
695
203
23.31
27.97
1,501
254
26.09
31.3
2,240
305
29.86
35.83
3,711
356
32.56
39.07
4,470
406
35.35
42.42
7,400
457
38.56
46.27
7,733
508
41.87
50.25
7,750
610
62.18
74.62
9,211
711
69.96
83.95
10,685
762
73.46
88.15
11,708
Table 2. Tanks annual costs
Volume (m
3
)
Annual cost ($/year)
500
38,827
1,000
53,387
2,000
63,093
3,750
100,258
© ASCE
04019002-4
J. Water Resour. Plann. Manage.
J. Water Resour. Plann. Manage., 2019, 145(4): 04019002
Downloaded from ascelibrary.org by Universidad de los Andes on 03/08/22. Copyright ASCE. For personal use only; all rights reserved.
For the wet season, the water utility required that every demand
node of the network had water delivered to it at a proper pressure.
Nodes without demand were only required to maintain pressure
higher than zero. Only three nodes could violate this restriction
because they were located upstream of the pump stations. The mini-
mum pressure for demand nodes was 15 m. An additional require-
ment was that, at the end of the extended period simulation (168 h),
each tank must have at least the same volume of water that it had at
the beginning of the simulation (60% of its total capacity). During
the simulation, the level of each tank must lie between 10% and
90% of its total capacity. Fig.
2
presents the desired supply con-
figuration regarding the main pipe system of E-Town during the
wet season.
In contrast, the dry season presented a challenge in terms of
providing a reliable supply to meet E-Town
’s demand. The water
utility
’s main concern about failing to provide adequate supply was
exclusively given forced changes in the supply system during the
dry season. This concern occurred because, during these times of
the year, the maximum flow available from the WTPs decreased
considerably, and the city had to use two pump stations that drew
water from underground sources. Table
3
presents the maximum
flow rates that could be extracted from each water source during
both wet and dry seasons. Changes in the supply system led to inad-
equate network operation because of zones of high and low pres-
sures, unexpected flow directions, and tank emptying. In this sense,
the water utility desired a DMA configuration that could accom-
plish all of the requirements previously described during both the
wet and dry seasons with minimum changes in the network.
In the EPANET model, three FCVs were installed with maxi-
mum flows during the dry season for each WTP. Additionally, the
settings in Bochica
’s WTP FCVs could be modified, but the sum of
these two flow rates must be a maximum of
420 L=s, which is the
maximum flow rate that could be extracted from this groundwater
source during the dry season.
Assessment Criteria
The proposed solutions submitted for the BWNDMA was expected
to comply with the minimum requirements and performance crite-
ria described in this section. To summarize, requirements existed
for the number of DMAs, total costs, pressure uniformity, water
quality, and the number of valves setting changes.
DMA Configuration
A DMA was considered an isolated area with the pressure at one or
at most two entrances (in normal operation conditions) regulated by
one or two pressure reduction valves (PRV). Because a PRV sim-
ulates a flow measurement device, it is installed at the entrance of
each DMA. In the EPANET model, the status of the PRV may be
set as OPEN to simulate a valve that does not have a regulation
function in the system.
The water utility considered 15 DMAs manageable and conven-
ient; therefore, solutions that approach this number from the top
were favored. The minimum number of DMAs must be 15, and this
requirement was assessed through the following equation:
DMA
index
¼ N
DMA
− 15
ð1Þ
where DMA
index
= index that evaluated the performance of each
solution and N
DMA
= the number of DMAs that were defined
for the specific solution. In addition, for operational reasons, each
DMA should have a similar demand (i.e., a similar number of
users). Eq.
2
was used to assess this similarity
DS ¼
ffiffiffiffiffiffiffiffiffiffiffiffiffiffiffiffiffiffiffiffiffiffiffiffiffiffiffiffiffiffiffiffiffiffiffiffiffiffiffiffiffiffiffiffiffiffiffiffiffiffiffiffiffiffiffiffiffiffiffiffiffiffiffiffiffiffiffiffiffiffi
1
N
DMA
·
X
N
DMA
i¼1
ðV
in;i
− V
out;i
− V
avg
Þ
2
v
u
u
t
ð2Þ
where DS = demand similarity index (in m
3
) and N
DMA
= proposed
number of DMAs in the solution. V
in;i
= volume of water (in m
3
)
that flows into the DMA during the week and is calculated as
follows:
V
in;i
¼
X
M
j¼1
ðQ
D;j
·
ΔtÞ
ð3Þ
where Q
D;j
= flow that enters during period j (in weeks) as the time
index
ðj ¼ 1; 2; : : : ; MÞ; Δt = period of hydraulic modelling (1 h);
and M = total number of simulation time steps. V
out;i
= output vol-
ume during the simulation week that goes to another DMA (in the
case in which one DMA supplied water to a downstream DMA)
and is estimated as follows:
V
out;j
¼
X
M
j¼1
ðQ
D;j
·
ΔtÞ
ð4Þ
where Q
D;j
= demand during period j (in weeks) as the time index
ðj ¼ 1; 2; : : : ; MÞ and Δt = period of hydraulic modeling (1 h).
V
avg
= average volume of net inflow across the DMAs, defined
as follows:
V
avg
¼
P
N
DMA
i¼1
ðV
in;i
− V
out;i
Þ
N
DMA
ð5Þ
The previous equations were applied for solutions that had 15 or
more DMAs; thus, a solution with fewer than 14 DMAs was not
Fig. 2. Supply configuration during wet season.
Table 3. HGL and maximum flow rate per water source and season of
the year
Water source
Flow in wet
season (L/s)
Flow in dry
season (L/s)
Hydraulic
grade line (m)
Bachue WTP
450
240
60
Bochica WTP
800
420
200
Cuza WTP
1,600
900
125
Mohan pump station
NR
206
0
Fagua pump station
NR
314
0
Note: NR = not required.
© ASCE
04019002-5
J. Water Resour. Plann. Manage.
J. Water Resour. Plann. Manage., 2019, 145(4): 04019002
Downloaded from ascelibrary.org by Universidad de los Andes on 03/08/22. Copyright ASCE. For personal use only; all rights reserved.

accepted. It was desirable that all demand nodes were included in a
DMA. However, given its physical isolation in the system, a maxi-
mum of 55 nodes could be outside a DMA. Nondemand nodes
could also be outside DMAs.
Costs
The water utility desired a low-cost solution, that is, material costs
for pipes, tanks, valves, and construction. The following equation
was used to assess the capital cost of a proposed solution:
CC
net
¼
X
N
i¼1
C
i
L
i
þ
X
M
j¼1
K
j
þ
X
P
z¼1
V
z
ð6Þ
where CC
net
= network capital costs investment; C
i
= cost of the
ith pipe according to its diameter; L
i
= length of the ith pipe in mm;
i = new pipes index (N is the total number of changed pipes);
K
j
= cost of the jth valve according to its diameter; j = new valves
index (M is the total number of installed valves); V
z
= cost of the
zth tank according to its volume; and z = new tanks index (P is the
total number of installed tanks).
Pressure Uniformity
To maintain a similar level of water supply service to all customers,
to facilitate the operation of the WDS, and to guarantee that energy
was properly used in the system, the water utility sought to accom-
plish pressure uniformity throughout the network. Uniformity was
analyzed from two perspectives: (1) all consumption nodes must
have water delivered with a minimum pressure of 15 m for the peak
demand, and (2) all nodes in the network should have a similar
pressure that should be as close as possible to the minimum pres-
sure. The pressure uniformity in the network was defined using
an expression based on an equation proposed by Alhimiary and
Alsuhaily (
2007
)
PU
net
¼
X
M
j¼1
2
4 1
N
X
N
i¼1
P
i;j
− P
min
P
min
þ
ffiffiffiffiffiffiffiffiffiffiffiffiffiffiffiffiffiffiffiffiffiffiffiffiffiffiffiffiffi
P
N
i¼1
ðP
i;j
−P
avg;j
Þ
2
N
q
P
avg;j
3
5 ð7Þ
where PU
net
= pressure uniformity (nondimensional); P
i;j
=
pressure at junction i at time t
j
(in m); P
min
= required minimum
pressure of 15 m; i = junction index
ði ¼ 1; 2; : : : ; NÞ; j = time
index
ðj ¼ 1; 2; : : : ; MÞ; t
j
= simulation time; t
j
¼ jΔt is the time
step (equal to 1 h); and P
avg;j
= average pressure in the network at
time j, defined as follows:
P
avg;j
¼
P
N
i¼1
P
i;j
N
ð8Þ
The pressure uniformity was assessed only for demand nodes.
As an additional condition, whereas there were no restrictions in the
maximum pressure in the main pipe system of the municipality, no
DMA pipe could have a pressure higher than 60 m at any time of
the week. This restriction is valid only for pipes within a DMA.
Water Quality
Water quality was assessed by the water utility through the com-
putation of water age in the network nodes. Currently, the preferred
water age is exceeded in some parts of the network; thus, for the
future, the water age should be reduced. The water utility has de-
fined the network water age as it was implemented previously for
the BWN-II (
Marchi et al. 2014
)
WA
net
¼
P
N
i¼1
P
M
j¼1
k
ðjÞ
i
Q
ðjÞ
D;i
·
ðWA
ðjÞ
i
− WA
lim
Þ
P
N
i¼1
P
M
j¼1
Q
ðjÞ
D;i
ð9Þ
where WA
net
= network
’s weighted average water age above the
limit (in hours); WA
i;j
= water age at junction i at time t
j
(excluding
tanks and reservoirs); Q
ðjÞ
D;i
= demand (in m
3
) at junction i and time
t
j
; i = junction index
ði ¼ 1; 2; : : : ; NÞ and j = time index
ðj ¼ 1; 2; : : : ; MÞ; t
j
= simulation time; and t
j
¼ jΔt is the time
step, which equals to 1 min. WA
lim
= limit of water age (in hours)
allowed by Colombian regulation (60 h) and k
ðjÞ
i
is a binary variable
defined as 1 if the water age exceeds the limit or 0 if it does not, as
follows:
k
ðjÞ
i
¼
1; WA
ðjÞ
i
≥ WA
lim
0; WA
ðjÞ
i
< WA
lim
ð10Þ
Therefore, that the water age is only considered at nonzero de-
mand nodes and gives greater importance to nodes with larger
water demands. It also only considers water age at junctions
(excluding tanks and water sources). Finally, the threshold for the
water age was defined according to the existing regulation in
Colombia.
Operational Changes
Changes correspond to the opening and closure of isolation valves
[represented in EPANET (
USEPA 2002
) with the opening or clo-
sure of pipes] and the operation of PRVs and FCVs. The number of
changes necessary for the dry season were assessed through the
following equation:
OpCH
net
¼
X
N
i¼1
k
i
þ
X
M
j¼1
b
j
ð11Þ
where OpCH
net
= operational changes index of the network; k
i
is a
variable that equals 1 if the ith pipe was closed during the dry sea-
son and 0 if that pipe was not modified; i = pipe index (i
¼ 1;
2; : : : ; N); b
j
is a variable that equals 1 if the jth PRV (or
FCV) setting was modified during the dry season and 0 if that
PRV (or FCV) setting was not modified; and j = valve index
(j
¼ 1; 2; : : : ; M).
Assessment of Participant Solutions
Each team was required to submit only one solution regardless of
the optimization method used. Submitted solutions were assessed
considering the eight criteria previously described and two addi-
tional criteria: the committee score and the survey results obtained
during the special session at the conference. The final score for each
team was calculated considering the range among all participants
for each criterion, which indicates that the score was normalized
using all of the solutions with the following equation:
FS
j
¼
X
8
i¼1
ðS
i;max
− S
i;j
Þ
ðS
i;max
− S
i;min
Þ
þ
X
10
i¼9
ð
1
S
i;max
−
1
S
i;j
Þ
ð
1
S
i;max
−
1
S
i;min
Þ
ð12Þ
where FS
j
= final score of team j; S
i;max
= maximum score in each
criterion accomplished by the worst team; S
i;j
= score of the jth
team for the ith criterion; and S
i;min
= minimum score in each cri-
terion accomplished by the best team. The solutions were ranked
using the FS
j
scores, and the team with the highest overall rank was
selected as the winner of BWNDMA.
© ASCE
04019002-6
J. Water Resour. Plann. Manage.
J. Water Resour. Plann. Manage., 2019, 145(4): 04019002
Downloaded from ascelibrary.org by Universidad de los Andes on 03/08/22. Copyright ASCE. For personal use only; all rights reserved.

Competitor Solution Methods
Contributions made by each group are now presented by describing
the different methods proposed to address the problem stated for
the BWNDMA. In Table
4
, a summary of different features related
to the solutions is presented.
Gilbert et al. (
2017
) employed engineering judgment, network
graph simplification, and visualization tools in a multistage process
to find a feasible initial solution. Porteau Software was used to
identify isolated parts of the network such that data errors and iso-
lated nodes without a water source could be fixed. The initial DMA
boundaries were further optimized using agent swarm optimization
(ASO) to achieve feasible solutions with better costs of implemen-
tation, demand similarity among DMAs, and better operational
objectives. Finally, tailored and scalable sequential convex optimi-
zation tools optimized the operational settings of valves and pumps.
Salomons et al. (
2017
) proposed a method based on engineering
judgment, developed as a multistage design approach. First, source
allocation and general design were developed for the operational
zones. Subsequently, tank volumes were adjusted to meet their con-
straints, and DMAs were introduced to satisfy pressure regulations.
Finally, a detailed design and a fine-tuning of the operations were
carried out. An interesting element of this method is the source al-
location process through which natural offer/supply zones are iden-
tified and used when designing the network for each of these zones.
This process guarantees that water from the sources flows through
the tanks.
Martínez-Solano et al. (
2018
) proposed a solution method that
merged engineering judgment and heuristics. In this approxima-
tion, three simplified scenarios were considered: maximum de-
mand, minimum demand, and average demand, which represent
maximum pressure, minimum pressure, and tank-level behavior. The
DMA configuration was performed using engineering judgment,
and the METIS algorithm (
Karypis and Kumar 1998b
) and pseudo-
genetic algorithm (PGA) were subsequently used to generate graphs
to find an optimal configuration for pipe closures.
Brentan et al. (
2018
) also proposed a method that involved en-
gineering judgment and a set of different heuristics. Graph cluster-
ing and social network theory were used to define the DMAs limits.
Subsequently, pipe diameters and valves configuration were opti-
mized using three heuristics: particle swarm optimization (PSO),
genetic algorithms (GA), and soccer league competition (SLC).
Rahman and Wu (
2018
) proposed a method that merged engi-
neering judgments with simulation-optimization methods. First, the
main pipe network and the source nodes by pipe diameters were
identified. These source nodes became candidates for DMAs
’ entry
points and were subsequently defined using the breadth-first search
(BFS) method. Then, the Darwin optimization framework and the
shortest path algorithm were used for the optimization of DMA
partitions to identify entry points among the source nodes with
a minimized demand dissimilarity. The DMAs boundaries were
fine-tuned by limiting the number of inlets to two pipes, and pres-
sure requirements were met by excluding high elevation nodes.
Finally, the system
’s interventions were optimized to address the
criteria, for example, pressure uniformity and water age, among
others, throughout the system.
Rahmani et al. (
2018
) proposed a method based on graph theory
and optimization approaches. The method consisted of three se-
quential phases: (1) preliminary analysis, (2) DMA configuration
using graph theory and adjustment based on demand similarities,
and (3) optimal operation of the system using a number of consecu-
tive single and multi-objective optimization problem settings. The
objectives included minimizing total cost, water age, and pressure
uniformity indicators for wet as well as dry seasons.
The last group (Pesantez et al., unpublished data) proposed a
method based on the topological analysis of the network as well
as engineering judgment. First, a preliminary analysis of the sys-
tem
’s components was performed using a graphical method. This
analysis was carried out such that the main pipe network, the clo-
sure of valves, the tanks control configuration, and DMA limits
could be determined. Subsequently, a semi-automatic analysis was
performed using geospatial analysis to graphically redefine the
DMAs proposed during the first stage. Finally, the EPANET toolkit
was used to verify that all restrictions were being taken into account.
Results
As previously mentioned, all solutions submitted were required to
comply with a series of different criteria. Each group was asked to
submit only one solution for the wet season and specify the opera-
tional changes to implement to address the dry season. Therefore,
for the evaluation process, the BWNDMA committee established
problem restrictions based on the minimum requirements and used
Table 4. Summary of methods and simplifications proposed by BWNDMA participant teams
Team
Simplifications in criteria
Computational strategy
Optimization algorithm
1
Reduced the number of objectives, taking water age
as a constraint.
Did not considered water age in each iteration
because it was almost zero.
ASO
2
Ignored demand similarity and favored a small
number of DMAs (smaller costs and better water age).
N/A
Trial and error based on
engineering judgment.
3
Ignored the number of DMAs and instead worked
with uniformity of DMAs.
Skeletonization provides maximum simplification to
reduce computational times.
METIS algorithm and PGA.
4
N/A
Optimized for a steady-state simulation (minimum
and maximum demands).
PSO, GA, and SLC.
5
Ignored the restriction of the maximum water flow
rate that may be obtained from one of the WTP.
Used a software different from EPANET to run
hydraulic solver.
BFS, Darwin optimization
framework, and shortest path
algorithm.
6
Performed multiobjective optimization considering
all objective functions (minimize cost, water age and
pressure uniformity).
N/A
MOGA and NSGA-II.
7
Discarded the total cost criterion, focusing on the
other constraints.
Modified the original .inp file until hydraulic
conditions were set properly to reduce run time.
Defined DMAs graphically in
ArcMap version 10.3.1 and
iterated until pressure
constraints were met.
Note: ASO = agent swarm optimization; PGA = pseudogenetic algorithm; PSO = particle swarm optimization; GA = genetic algorithms; SLC = soccer league
competition; BFS = breadth-first search; MOGA = multiobjective evolutionary algorithm; and NSGA-II = nonsorting genetic algorithm.
© ASCE
04019002-7
J. Water Resour. Plann. Manage.
J. Water Resour. Plann. Manage., 2019, 145(4): 04019002
Downloaded from ascelibrary.org by Universidad de los Andes on 03/08/22. Copyright ASCE. For personal use only; all rights reserved.

the performance criteria to evaluate the performance of each sol-
ution. The purpose of this section is to present the results to the
problem submitted by the participants. However, to ensure consis-
tency in the results between different groups and a fair ranking,
the Committee simulated the submitted solutions and recalculated
the results reported by each group. These results are shown in
Table
5
. Discrepancies in performance criteria values between sub-
mitted solutions and those recalculated and validated by the
BWNDMA Committee were expected. For this reason, presenting
only the results recalculated by the BWNDMA Committee was
decided.
Potential discrepancies could have been identified given the
method used to calculate energy values (e.g., if the computational
time-step used for water quality in EPANET2 is different from the
hydraulic solver time-step). Discrepancies may also have occurred
from the modification of some of the established parameters in the
EPANET2 input file, modifications in the topology of the network,
or any other reason that could have affected the calculation and
produced misleading results.
Constraints compliance and performance criteria values in the
DMA configuration were used for ranking purposes and when se-
lecting the best solution within the conference
’s special session.
The final score of each team solution was obtained using Eq. (
12
).
However, violations of constraints and the final ranking are not pre-
sented because the BWNDMA
’s goal was to attract groups with
different backgrounds to propose a method for solving a specific
problem regarding a WDS. Researchers had the opportunity to test
their own methods and compare it with those from other leading
research groups throughout the world. Therefore, ranking the so-
lutions could be unnecessary. It is worth noting that, from a prac-
tical point of view, even infeasible solutions may be acceptable
because every solution was context- and constraint-dependent.
Analysis of Submitted Methods and Solutions
At first, it must be noted that BWNDMA was complex and is based
on a real-world problem. Thus, it was not expected that all partic-
ipants would be able to apply a full optimization process for all of
the performance criteria. Taking this into account, the idea was to
compare the decisions that different groups took and analyze the
criteria that were the most important for each team. Considering
the nature of real WDS design, where even infeasible solutions
may become feasible given trade-offs made by the decision maker,
the BWNDMA Committee decided to not take into account viola-
tions in the restrictions for this paper because they may offer some
insights into DMA design methods.
As was stated previously, participant solutions were assessed
using Eq. (
12
), which normalized the score considering all selected
criteria. To perform this assessment, a normalized score for every
criterion was needed. Normalized scores for every performance
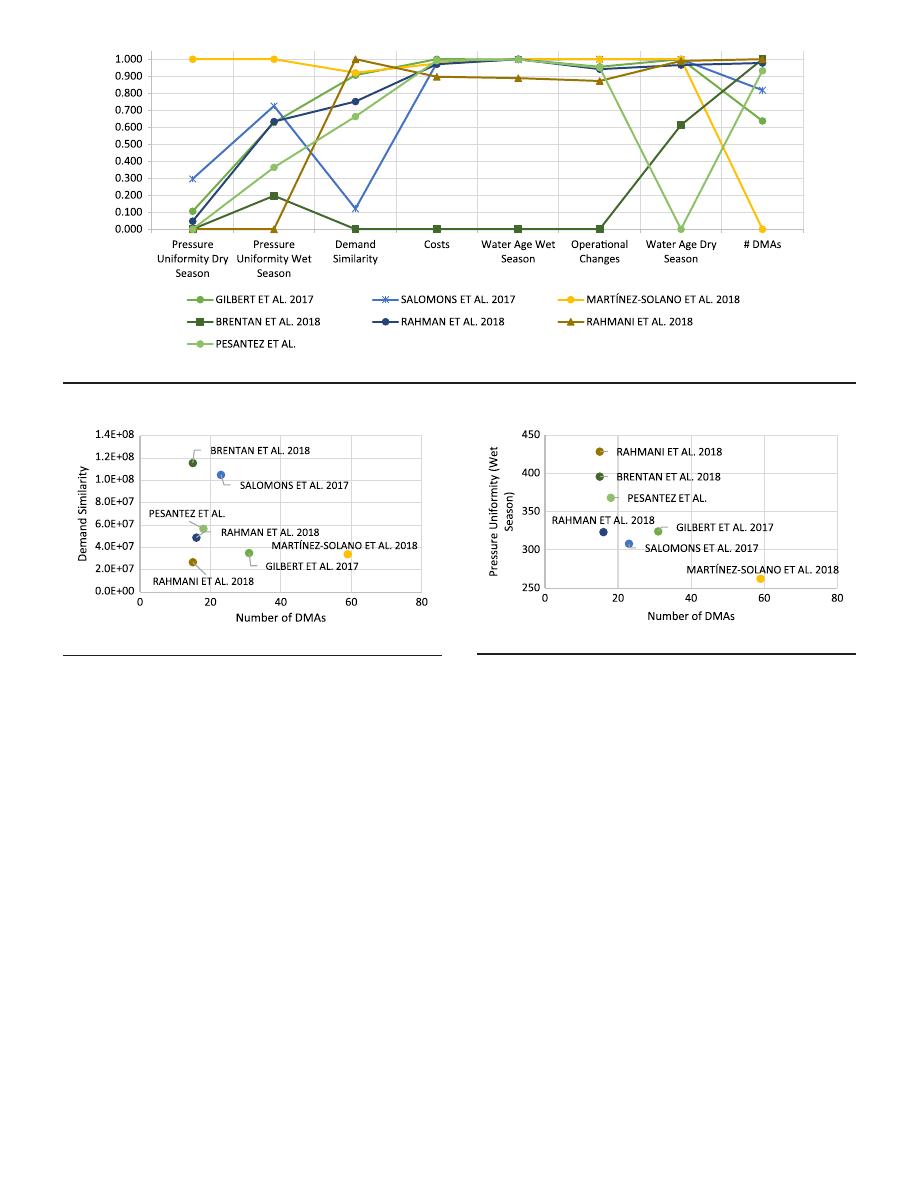
criterion for all participant teams are shown in Fig.
3
.
Cost is often used as the preferred criterion to compare different
solutions. However, because this was a mixed design and opera-
tional problem, capital costs were not the only relevant variable
in the solution. Thus, costs did not play a significant role in the
assessment process. In fact, one participant discarded costs and fo-
cused on the other criteria. Nevertheless, general cost performance
is presented in Table
5
, which indicates that most of the groups had
similar values, with solutions less than $1 million.
It is worth noting that the teams with higher costs were those
that reached a zero DMA
index
; therefore, lower costs were achieved
if a higher number of DMAs was defined. However, one participant
team found that, if the demand similarity criterion was neglected
and a lower number of DMAs was favored, capital costs and water
quality (measured as water age) could be improved. Several groups
explained the reason for this behavior: because there are fewer
DMAs, it is possible to use a smaller number of valves, which
should decrease capital costs. Participant teams argued that fewer
DMAs indicates that there are more flow paths available and, thus,
water age criterion should improve and constraints should be more
easily met. Therefore, fewer valves and fewer pipe replacements
would be needed, reducing capital costs and demonstrating that
a small number of DMAs has a beneficial effect on both capital
costs and water age in the network. In addition, one of the partici-
pant teams stated that it is not possible to assume that every pipe in
the network could be used as an isolation pipe, considering that in
several countries most pipes do not have isolations valves. For in-
stance, it is usual that only high diameter WDS pipes have valves
installed in developing countries and, thus, small diameter pipes do
not have any valve. In contrast, in developed countries, most WDS
pipes have isolation valves already installed, which can reduce
DMA implementation costs. For this reason, only a few pipes
should be considered as candidates for DMA boundaries because,
in some countries, a real problem is that capital costs could be
higher than the costs considered for this problem.
Regarding demand similarity, it was found that most teams
achieved good results for this criterion, even for a different number
of DMAs. This behavior is shown in Fig.
4
, which compares the
results from demand similarities to the number of DMAs proposed
by each participant team. This criterion has no clear trend. For in-
stance, it was found that obtaining very different values for the
Table 5. Performance criteria values of the submitted solutions as recomputed by the BWNDMA committee
Team
DMA
index
Demand
similarity
Total
costs ($)
Operational
changes
Wet season
Dry season
Pressure
uniformity
Water age
(h)
Pressure
uniformity
Water age
(h)
Gilbert et al.
16
3.51 × 10
7
$332,024.40
14
324.23
0.0047
323.00
0.0050
Salomons et al.
8
1.05 × 10
8
$613,244.36
5
308.03
0.0049
310.00
0.0065
Martínez-Solano et al.
44
3.39 × 10
7
$653,941.64
5
262.38
0.0045
261.92
0.0054
Brentan et al.
0
1.16 × 10
8
$12,972,011.0
208
395.84
0.3200
N/A
a
0.7180
Rahman et al.
1
4.88 × 10
7
$713,772.40
17
323.32
0.0045
326.98
0.0690
Rahmani et al.
0
2.68 × 10
7
$1,641,520.00
31
428.46
0.0398
330.17
0.0246
Pesantez et al.
3
5.67 × 10
7
$440,721.12
15
368.04
0.0052
N/A
a
1.8430
Minimum
0
2.68 × 10
7
$332,024.40
5
262.38
0.0045
261.92
0.0050
Average
10.3
6.02 × 10
7
$2,481,033.56
42.1
344.33
0.0550
310.41
0.3800
Maximum
44
1.16 × 10
7
$12,972,011.0
208
428.46
0.3200
330.16
1.8400
Note: In all criteria, lower values were preferred. Values given in bold are the best values for that criterion.
a
It was not possible to calculate and check the obtained results for these groups by the BWNDMA committee.
© ASCE
04019002-8
J. Water Resour. Plann. Manage.
J. Water Resour. Plann. Manage., 2019, 145(4): 04019002
Downloaded from ascelibrary.org by Universidad de los Andes on 03/08/22. Copyright ASCE. For personal use only; all rights reserved.
demand similarity criterion was possible for 15 DMAs. In fact, for
solutions with 15 DMAs, the minimum and the maximum demand
similarities were obtained. These results were surprising, especially
because some participant teams decided to use demand similarity to
define DMA size. In fact, some groups even prioritized demand
similarity over other criteria, defining the size of DMAs based on
its total demand in liters per second or defining that a DMA was too
large based on its demand compared with the average demand of
the other DMAs.
It is worth noting that most teams considered demand to be an
important aspect of its proposed solution. Some teams used demand
similarity as a criterion for defining DMAs size, as it was ex-
plained, using different methods such as semi-automated or manual
resizing of each zone. One of the participant teams found that DMA
identification by inspection was not enough to achieve good de-
mand similarity in the network; thus, they preferred automated
methods to define DMA partitions to achieve better results in this
criterion. It is worth noting that, given the geographical isolation of
some nodes, merging some low-demand DMAs was not possible,
which affected this criterion.
However, one team decided to ignore the demand similarity cri-
terion, arguing that if they were to achieve a perfect score and fol-
low that criterion, they would have had to define nearly 80 DMAs.
For that reason, that team decided to favor fewer DMAs in the net-
work, ignoring demand similarity. Of interest is that the participant
team that decided to discard demand similarity was not the team
with the highest value in that criterion. In contrast, teams that pur-
sued this criterion got the lowest values in demand similarity, thus
supporting a direct correlation between the strategy and the results.
For this reason, it was not possible to define a universal rule regard-
ing demand similarity and the number of DMAs in the network.
Thus, it is fair to say that a low number of DMAs does not nec-
essarily imply that demand similarity between DMAs is achieved.
Pressure uniformity was the most difficult criterion to fulfill in
the problem, as several participant teams reported. The reasons
included the network
’s complex dynamics, such as different entran-
ces and variations in demand and topology. When analyzing the
presented results by the participant teams, a clear trend was
detected: a lower number of DMAs meant that a wider range of
pressure uniformity could be obtained, as presented in Fig.
5
.
Participant teams
’ results for pressure uniformity in the wet season
had similar values, regardless of costs or demand similarities. It is
important to remark that the majority of participant teams first at-
tempted an experience-based DMA distribution considering mainly
elevation differences. Several groups stated that this engineering
judgment call focused on predefining DMAs following a reason-
able criterion: pressure uniformity. Those teams argued that it
was not possible to put together nodes with high differences in
pressures because that would make it very difficult to comply with
maximum and minimum pressure restrictions. For instance, one
Fig. 3. Normalized scores for every competitor team including all performance criteria.
Fig. 4. Comparison of demand similarity and number of DMAs.
Fig. 5. Comparison of pressure uniformity and number of DMAs.
© ASCE
04019002-9
J. Water Resour. Plann. Manage.
J. Water Resour. Plann. Manage., 2019, 145(4): 04019002
Downloaded from ascelibrary.org by Universidad de los Andes on 03/08/22. Copyright ASCE. For personal use only; all rights reserved.

group stated that it was difficult to comply with the 60-m maximum
pressure in nodes with very low elevations. For this reason, the first
approach for defining DMAs was to put together nodes with similar
elevations.
Another team argued that a small number of DMA partitions in
the network negatively affects pressure uniformity because larger
DMAs represent worsening of pressure control. The research liter-
ature is in accordance with this fact, as it was demonstrated that the
purpose of defining DMAs in a network is to have better pressure
control thanks to the small-area partitions. For this reason, this
group considered pressure as its criterion for defining new DMAs;
when pressure constraints were violated, a decision had to be made:
to create a new DMA for that zone or to mark that node as a non-
DMA node, which was allowed to have pressures higher than 60 m.
Therefore, if a new DMA was created, the idea was to connect that
DMA directly to the water supply main because it was found that
pressure management was easier if DMAs did not interact with
each other.
Another approach was to consider that the elevation difference
between the nodes connected by a pipe was the perfect value to be
defined as the weight for the links in their solution method, which
was based on directed graphs. A different team had a very different
approach: when it was defining DMAs, if pressure restrictions were
violated, those nodes were identified for further revision. Then, us-
ing valves, tanks, and pipe replacements, those pressure violations
were corrected. Based on the experience of those teams, the impor-
tance of pressure differences between nodes to obtain an initial sol-
ution to the problem was illustrated. After reviewing participant
teams
’ solutions, the first assumptions were found to be correct:
a large number of DMAs positively affects the pressure uniformity
criterion. However, it is not true to state that a solution with few
DMA partitions must have bad performance in pressure uniformity.
Water quality was not a decisive criterion in the BWNDMA,
mainly because water quality measured as water age is not a strong
restriction in Colombia. However, it may be remarked that most of
the solutions had similar water age values for the wet season, except
for one group that had a water age value more than five times higher
than the remaining groups (although all solutions fell within a nar-
row band of water age). One of the groups that defined 15 DMAs in
its solution obtained this value. In fact, several groups stated that
water age, as a quality criterion in E-Town, was not a hard restric-
tion in the problem. One participant team presented a water balance
analysis, which found that stored water in the network was nearly
half of the daily demanded volume. Thus, it was reasonable to think
that water is replaced twice a day in the network, which is good for
water age as quality criterion. For this reason, water age would only
represent a problem in isolated dead-ends. Similarly, as was pre-
viously presented, one team argued that a small number of DMAs
positively affected water age in the network. Moreover, as most of
groups had fewer than 25 DMAs as their solution, it would be ex-
pected that water age did not represent a challenge.
For those reasons, some participant teams did not consider water
age as a restriction in the first stages of their solution methods. For
instance, one team considered the problem as a nonlinear complex
set of subproblems, but instead neglected the water age criterion
because of its near-zero value. Another team ignored water age
through the simulation process and at the end made the necessary
adjustments following best management practices (BMP). Simi-
larly, some teams performed steady-state simulations for their
optimization methods when calculating the water age was not pos-
sible. Moreover, at the end, they performed the 168-h extended
period simulation to assess water age in the network. Some partici-
pant teams reported that only a few demand nodes in the network
presented a water age of more than 60 h
—more precisely, 0.03%
and 6%, as two of the teams reported it. As was expected, the teams
that defined more DMAs were those that achieved better water age
values for both the wet and the dry seasons.
Finally, most groups did not propose a large number of opera-
tional changes to solve the dry season
’s complications in available
water supply sources. Most groups did not propose more than 15
operational changes for this season. However, even when few
changes were proposed, participant teams performed poorly with
respect to the dry season criteria. For pressure uniformity, some
teams were not able to meet the minimum pressure constraint,
and for water age, most groups obtained higher values than those
obtained for the wet season. Worth noting is that participant teams
did not change their defined schemes of DMA partitions to address
the dry season problem.
A clear trend was identified: all teams but one solved the prob-
lem for the wet season scenario and then proposed operational
changes for the dry season scenario; only one team decided to first
address the dry season scenario (the more restrictive one) and then
check whether any operational change was required for the wet sea-
son problem. This group argued that only in the dry season was it
difficult to find a feasible solution; thus, if this scenario was solved
first, then the wet scenario was also solved. Based on the experience
of the other groups, the dry season scenario was the most difficult to
solve because of the scarce water supply availability. In fact, two of
the participant teams could not find a feasible solution to this prob-
lem because their optimization methods could not comply with
minimum pressure restrictions or could not handle negative pres-
sures. Another group decided to neglect the restriction on the maxi-
mum water that could be extracted from the dry season supply
sources, arguing that this scenario requires major engineering
interventions that cannot be done considering the restrictions im-
posed by the BWNDMA problem.
What We Learned about DMA Configuration
The previous section presented some relevant insights obtained
from the participant teams in the BWNDMA. The general purpose
of this section is to offer some conclusions and general recommen-
dations about sectorization and DMAs, taking into consideration
both the research literature and some of the insights. Considering
the results obtained by the participant teams, it is relevant to ana-
lyze the general performance and reconsider the main benefits and
drawbacks of implementing DMAs in a WDS. As was previously
stated in the DMA configuration section of this paper, researchers
agree that the four main benefits of sectorization are related to
pressure management, leakage identification, water balance im-
provement, and reducing the spread of contaminants in the system
(
Scarpa et al. 2016
).
Pressure and flow control were well discussed indirectly with
the statement of the BWNDMA, but the other two of these benefits
are also important for the operation of real WDS. For instance, the
identification of water losses to reduce leakage in the network de-
pends on how water utilities use available information from flow
meters in each DMA and on how water utilities react to pipe bursts
and breaks. Similarly, DMAs allow control of the spread of danger-
ous contaminants through the network only if water utilities have
well-defined limits for each DMA, and only if water utilities react
properly to emergencies. Those two situations occur during WDS
operation and are case-dependent; thus, those situations cannot be
analyzed by only considering the proposed DMA definition.
DMA partitioning may be used to achieve better pressure con-
trol management and improve flow metering and flow control. As
was previously discussed, pressure uniformity can be used to assess
how well pressure is managed in the system. Lower pressure
© ASCE
04019002-10
J. Water Resour. Plann. Manage.
J. Water Resour. Plann. Manage., 2019, 145(4): 04019002
Downloaded from ascelibrary.org by Universidad de los Andes on 03/08/22. Copyright ASCE. For personal use only; all rights reserved.

uniformity values are desired and, after analyzing results, better
pressure uniformity was found to achieve when more DMAs were
used, at least for the results presented by the BWNDMA compet-
itors as is shown in Fig.
5
. This outcome was expected because it
was found that if DMAs are too large, there is less pressure control
(i.e., if there are few DMAs). The idea of partitioning the network is
to create manageable zones and, as every DMA had one or two
inlets, it is possible to control precisely the pressure within each
DMA.
Improvements in inflow and outflow control may be partially
assessed through the demand similarity criterion because it ac-
counts for inflow and outflow similitude in different DMAs.
The BWNDMA results show that demand similarity did not follow
any particular trend regarding the number of DMAs and the value
of the criterion. For this reason, demand similarity was not relevant
if many DMAs were defined to achieve good results in the demand
similarity criterion. Hence, it is possible to state that a lower
number of DMAs is not necessarily better for achieving good
performance in operational objectives. Nevertheless, as was de-
scribed previously, it was found that most participant teams in
the BWNDMA considered demand similarity as an important cri-
terion when deciding whether or not to create a new DMA. In fact,
it is important to note that the implementation of fewer DMAs is
less expensive but, in contrast, the resulting DMAs will be more
dissimilar in pressures and demands between them.
In contrast, researchers argue that the main drawback of DMA
partitioning is the reduction in network resilience, regarded as a
reduction in supply reliability. As was previously discussed in the
background section, a reduction in network resilience may not nec-
essarily be an undesired outcome of DMA implementation because
the reduction in pipe loops may be useful for some emergencies
(e.g., pipe burst and contaminated water) but not useful for other
cases (e.g., fire flow and system failures). In addition, the analysis
of submitted solutions found that DMAs performs well for the con-
sidered criteria. However, when water sources are changed (i.e., the
dry season scenario), the interaction between the main pipelines
and the defined DMAs govern the proper response to the modifi-
cation of water sources. For this reason, it is left as a recommen-
dation for further research on real world networks in relation to
supply reliability, including a conscious analysis of network resil-
ience. This analysis should consider all possible scenarios and the
fact that there may be benefits and drawbacks in supply reliability
with the implementation of DMA partitioning. The evaluation and
consideration of resilience in WDN is left for future research work
and was not included as an objective to be assessed in the BWNDMA.
Conclusions
It is important to remark that the BWNDMA problem made an im-
portant effort to include a real-world problem for which a simpli-
fied model based on the distribution network existing in a real city
was used. Over time, networks used in battle competitions have
been modified to increase their size and complexity to match
the increase in computing power and the sophistication of the op-
timization methods. However, the problems associated with those
networks were not based on a real system and included too many
simplifications; thus, several situations that may be evident only
in real WDS were not taken in account. For this reason, the
BWNDMA included a challenging dry season scenario in which
water supply sources are scarce.
In addition, the problem was challenging and defied the iden-
tification of a global optimal solution given the complexity of a
real-sized network, the interactions between different elements,
and the decisions required to solve the water supply problem under
the proposed restrictions. However, the idea of the BWNDMA was
to propose a problem to be solved by different teams and to set
some ground rules, but the participants would use their own engi-
neering criteria and know-how to propose a solution for this chal-
lenging problem. In fact, none of the participant teams achieved a
perfect score for all of the performance criteria, at least not when
supply restrictions for the dry season problem were taken into con-
sideration. Because of the inherent complexities of the WDS, it was
not possible to meet all considered criteria with a unique solution;
therefore, participant teams made trade-offs and decided on the cri-
teria that were the most important, which is usual when solving
real-world problems. For instance, one participant team decided to
discard the number of DMA partitions, another group the demand
similarity criterion, and another group the restriction on the maxi-
mum amount of water that may be extracted from one source in the
dry season scenario. At the end, each group reached a solution that
may or may not be feasible depending on the circumstances in
which the solution is applied.
Another aspect that must be highlighted concerns the use of
engineering judgment, which is an important part for most of the
proposed solutions, if not for all of them. Regardless of the state-of-
the-art method that was used to redefine a wide search space (some-
thing usual in WDS problems), important decisions were made
considering engineering judgment. For instance, several groups
adopted sophisticated optimization methods, such as ASO, PGA,
nonsorting genetic algorithms (NSGA), multiobjective genetic al-
gorithms (MOGA), PSO, SLC, or graph-theory based algorithms.
However, at the end, a person or persons had to decide whether the
optimization algorithm
’s solution was good enough to solve the
problem because some parts of it cannot be modeled or simulated
properly.
It is a known fact that some water utilities are reluctant to adopt
newer technologies or methods because of their fears of how these
new methods may degrade the hydraulic performance of their net-
work given that it is not known how a particular method would affect
their network. However, considering the results proposed by partici-
pant teams, it is possible to demonstrate that the reasons underlying
the fears of implementing DMA partitioning may be wrong because
it is possible to obtain good hydraulic performance and good pres-
sure management. Although an effective DMA partitioning might be
difficult to achieve, it was found that fulfilling all hydraulic require-
ments and preserving the safety of the distribution system (regarded
as reliability in supply) is possible. This object was a main one of
the competition, and it was interesting to witness how different teams
proposed solutions to solve a complex but relevant problem. For this
reason, it is interesting and encouraging to develop these types of
competitions among the academic community, where the objective
is and should be to improve the understanding of WDS design and
analysis and to provide a discussion space to test new methods
developed by academia, consulting firms, and water utilities.
Data Availability Statement
Some or all of the data and models used during the study may be
available by request from the corresponding author of each partici-
pant team.
Supplemental Data
The E-Town original EPANET2 input file (.inp) is available online
in the ASCE Library (
www.ascelibrary.org
).
© ASCE
04019002-11
J. Water Resour. Plann. Manage.
J. Water Resour. Plann. Manage., 2019, 145(4): 04019002
Downloaded from ascelibrary.org by Universidad de los Andes on 03/08/22. Copyright ASCE. For personal use only; all rights reserved.

References
Alhimiary, H., and R. Alsuhaily. 2007.
“Minimizing leakage rates in water
distribution networks through optimal valves settings.
” In Proc., World
Environmental and Water Resources Congress 2007, 1
–13. Reston,
VA: ASCE.
Brentan, B., E. Campbell, T. Goulart, D. Manzi, G. Meirelles, M. Herrera,
J. Izquierdo, and E. Luvizotto. 2018.
“Social network community
detection and hybrid optimization for dividing water supply into district
metered areas.
” J. Water Resour. Plann. Manage. 144 (5): 04018020.
https://doi.org/10.1061/(ASCE)WR.1943-5452.0000924
.
Davis, M. 2010.
“General water supply design considerations.” In Water
and wastewater engineering: Design principles and practice. 1st ed.
New York: McGraw-Hill.
Di Nardo, A., M. Di Natale, G. Santonastaso, V. Tzatchkov, and V. Alococer.
2014.
“Water network sectorization based on graph theory and energy
performance indices.
” J. Water Resour. Plann. Manage. 140 (5): 620–629.
https://doi.org/10.1061/(ASCE)WR.1943-5452.0000364
.
Ferrari, G., D. Savic, and G. Becciu. 2014.
“Graph-theoretic approach and
sound engineering principles for design of district metered areas.
”
J. Water Resour. Plann. Manage. 140 (12): 04014036.
https://doi.org
/10.1061/(ASCE)WR.1943-5452.0000424
.
Gilbert, D., E. Abraham, I. Montalvo, and O. Piller. 2017.
“Iterative multi-
stage method for a large water network sectorization into DMAs under
multiple design objectives.
” J. Water Resour. Plann. Manage. 143 (11):
04017067.
https://doi.org/10.1061/(ASCE)WR.1943-5452.0000835
.
Giustolisi, O., L. Berardi, D. Laucelli, D. Savic, and Z. Kapelan. 2016.
“Operational and tactical management of water and energy resources
in pressurized systems: Competition at WDSA 2014.
” J. Water Resour.
Plann. Manage. 142 (5): C4015002.
https://doi.org/10.1061/(ASCE)
WR.1943-5452.0000583
.
Grayman, W., R. Murray, and D. Savic. 2009.
“Effects of redesign of water
systems for security and water quality factors.
” In Proc., World Envi-
ronmental and Water Resources Congress 2009, 504
–514. Reston, VA:
ASCE.
Karypis, G., and V. Kumar. 1998b.
“Multilevel k-way partitioning scheme
for irregular graphs.
” J. Parallel Distrib. Comput. 48 (1): 96–129.
Marchi, A., et al. 2014.
“Battle of the water networks II.” J. Water Resour.
Plann. Manage. 140 (7): 04014009.
https://doi.org/10.1061/(ASCE)
WR.1943-5452.0000378
.
Martínez-Solano, J., P. Iglesias, D. Mora, and J. Ribelles. 2018.
“Combin-
ing skeletonization, setpoint curves, and heuristic algorithms to define
district metering areas in the battle of water networks district metering
areas.
” J. Water Resour. Plann. Manage. 144 (6): 04018023.
https://doi
.org/10.1061/(ASCE)WR.1943-5452.0000938
.
Murray, R., W. Grayman, D. Savic, and R. Farmani. 2010.
“Effects of DMA
redesign on water distribution system performance.
” In Integrating
water systems. New York: Taylor & Francis.
Ostfeld, A., et al. 2008.
“The battle of the water sensor networks (BWSN):
A design challenge for engineers and algorithms.
” J. Water Resour.
Plann. Manage. 134 (6): 556
–568.
https://doi.org/10.1061/(ASCE)
0733-9496(2008)134:6(556)
.
Ostfeld, A., et al. 2012.
“Battle of the water calibration networks.” J. Water
Resour. Plann. Manage. 138 (5): 523
–532.
https://doi.org/10.1061
/(ASCE)WR.1943-5452.0000191
.
Rahman, A., and Z. Wu. 2018.
“Multistep simulation-optimization model-
ing approach for partitioning water distribution system into district
meter areas.
” J. Water Resour. Plann. Manage. 144 (5): 04018018.
https://doi.org/10.1061/(ASCE)WR.1943-5452.0000927
.
Rahmani, F., K. Muhmmed, K. Behzadian, and R. Farmani. 2018.
“Optimal
operation of water distribution systems using a graph theory-based
configuration of district metered areas.
” J. Water Resour. Plann.
Manage. 144 (8): 04018042.
https://doi.org/10.1061/(ASCE)WR.1943
-5452.0000941
.
Salomons, E., O. Skulovich, and A. Ostfeld. 2017.
“Battle of water net-
works DMAs: Multistage design approach.
” J. Water Resour. Plann.
Manage. 143 (10): 04017059.
https://doi.org/10.1061/(ASCE)WR
.1943-5452.0000830
.
Savic, D., and G. Ferrari. 2014.
“Design and performance of district meter-
ing areas in water distribution systems.
” In Proc., 16th Conf. on Water
Distribution System Analysis WDSA 2014, 1136
–1143. Bari, Italy:
Procedia Engineering.
Scarpa, F., A. Lobba, and G. Becciu. 2016.
“Elementary DMA design of
looped water distribution networks with multiple sources.
” J. Water
Resour. Plann. Manage. 142 (6): 04016011.
https://doi.org/10.1061
/(ASCE)WR.1943-5452.0000639
.
Thornton, J., R. Sturm, and G. Kunkel. 2008. Water loss control. 2nd ed.
New York: McGraw-Hill.
Tzatchkov, V., V. Alcocer, and V. Bourguett. 2006.
“Graph theory based
algorithms for water distribution network sectorization projects.
” In
Proc., 8th Annual Water Distribution Systems Analysis Symposium.
Reston, VA: ASCE.
USEPA. 2002.
“EPANET 2.00.12.” Accessed May 24, 2016.
https://www
.epa.gov/research
.
Walski, T., et al. 1987.
“Battle of the network models: Epilogue.” J. Water
Resour. Plann. Manage. 113 (2): 191
–203.
https://doi.org/10.1061
/(ASCE)0733-9496(1987)113:2(191)
.
Water Loss Task Force. 2007. District metered areas management
guidance notes. London: International Water Association.
© ASCE
04019002-12
J. Water Resour. Plann. Manage.
J. Water Resour. Plann. Manage., 2019, 145(4): 04019002
Downloaded from ascelibrary.org by Universidad de los Andes on 03/08/22. Copyright ASCE. For personal use only; all rights reserved.
