
water
Article
A New Multi-Criteria Decision Analysis Methodology
for the Selection of New Water Supply Infrastructure
Henry Amorocho-Daza
1
, Sergio Cabrales
2
, Raquel Santos
3
and Juan Saldarriaga
4,
*
1
Water Distribution and Sewerage Systems Research Center (CIACUA), Universidad de los Andes,
Carrera 1 Este No. 19A-40, Bogotá 111711018, Colombia; hd.amorocho1052@uniandes.edu.co
2
Department of Industrial Engineering, Universidad de los Andes, Carrera 1 Este No. 19A-40,
Bogotá 111711018, Colombia; s-cabral@uniandes.edu.co
3
Centre for Energy, Petroleum and Mineral Law and Policy CEPMLP, University of Dundee, Ninewells Drive,
Dundee DD1 9SY, UK; r.santosramos@dundee.ac.uk
4
Department of Civil and Environmental Engineering, Water Distribution and Sewerage Systems Research
Center (CIACUA), Universidad de los Andes, Carrera 1 Este No. 19A-40, Bogotá 111711018, Colombia
*
Correspondence: jsaldarr@uniandes.edu.co
Received: 7 March 2019; Accepted: 30 March 2019; Published: 18 April 2019
Abstract:
Reliable and safe access to drinking water is necessary to ensure the economic and
social sustainable development of human communities. This task requires a multi-criteria decision
analysis (MCDA) methodology to select alternatives for new water supply infrastructure. These
alternatives represent significant financial resources and are established for a long lifespan. To support
decision-making in the context of building new water supply infrastructure, this study developed an
MCDA methodology that integrates a hierarchy of non-economic benefits and the expected costs into
a global index. Our methodology was implemented in the city of Santa Marta, Colombia. This city
currently has a 60% drinking water shortage, and urgently needs to expand its capacity to satisfy the
increasing water demand. The results of this study support the implementation of the best alternative
for addressing Santa Marta’s water supply problem by considering the preferences of stakeholders.
Keywords:
multi-criteria decision analysis; analytical hierarchy process; water supply infrastructure
1. Introduction
Providing access to drinking water is a global challenge; it guarantees the quality of life and
economic development [
1
]. The United Nations [
2
] stated that “the right to safe drinking water and
sanitation is a human right essential to the full enjoyment of life and all human rights,” and, therefore,
states and international organizations must provide the necessary financial resources to guarantee
them. Conversely, UNICEF and the World Health Organization (WHO) [
3
] estimate that 1.8 billion
people have access to water that is unfit for human consumption, 663 million people do not have access
to safe drinking water sources, and 2.4 billion people lack access to basic sanitation. As a result, major
challenges exist to guaranteeing this right to a significant portion of the global population, particularly
in developing nations [
4
].
Currently, more than 2 billion people in the world have significant restrictions on the access to
potable water supply [
5
]. First, the availability of water over time is derived from the relationship
between supply and demand; increases in demand relative to supply put pressure on the resource
availability. Therefore, a relevant approach to quantifying the pressure on water sources is the
ratio between the water withdrawn for di
fferent purposes (agriculture, industry, and domestic) and
the total renewable water resources. A higher proportion of use indicates that the pressure on the
resource increases, and it is substantially more di
fficult to satisfy an increasing demand for water [
6
].
Water 2019, 11, 805; doi:10.3390
/w11040805
www.mdpi.com
/journal/water

Water 2019, 11, 805
2 of 23
According to the United Nations World Water Assessment Program (WWAP) [
7
], major pressure is
exerted on water sources in the United States, North Africa, Middle East, Australia, India, and China.
This pressure causes a condition in which approximately two thirds of the world’s population will live
in water-stressed countries by 2025 [
8
].
In addition to problems of availability, water supply also depends on the economic, institutional,
and quality of resource factors [
7
]. Economic factors relate to water scarcity due to a lack of
infrastructure—due to technical or financial constraints—independent of the availability of water.
According to the Food and Agriculture Organization of the United Nations (FAO) [
9
], institutional
factors arise when institutions are unable to ensure a safe, equitable, and reliable drinking water
supply to users. Similarly, water quality is a restriction caused by the elevated costs of treating water
from highly contaminated sources [
10
,
11
]. Note that the problems associated with the availability of
drinking water in Latin America, Sub-Saharan Africa, and South Asia are primarily economic, whereas
Africa, India, and China have an increased risk in relation to the water quality in watersheds. This
finding implies an increase in the risks to human health, economic development, and ecosystems [
12
].
The demand for drinking water will proportionally increase as the world population increases.
According to projections by the United Nations Department of Economic and Social Affairs (UNDESA) [
13
],
the global population is expected to increase by approximately 32% between 2014 and 2050—from 7.24
billion people to 9.55 billion people. The population living in urban areas is estimated to increase by 64%
between 2014 and 2050—from 3.88 billion people to 6.34 billion people. According to the Organization
for Economic Co-operation and Development (OECD) [
14
], these population dynamics will cause an
escalation in the global drinking water demand of approximately 55%, and an increase of more than
130% and 400% for the domestic demand and industrial demand, respectively, by 2050.
Additionally, in a scenario of increasing water scarcity, proper management of the water supply
network becomes fundamental. According to Pietrucha-Urbanik and ˙Zelazko [
15
] failures on water
networks are the principal operating problems of potable water supply systems. In this line, the WHO
has proposed the implementation of water security plans (WSP) in order to systematically assess and
manage the risks of water supply from source to consumer [
16
,
17
]. Consequently, is necessary to
identify, analyze, and make operative and strategic decisions to reduce the water supply network’s
failure frequency in order to minimize service interruptions and meet water quality standards to
protect the final user [
15
,
16
,
18
].
Consequently, water resources management is a complex task that is aimed at ensuring economic
development and improving the quality of life of people in subsequent decades [
19
]. The proposed
solutions to ensure water supply must be linked to adequate infrastructure and strong institutional
management that is focused on guaranteeing the sustainability of this resource. Several criteria must be
considered to represent the non-economic benefits of new water supply infrastructure (e.g., operational
time, infrastructure setup, operational risk, social and environmental factors). The complexity of
the decision-making problems in water supply systems requires the integration of multiple criteria,
models, and data sources [
20
], which confirms that the use of multi-criteria decision analysis (MCDA)
is a suitable approach for addressing water resources planning and management problems, including
the identification and selection of new water supply infrastructure [
21
]. MCDA methodologies have
been employed in water sustainable management applications, such as water resources sustainability
in the context of watershed management [
22
–
24
], urban drainage planning and management [
25
–
28
],
and wastewater infrastructure planning and usage [
29
,
30
].
This paper is aimed at developing a methodology based on MCDA to improve the decision-making
process for the selection of new water supply infrastructure that separately considers economic and
non-economic criteria. This approach simplifies the global evaluation of alternatives and enables
stakeholders to select an option given their economic restrictions or preferences. During the research
for this paper, we discovered that many of the applications of MCDA for water supply infrastructure
decisions have included economic criteria as part of the problem’s main hierarchy. However, none of the
investigated applications treated the economic criteria separately from the non-economic criteria. The use

Water 2019, 11, 805
3 of 23
of four main non-economic criteria is proposed; the criteria are adaptable to other possible applications:
operational time, infrastructure setup, operational risk and socio-environmental considerations. These
additional criteria cover the global objective of providing a feasible and sustainable new water supply to
a municipality, which is an assumption in this research. This structured methodology represents a new
approach to address this type of decision-making problem. The proposed methodology is illustrated
with a case study in the city of Santa Marta, Colombia, which has a water shortage and urgently needs
to build new water supply infrastructure. The proposed methodology supported the decision-making
process that facilitated the selection and future implementation of the alternative that will address Santa
Marta’s water supply problem.
2. Literature Review
MCDA is a structured approach for measuring the performance of alternatives that are based
on multiple attributes [
31
]. The di
fferent methods that fall within this category can support the
decision analysis process for issues in which more than one criterion—also known as attribute—is
simultaneously evaluated [
32
]. These decision analysis tools enable the inclusion of relative importance,
or weight, for each criterion. The weight is used to rank the performance of the alternatives to be
implemented against the selected criteria [
33
]. These methods have the potential impact of improving
transparency, auditability, and analytical rigor of decision-making processes in complex contexts [
34
].
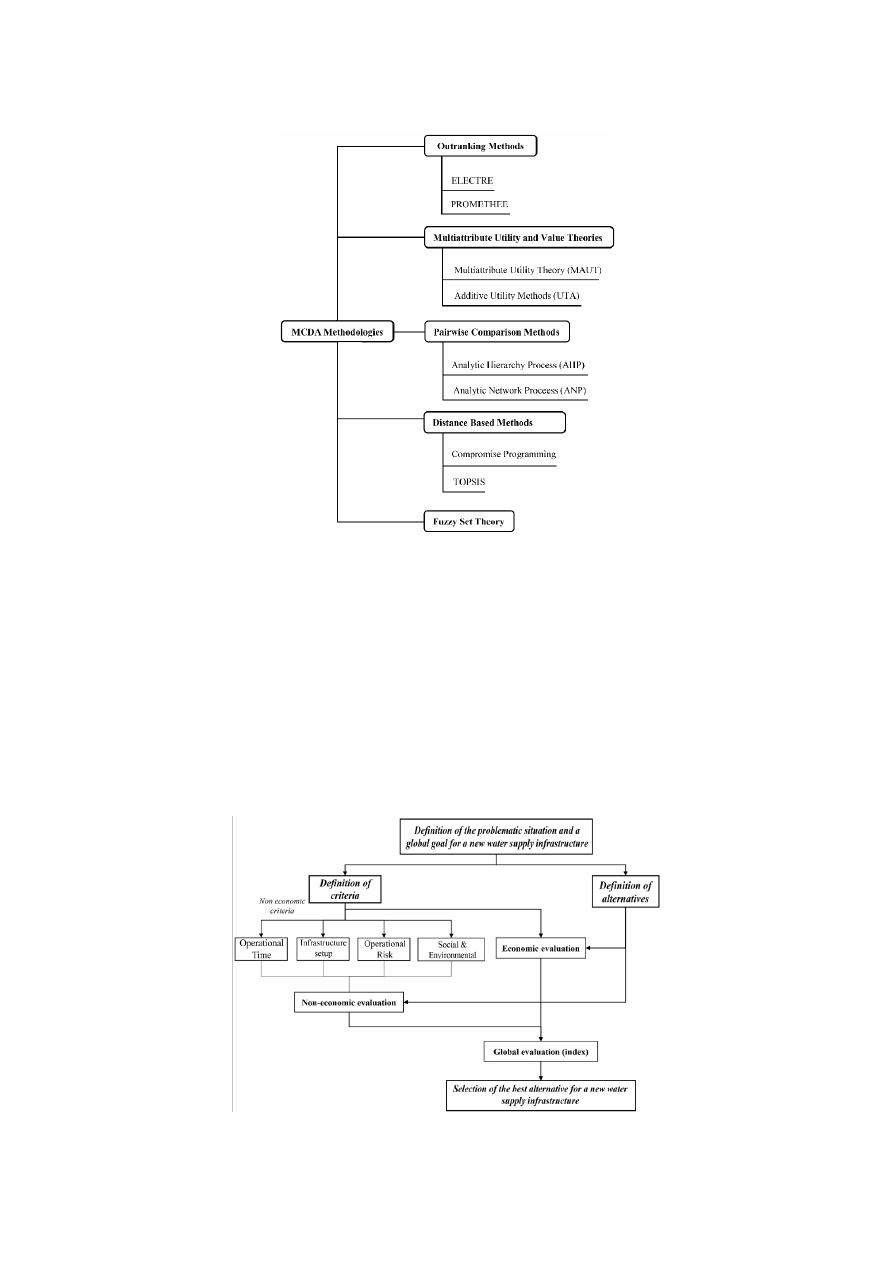
Several MCDA techniques are discussed in the literature. Figueira et al. [
35
] developed an
exhaustive state of the art of this field, as presented in Figure
1
. MCDA techniques can be classified in
categories such as outranking methods, multi-attribute utility and value theories (MAUT and MAVT),
pairwise comparison methods, distance based methods, and fuzzy set theory. MCDA methodologies
and their implementation is a relevant research field, given its impact on improving the decision-making
process in complex environments and problems. Numerous MCDA techniques provide decision
makers and analysts the opportunity to properly and e
ffectively address decision problems.
MCDA has been extensively applied to support decision-making processes for issues related to the
management and planning of water resources [
31
,
32
,
36
], for example, in several urban water supply
case studies. Kabir et al. [
37
] reviewed more than 300 published MCDA methods for infrastructure
management from 1980–2012, including 68 water resources systems applications. These publications
included an extensive distribution of methods, including ELECTRE, PROMETHEE, MAUT, analytic
hierarchy process (AHP), technique for order of preference by similarity to ideal solution (TOPSIS),
compromise programming (CP) and combined methods.
MAUT and MAVT are well-known MCDA methods that have been implemented in various urban
water planning infrastructure cases. Lienert et al. [
21
] developed a structured decision-making (SDM)
procedure to guarantee the sustainability of water infrastructure planning, which is critically based on
the stakeholder feedback and four scenarios, using a MAUT approach in a Swiss case study. Similarly,
Scholten et al. [
38
] employed a MAUT model to consider the preference of ten diverse stakeholders to
rank and evaluate the uncertainty of eleven water supply infrastructure alternatives for the region of
Mönchaltorfer Aà, Switzerland.
One of the most extensively used pairwise comparison methods is the AHP. Okeola and Sule [
39
]
used an AHP approach to select the best of three management operation alternatives for a new urban
water supply scheme in the city of Offa, Nigeria. The conclusion was that the best management option
for the system was public ownership and operation. Likewise, Jaber and Mohsen [
40
] implemented
an AHP approach to evaluate non-conventional water resources supply alternatives to ensure water
availability and sustainability in Jordan. They also concluded that desalination and water harvesting
were superior to treated wastewater and water importation as potential solutions for water scarcity in
the country.
Water 2019, 11, 805
4 of 23
Water 2019, 11, x FOR PEER REVIEW
4 of 23
Figure 1. General multi-criteria decision analysis (MCDA) technique classification, adapted from
Figueira et al. [35].
Other methodologies, such as CP and PROMETHEE, have also been implemented in urban
water infrastructure decision-making and other water resources management applications.
Abrishamchi et al. [41] proposed the CP approach to guide decision makers in the selection of the
best alternative of water infrastructure intervention in the city of Zahidan, Iran. Additionally,
Kodikara et al. [42] developed a PROMETHEE outranking method to evaluate alternative operating
rules for urban water supply reservoir systems in Melbourne, Australia.
3. Methodology Based on MCDA to Improve the Decision-Making Process for the Selection of
New Water Supply Infrastructure
The methodology proposed is summarized in Figure 2.
Figure 2. Methodology summary.
Figure 1.
General multi-criteria decision analysis (MCDA) technique classification, adapted from
Figueira et al. [
35
].
Other methodologies, such as CP and PROMETHEE, have also been implemented in
urban water infrastructure decision-making and other water resources management applications.
Abrishamchi et al. [
41
] proposed the CP approach to guide decision makers in the selection of the
best alternative of water infrastructure intervention in the city of Zahidan, Iran. Additionally,
Kodikara et al. [
42
] developed a PROMETHEE outranking method to evaluate alternative operating
rules for urban water supply reservoir systems in Melbourne, Australia.
3. Methodology Based on MCDA to Improve the Decision-Making Process for the Selection of
New Water Supply Infrastructure
The methodology proposed is summarized in Figure
2
.
Water 2019, 11, x FOR PEER REVIEW
4 of 23
Figure 1. General multi-criteria decision analysis (MCDA) technique classification, adapted from
Figueira et al. [35].
Other methodologies, such as CP and PROMETHEE, have also been implemented in urban
water infrastructure decision-making and other water resources management applications.
Abrishamchi et al. [41] proposed the CP approach to guide decision makers in the selection of the
best alternative of water infrastructure intervention in the city of Zahidan, Iran. Additionally,
Kodikara et al. [42] developed a PROMETHEE outranking method to evaluate alternative operating
rules for urban water supply reservoir systems in Melbourne, Australia.
3. Methodology Based on MCDA to Improve the Decision-Making Process for the Selection of
New Water Supply Infrastructure
The methodology proposed is summarized in Figure 2.
Figure 2. Methodology summary.
Figure 2.
Methodology summary.

Water 2019, 11, 805
5 of 23
3.1. Definition of the Problematic Situation and a Global Goal for New Water Supply Infrastructure
The first step in the methodology is to describe the context, scope, and boundaries of the drinking
water problem [
21
]. As suggested by Clemen and Riley [
43
], three principles must be fulfilled to obtain
the correct decision-making context: (1) the decision context must capture the current situation (“Are
you addressing the right problem?”); (2) the decision ownership must match the decision context (“Do
you have the authority to make the decision within the specified context?”); and (3) the feasibility of
the study (“Will you be able to perform the necessary study and analysis in the time allotted with
the available resources?”). In addition to fulfilling these principles, our methodology suggests that
a group of experts and stakeholders evaluate the current status of the water supply infrastructure
system. This evaluation should present descriptive statistics that consider current and future demand
and the expected drinking water shortage for the municipality. After the supply and demand trends
are determined, the failures, weaknesses, opportunities, and population needs must be assessed. Once
these items have been evaluated, the experts must envision a global goal for the new water supply
infrastructure that satisfies the ongoing and future drinking water requirements for the city.
3.2. Definition of Criteria
As the water supply infrastructure serves to satisfy several purposes and has di
fferent benefits
and costs, the criteria against which the performance of the system is going to be assessed must be
defined [
44
]. These criteria depend on the context of every particular situation. However, a common
approach has been to consider social, technical, environmental, and economic aspects, such as the
main criteria [
39
,
41
,
45
]. As suggested by Saaty [
46
], the analysis of the problems in this research will
be separated into two main groups: non-economic criteria and economic criteria.
Non-economic Criteria
The non-economic criteria to be used in this methodology are defined as operational time,
infrastructure setup, operational risk, and socio-environmental criteria. These criteria attempt to
represent the complexity of constructing these systems and the tradeo
ffs when several alternatives
are considered. The characterization of these criteria is flexible for each problem of building new
water supply infrastructure; thus, the stakeholders should define sub-criteria that further describe the
non-economic criteria proposed in this paper.
The operational time criterion captures the importance of providing water as soon as possible to
satisfy the demand or avoid shortages. This criterion has special importance in developing countries,
where the current infrastructure is often either unable to provide a sufficient amount of drinking water
to the inhabitants, or does not even exist. The duration of the construction phase of each potential
alternative differs depending on the water treatment facilities and geographic conditions. If the duration
of a civil project is excessive, the population will not be able to obtain a sufficient amount of safe water
over a longer period. If the water supply is adequate but is forecast to be insufficient within a certain
period, the durations of the new projects or expansions should be appropriate to avoid water scarcity in
the municipality.
Infrastructure setup is a fundamental criterion for water supply that refers to the operational
characteristics of different alternatives.
To provide water in municipalities and communities,
the construction of infrastructure is necessary; however, many approximations depend on the purpose
of the system. For example, if you want to build a centralized water supply system for a big city,
the technology for treatment and distribution would radically differ when compared with decentralized
facilities in a smaller town. For the case of centralized systems, the operational ease should be considered.
If the system has fewer treatment plants and pumping stations, it is easier to manage. Evaluating the
possibility of future expansions is also important to satisfy future water demand and adapt the treatment
facilities over time.

Water 2019, 11, 805
6 of 23
Risk is commonly defined as the frequency and severity of losses arising from each alternative
of the system in its uncertain environment [
47
]. Operational risk has been defined by the Basel
Committee as the risk of losses arising from problems from internal controls, systems, people, and
external events [
48
]. For the selection of new water supply infrastructure, the operational risk criterion is
concerned with ensuring a system’s reliability to obtain sufficient water from surface and groundwater
sources. In addition, vulnerability is defined as the characteristics of the severity of water deficits if a
failure occurs [
49
]. This criterion is relevant for reducing the water distribution system’s vulnerability by
decreasing the network’s maximum pressure and increasing redundancy, that is, the number of water
conduction lines. Another common operational risk, especially in developing countries, is sabotage to the
water infrastructure. For example, the risk of water adduction losses is proportional to the accessibility
of the adduction pipelines to the population. Water resources planners must identify and describe the
operational risk depending on the context and the characteristics of the water supply system.
The social and environmental impacts of water supply infrastructure should be considered. These
impacts should be revised in each context, but a common concern is to minimize the area of influence
of the project in social and environmentally protected areas, such as national parks or cultural reserves
(e.g., indigenous reserves). Reducing the environmental impact of the construction process is desirable.
A suggested method for measuring these impacts is to reduce the conduction line length; this method
will decrease the impact on the vegetation coverage. Another method is to reduce the percentage of
water withdrawn from rivers, to guarantee its ecological flows. As a special case, if the water supply
infrastructure is going to satisfy the demand of a large city, the possibility of supplying water to small
surrounding municipalities should be considered to maximize the local economic development [
50
].
3.3. Economic Evaluation
In addition to assessing the water supply alternatives against the previously discussed criteria,
their respective costs should be evaluated. An appropriate estimation of these costs must include the
construction and operation of the system. Numerous calculation methods are available to estimate
the economic performance of the alternatives [
45
,
51
]. For this decision problem, however, we suggest
evaluating the present value of the costs (PVC) instead of the net present value (NPV), because
the estimated earnings of the project during its lifecycle should represent a cost recovery for water
suppliers using a typically regulated water distribution tari
ff [
52
]. The PVC includes construction and
operation costs. The main operative costs for drinking water systems are pumping and treatment
equipment. Given the variety of water sources, treatment requirements, topographical conditions, and
general planning, a relevant and dynamic di
fference exists in the variable costs among the alternatives.
This di
fference represents an effort to estimate the financial performance for every alternative during
the project lifecycle.
3.4. Definition of Alternatives
The next step is to determine the alternatives that can potentially satisfy the problem. Each alternative,
or option, must represent a feasible and suitable resolution to the problem of the water supply, considering
the financial, social, and environmental restrictions [
53
]. To maximize the diversity and relevance of
the alternatives to consider, they should be proposed by the dialogue and discussion of different
stakeholders [
21
]. Once the water supply alternatives are selected, they will be evaluated against the
previously defined criteria.
3.5. Non Economic Evaluation
Because the evaluation of the best alternative based on non-economic criteria is complex, this
decision-making process should be supported with a MCDA model. As noted, numerous MCDA
approaches are available in the academic literature; the majority of these approaches have been
increasingly applied during the last 20 years, particularly in the context of water resources planning
and management [
54
]. The selection of the model should also be performed via agreement among

Water 2019, 11, 805
7 of 23
stakeholders, to ensure that they are satisfied with the manner in which the model operates (i.e.,
assumptions, scales of preference, weighting and ranking) to subsequently implement its results [
35
].
The results obtained from the MCDA technique should be presented in a ranking of the alternatives.
The alternatives must be evaluated against the previously defined criteria and subcriteria. Depending
on the selected MCDA method, this evaluation can include objective and subjective assessment and
perceptions. After the alternatives have been ranked, a sensitivity analysis should be performed.
A sensitivity analysis helps to determine the robustness of the decision model. In a sensitivity
analysis, various scenarios can be investigated; for example, how a change in the weight of the criteria,
the inclusion of new criteria or the exclusion of applied criteria can impact the results.
3.6. Global Evaluation
For every decision, positive and negative factors to contemplate are usually psychologically
interpreted in the form of benefits (gains) and costs (losses) [
55
]. The evaluation of a decision according
to these factors is not easily directly performed. Saaty [
56
] suggests creating a cost hierarchy to
paired comparisons with judgments using a scale of 1–9. However, we alternatively propose a direct
estimation of the present value of the total cost (PVC), including OPEX and CAPEX.
Based on the four control merits of the benefits (B), opportunities (O), costs (C), and risks (R)
formula proposed by Saaty [
46
], we suggest a simplification of his formula, which employs only
benefits (B) and costs (C). Formula (1), which is proposed for this decision-making problem, is an
alternative to the traditional marginal return (B
/C), and is useful when both B and C have the same
order of magnitude [
46
]. We globally evaluated each alternative by combining the normalized benefits
(B) and normalized costs (C), as shown in Equation (1):
I
i
= (
1 − w
C
)
·B
N
i
− w
C
·C
N
i
, ∀ i ∈ A
(1)
where I
i
is the value of the index for alternative i; w
C
is the weight given to the costs; B
N
i
is the
normalized benefits; C
N
i
is the normalized costs for alternative i, respectively; and A is the set of
alternatives. The range of the performance index will vary between −1 and 1.
3.7. Selection of the Best Alternative for Water Supply Infrastructure
The goal of the decision-making methodology presented in this research is to identify the best
alternative for new water supply infrastructure, given the stakeholder preferences and the structure of
the decision problem. Once the ranking of alternatives has been established, a decision maker should
have su
fficient information to determine the best alternative and proceed to its implementation to
address the water supply problem.
4. Case Study: City of Santa Marta, Colombia
4.1. Definition of the Problematic Situation and a Global Goal for New Water Supply Infrastructure
Santa Marta is located in the Magdalena region in the northern coast of Colombia; it is currently
experiencing serious problems regarding its water supply. In an average season, the inhabitants require
2.21 m
3
/s of water; however, the water supply is approximately 1.55 m
3
/s, that is, nearly 30% less
of the required water supply. During the dry season, the supply can be as low as 0.88 m
3
/s, which
represents an approximately 60% shortage [
57
]. This scarcity has prompted the local water service
provider to implement temporary solutions, including the distribution of drinking water via tanker
trucks. Problems such as watershed deterioration—and its associated river flow reduction—decreased
rainfall, illegal water collection, and rapid demographic growth contribute to this shortage.
Santa Marta has two potable water treatment plants (PWTPs), which are connected to a water
distribution network that encompasses 79% of households [
58
]. The Mamatoco PWTP is the principal
plant; it treats approximately 0.8 m
3
/s from the Manzanares and Piedras Rivers—nearly 20% of its

Water 2019, 11, 805
8 of 23
capacity—but associated river flow rates do not enable a full operation capacity. Similarly, the El
Roble PWTP treats approximately 0.45 m
3
/s from the Gaira River and does not operate at full capacity.
In addition to the surface water sources, the city has an aquifer from which the local water service
provider can extract 0.3 m
3
/s during dry months without risk of seawater intrusion [
58
]. However,
several non-controlled wells extract an unknown amount of water, which can compromise the water
quality of the aquifer.
Anticipated rapid population growth will exert additional pressure on the city’s water supply
capacity in subsequent years. Santa Marta is an important tourist destination, with more than
500,000 inhabitants and approximately 51,000 additional tourists during peak seasons. The permanent
population is expected to experience geometric growth at a rate of 2.82% every year for the next 50
years. The total population during peak tourism and low tourism season is expected to increase at
a rate of 2.93% and 2.86%, respectively [
58
]. By 2040, the population is expected to double to nearly
980,000 permanent inhabitants and a floating tourist population of 133,000. Similarly, by 2065 the total
population in the city will exceed 2.2 million. In less than 50 years, the city must be able to provide
drinking water to a population that is four times larger than the current population. Considering
that the demand is 0.15 m
3
per person per day, the city must provide an increasing water supply of
approximately 5.7 m
3
/s by 2065 [
57
].
For this case study, the judgments and preferences of eight experts in water management problems,
particularly drinking water and basic sanitation issues in Colombia, were collected. These eight
experts are stakeholders with academic, government, and local water service provider backgrounds.
The academic experts included the project director of the Santa Marta’s strategic water supply planning
research and a professor of the Aqueduct and Sewage Research Center (CIACUA) at the Universidad
de Los Andes. The three government experts included a project evaluator from the water and sanitation
o
ffice at Financial Entity for the Territorial Development (Findeter S.A.), a project manager, and an
o
fficial from the Vice-Ministry of Water and Sanitation of Colombia. The engineering planning chief,
the general director and the technical director of the Santa Marta’s water utility, Metroagua S.A E.S.P.,
were involved in the decision-making process.
4.2. Definition of Criteria
Table
1
defines the hierarchical structure of the non-economic criteria and sub-criteria. The goal of
the decision problem is described at the top of the hierarchy: to determine the best alternative for the
construction of a new water supply infrastructure for the city. Level 2 of the hierarchy includes the
main non-economic criteria: operational time, infrastructure setup, operational risk, and social and
environmental criteria. Level 3 of the hierarchy includes the sub-criteria within each main criterion.
Similarly, Level 4 represents the second level of the sub-criteria for the Level 3 sub-criterion.
4.3. Definition of Altermatives
Generation of the alternatives requires an understanding of the water sources to be considered.
The project’s team developed studies that consider the hydrological, meteorological, topographical,
and legal aspects related to the benefits and limitations of the possible water resources (e.g., rivers,
groundwater, and seawater). Subsequently, the group of stakeholders (e.g., government, university,
and water utility) joined in several sessions to discuss and select a reasonable combination of water
sources that compiled the group of feasible alternatives to be subsequently evaluated using the MCDA
based methodology. Strengthening the current system capacity by providing water from several
additional sources, including various rivers and even from the Caribbean Sea, has been proposed.
Seven alternatives have been proposed by the stakeholders to address the current water shortage
condition in the city and guarantee its drinking water requirements during the next 50 years. As the
criteria and alternatives have been identified, the next step is to create a matrix to be populated with
the corresponding information.
Table
2
shows the matrix populated with the information.

Water 2019, 11, 805
9 of 23
Table 1.
Global goal, criteria, and sub-criteria description.
Goal
Criteria
First Level
Sub-Criteria
Second Level
Sub-Criteria
Description
Find
the
best
alternative
of
new
water
supply
infrastructure
for
Santa
Marta,
Colombia
Operational time
Reduce time for
operation
beginning
Time in which the first stage of
alternative will be in operation
Reduce time to
meet water
demand
Time in which the demanded water is
equal to the water supplied in the city
Infrastructure
setup
Ensure operational
ease
Reduce number of
potable water
treatment plants
(PWTP)
Number of PTWP and its required
expansions
Reduce number of
pumping stations
Number of pumping stations required
Provide the
possibility to have
future expansions
Possibility to have additional
expansions at the end of the planning
horizon
Operational risk
Ensure system
reliability
Related to the water availability and
water withdrawals from rivers, this is
the relationship between the minimal
flow rate of the rivers and the water
supply required by the end of the
planning horizon
Reduce system
vulnerability
Reduce network
maximum pressure
Estimated network pressure
Increase the
number of water
conduction lines
Conduction lines required by the
alternative
Reduce the risks of
losses during
adduction
The risk of water adduction losses is
proportional to the accessible area by
population to the adduction pipelines
Social and
environmental
Minimize influence
area at National
Parks
The intersection area between a 100 m
influence area of the alternative route
and the area of the National Parks
Minimize influence
area at indigenous
reserves and sacred
sites
The intersection area between a 100 m
influence area of the alternative route
and the area of indigenous reserves
and sacred sites
Reduce
environmental
impact
Reduce conduction
line length
The impact in the vegetation coverage
is proportional to the conduction line
length
Reduce percentage
of water
withdrawn
This impact is assessed as the ratio
between the flow withdrawals and
the ecological flows of the respective
rivers
Guarantee
possibility of
bringing water to
surrounding
municipalities
Some alternatives have the possibility
to supply water to small surrounding
municipalities, namely: Ciénaga,
Puebloviejo, Tasajera, and Nueva
Venecia

Water 2019, 11, 805
10 of 23
Table 2.
Matrix.
Alternatives
A1
A2
A3
A4
A5
A6
A7
Time for operation beginning
(years)
3
4
2
2
2
3
2
Time to meet water demand
(years)
5
4
3
4
2
4
3
Water source
Guachacá
Magdalena
Toribio
Guachacá
Magdalena
Caribbean
Sea
Toribio
Córdoba
Caribbean
Sea
Piedras
Toribio
Toribio
Buritacá
Guachacá
Córdoba
Don Diego
Córdoba
Buritaca
Buriticá
Magdalena
New PTWP
Curval
Toribio
Toribio
Curval
Toribio
Curval
Desalination Toribio
Curval
Desalination
Curval
Toribio
Toribio
Number of expansions
7
4
5
2
3
1
1
2
1
5
6
1
4
New
Treatment
Capacity at
2064
New Treatment
Capacity per
PWTP (m
3
/s)
6.4
6
4.4
2
5.5
0.4
1
2
0.4
5
7
1
6
Total Treatment
Capacity (m
3
/s)
6.4
6
6.4
6.9
7.4
8
6
Number of pumping stations
13
6
12
10
10
15
6
Possibility of future expansions
No
Yes
No
No
No
Yes
Yes
System reliability (-)
1.9
2.0
1.4
2.0
2.0
1.3
2.0
Estimated Network Maximum
Pressure (PSI)
341
262
341
270
99
341
259
Number of conduction lines
4
2
5
3
2
6
6
Pipeline length in populated
area (Km)
0.0
11.9
0.0
17.9
0.0
0.0
11.9
Influence area at National
Parks (Ha)
1.7
834.7
0.2
14.1
0.1
0.2
582.2
Influence area at indigenous
reserves and sacred sites (Ha)
986.98
220.42
922.4
220.4
88.2
1048.7
88.2
Conduction line length (Km)
166.07
140.45
124.04
210.68
7.32
128.46
147.80
Percentage of water resources
withdrawn
0.14
0.00
0.59
0.00
0.50
0.64
0.50
Possibility of bringing water to
surrounding municipalities
No
Yes
No
Yes
No
No
Yes

Water 2019, 11, 805
11 of 23
4.4. Non Economic Evaluation
AHP, which was first proposed by Saaty [
56
], is a MCDA methodology that considers objective and
subjective criteria during the decision-making process in complex problems [
55
]. By the AHP, a problem
can be represented using a hierarchical structure. The purpose of the hierarchical structure is to
understand how the alternatives and criteria interrelate in relation to the problem [
33
]. The hierarchical
structure is composed of levels: the first level is the global goal or general objective; the intermediate
levels correspond to the criteria and sub-criteria that enable the global goal to be achieved; and the
alternatives to evaluate are included in the bottom level.
The AHP functions by creating a pairwise comparison, first within each level, and secondly among
the levels, to determine the preferences of decision makers. The first set of pairwise comparisons
is made among the criteria to reflect the preference of a decision maker regarding the usefulness of
each criterion toward solving a decision problem. These preferences are based on the judgment and
knowledge of the decision maker. The values obtained from this first set of pairwise comparisons will
be applied as the weight of each criterion. The second set of pairwise comparisons is a comparison of
alternatives regarding a particular criterion. The third comparison involves multiplying the result of
the second set of pairwise comparison by that of the first set of pairwise comparisons and ranking the
results [
33
]. Because the AHP requires several pairwise comparisons, a common problem is consistency
in the selections. To solve this problem, Saaty [
56
] proposed a consistency ratio to measure the
consistency in the judgements of decision makers. Ratios higher than 0.1 often require re-examination.
Based on this classification, the relative weights of the criteria and alternatives can be estimated
by a mathematical method that is known as estimation of eigenvalues [
55
]. The AHP allows to
show priorities of alternatives relative to the goal using a hierarchical structure. The AHP does not
require the use of complex calculations or computer systems [
33
]. The AHP is a flexible, participatory,
and appropriate methodology to structure complex decision problems and select the best alternative
that successfully satisfies the total objective of a decision problem.
The stakeholder preference was measured using the scale proposed by Saaty [
56
], as shown
in Table
3
.
Table 3.
The scale proposed by Saaty [
56
].
Numeric Rating
Definition
Explanation
1
Equal Importance
Two activities contribute equally to the objective
2
Weak or Slightly More Important
3
Moderate Importance
Experience and judgement slightly favour one
activity over the other
4
Moderate to Strong Significance
5
Strong Importance
Experience and judgement strongly favour one
activity over another
6
Strong to Very Strong
7
Very Strong or Demonstrated
Importance
An activity is favoured very strongly over
another; its dominance demonstrated in practice
8
Very Strong to Extreme
9
Extreme Importance
The evidence favouring one activity over another
is of the highest possible order of a
ffirmation
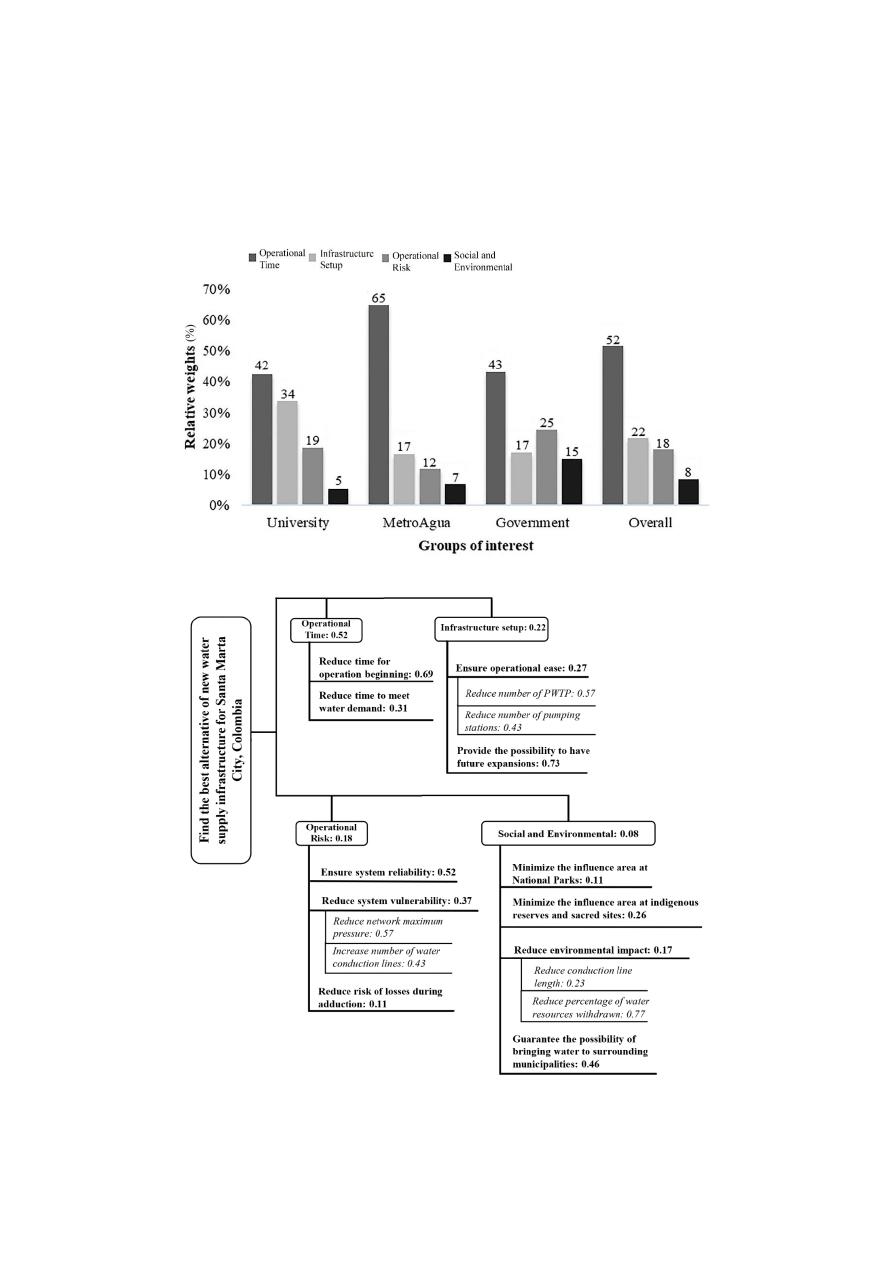
The eight experts completed an online survey; their judgments were pondered in their respective
groups as the geometric average of the recorded values. Figure
3
shows each group’s preference
regarding the main criteria of the decision problem. Although di
fferences exist among the interest
groups, operational time was consistently considered as the most important criterion. Infrastructure
setup was the second most important criterion for all groups, with the exception of Government,
Water 2019, 11, 805
12 of 23
which considered operational risk to be second in importance. A consensus was obtained for Social
and Environmental as the least relevant criteria among the main criteria. The relative weights of the
sub-criteria are presented in Figure
4
. Note that the judgement of the experts was systematically
consistent; thus, every evaluated matrix had a consistency ratio less than 0.1, and the total model a
value of 0.01.
Water 2019, 11, x FOR PEER REVIEW
14 of 23
setup was the second most important criterion for all groups, with the exception of Government,
which considered operational risk to be second in importance. A consensus was obtained for Social
and Environmental as the least relevant criteria among the main criteria. The relative weights of the
sub-criteria are presented in Figure 4. Note that the judgement of the experts was systematically
consistent; thus, every evaluated matrix had a consistency ratio less than 0.1, and the total model a
value of 0.01.
.
Figure 3. Relative criteria weight per group of interest.
Figure 4. Hierarchical structure with relative weights.
Figure 3.
Relative criteria weight per group of interest.
Water 2019, 11, x FOR PEER REVIEW
14 of 23
setup was the second most important criterion for all groups, with the exception of Government,
which considered operational risk to be second in importance. A consensus was obtained for Social
and Environmental as the least relevant criteria among the main criteria. The relative weights of the
sub-criteria are presented in Figure 4. Note that the judgement of the experts was systematically
consistent; thus, every evaluated matrix had a consistency ratio less than 0.1, and the total model a
value of 0.01.
.
Figure 3. Relative criteria weight per group of interest.
Figure 4. Hierarchical structure with relative weights.
Figure 4.
Hierarchical structure with relative weights.
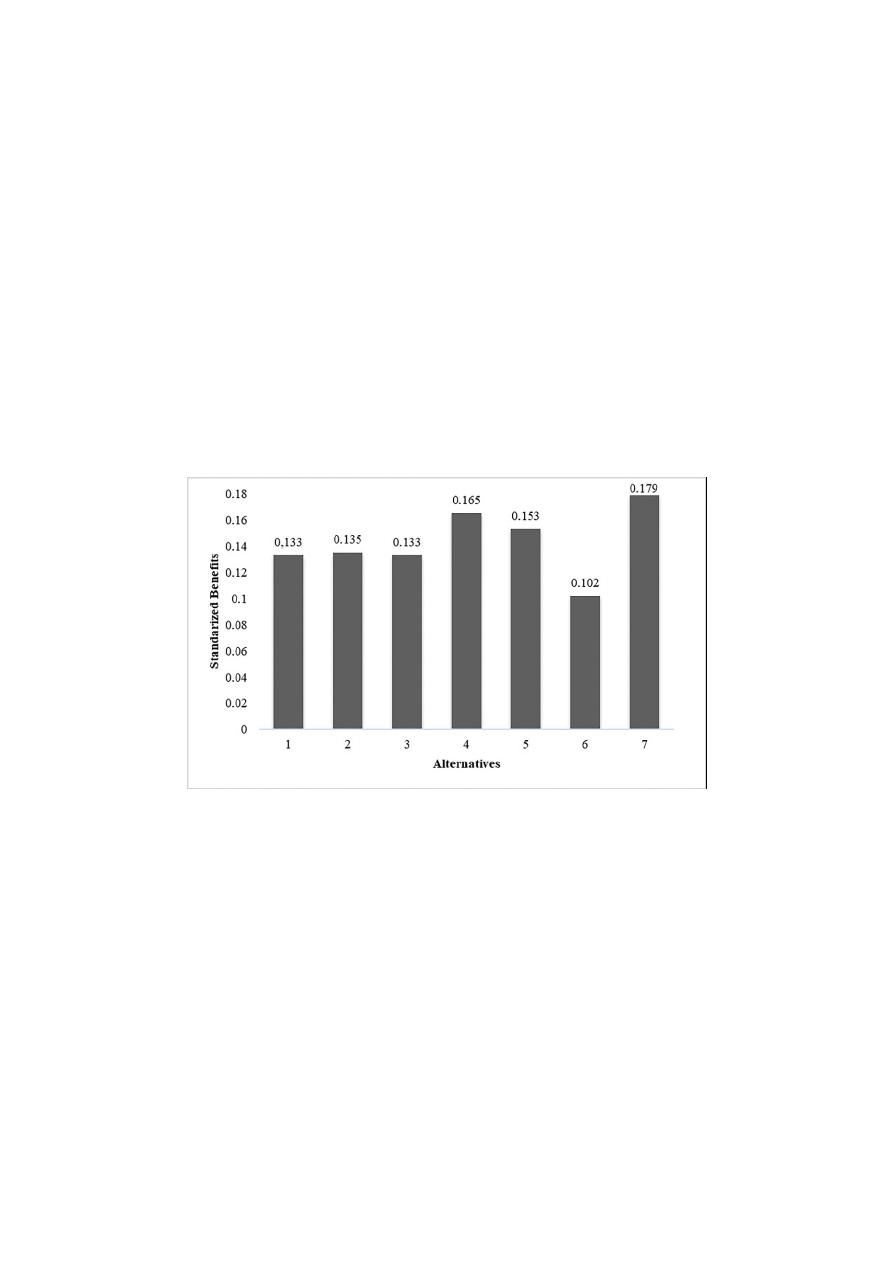
To establish the ranking of alternatives, every alternative must be compiled and weighed
throughout the hierarchical structure. The software Expert Choice 11.5 was used to compile the results
Water 2019, 11, 805
13 of 23
of the decision problem. As shown in Figure
5
, the best option is A7, followed by A4 and A5; in this
order, Alternatives A2, A3, and A1 were similar, and the worst option was A6.
The robustness of the decision model was verified by a sensitivity analysis. Evaluating how the
ranking of alternatives changes as the weight of the main non-economic criteria varies is important.
The decision-making software facilitates the evaluation of the global alternatives performance as a
function of the weight of the main criteria. With respect to the operational time criterion, A7 had the
best performance until the weight of the criterion exceeded 0.79; the second and third places varied
among A2, A4, and A5. In relation to infrastructure setup, A7 performed the best when the weight
exceeded 0.09; the second and third places broadly varied among A1, A2, A4, and A5. Concerning the
operational risk, A7 was the best when the weight was less than 0.67, otherwise A5 performed better.
Regarding the Social and Environmental aspect, A7 was the best for weights below 0.32; however,
A4 performed better when the weight was higher. The sensitivity analysis shows that the ranking
obtained with the preference of a decision maker is generally consistent as the weight of the main
criteria varies. Note that A7 remained the best alternative in most scenarios, even when the weight of
the criteria extensively varied. Conversely, A3 and A6 were never in the first positions of the ranking
during the sensitivity analysis.
Water 2019, 11, x FOR PEER REVIEW
15 of 23
To establish the ranking of alternatives, every alternative must be compiled and weighed
throughout the hierarchical structure. The software Expert Choice 11.5 was used to compile the
results of the decision problem. As shown in Figure 5, the best option is A7, followed by A4 and A5;
in this order, Alternatives A2, A3, and A1 were similar, and the worst option was A6.
The robustness of the decision model was verified by a sensitivity analysis. Evaluating how the
ranking of alternatives changes as the weight of the main non-economic criteria varies is important.
The decision-making software facilitates the evaluation of the global alternatives performance as a
function of the weight of the main criteria. With respect to the operational time criterion, A7 had the
best performance until the weight of the criterion exceeded 0.79; the second and third places varied
among A2, A4, and A5. In relation to infrastructure setup, A7 performed the best when the weight
exceeded 0.09; the second and third places broadly varied among A1, A2, A4, and A5. Concerning
the operational risk, A7 was the best when the weight was less than 0.67, otherwise A5 performed
better. Regarding the Social and Environmental aspect, A7 was the best for weights below 0.32;
however, A4 performed better when the weight was higher. The sensitivity analysis shows that the
ranking obtained with the preference of a decision maker is generally consistent as the weight of the
main criteria varies. Note that A7 remained the best alternative in most scenarios, even when the
weight of the criteria extensively varied. Conversely, A3 and A6 were never in the first positions of
the ranking during the sensitivity analysis.
.
Figure 5. Ranking of alternatives by implementing the AHP model.
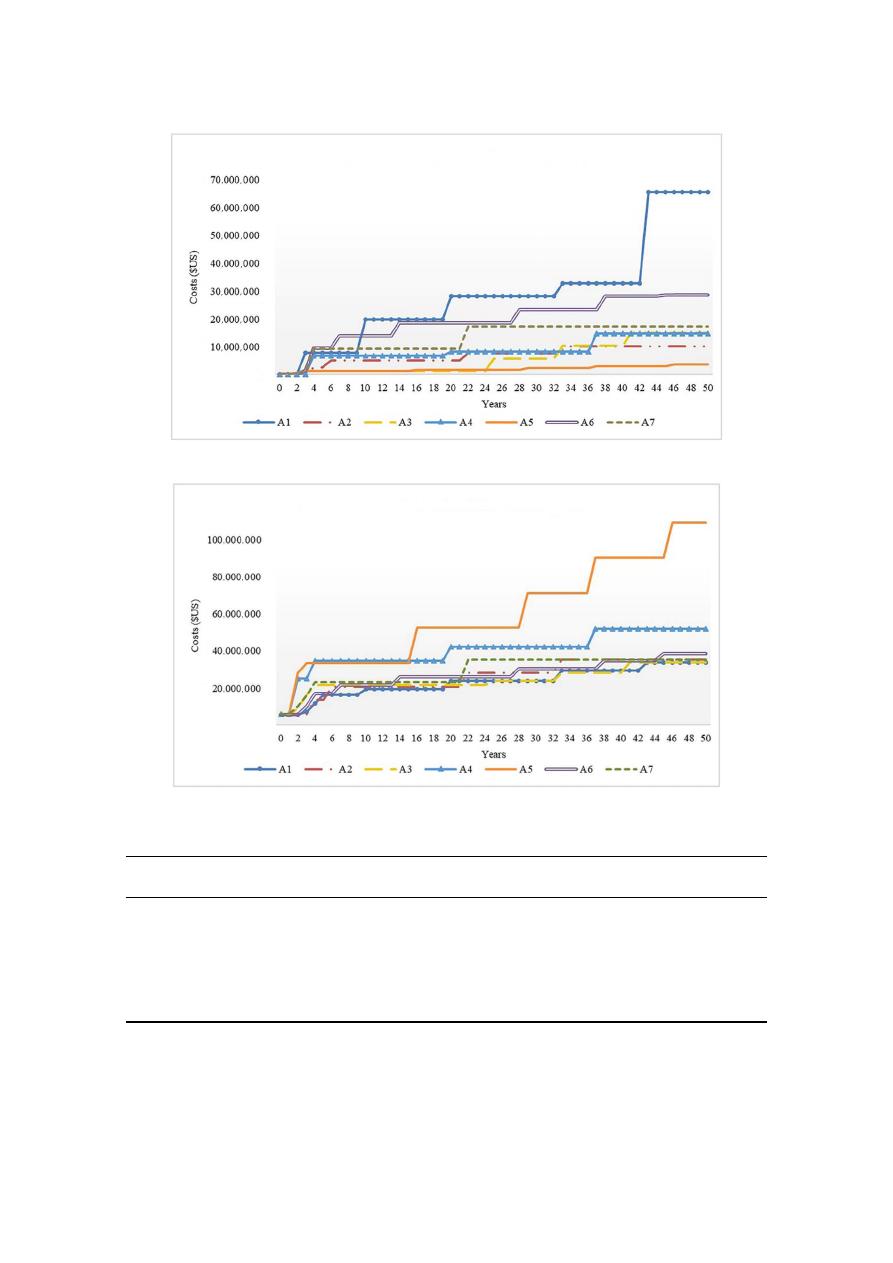
4.5. Economic Evaluation
The estimated annual pumping and treatment costs constitute the main variable cost driver.
These costs were estimated throughout a 50-year planning horizon and are presented in Figure 6 and
Figure 7, respectively. Saldarriaga et al. [58] have estimated the construction costs for each alternative
by considering the costs of excavation, pipelines, pumping stations, and new PWTPs. As shown in
Table 4, the total costs of the alternatives have been valued as the sum of the discounted operative
costs during the project lifespan and the associated constructive costs. In addition to the long
lifespans of water supply infrastructure projects, the operative costs account for the majority of the
total costs and represent the main difference among alternatives.
Figure 5.
Ranking of alternatives by implementing the AHP model.
4.5. Economic Evaluation
The estimated annual pumping and treatment costs constitute the main variable cost driver.
These costs were estimated throughout a 50-year planning horizon and are presented in Figures
6
and
7
, respectively. Saldarriaga et al. [
58
] have estimated the construction costs for each alternative
by considering the costs of excavation, pipelines, pumping stations, and new PWTPs. As shown in
Table
4
, the total costs of the alternatives have been valued as the sum of the discounted operative
costs during the project lifespan and the associated constructive costs. In addition to the long lifespans
of water supply infrastructure projects, the operative costs account for the majority of the total costs
and represent the main di
fference among alternatives.
Water 2019, 11, 805
14 of 23
Water 2019, 11, x FOR PEER REVIEW
16 of 23
Figure 6. Estimated annual pumping costs by alternative.
Figure 7. Estimated annual treatment costs by alternative.
Table 4. Costs summary by alternatives.
Alternatives
PVC of
Treatment (US$)
PVC of Pumping
(US$)
PVC of Variable
Costs (US$)
Construction Costs
(US$)
Total Costs
(US$)
A1
321,827,094
323,299,388
645,126,482
47,440,763
692,567,245
A2
359,423,907
86,292,406
445,716,313
43,313,450
489,029,763
A3
363,610,315
51,672,610
415,282,925
44,998,266
460,281,191
A4
608,286,307
114,545,941
722,832,247
67,357,810
790,190,057
A5
770,633,787
26,119,599
796,753,386
70,747,453
867,500,839
A6
379,643,598
251,435,120
631,078,718
52,857,836
683,936,554
A7
424,633,418
174,198,263
598,831,681
38,782,207
637,613,888
*PVC: present value of the cost.
4.6. Global Evaluation
Figure 8 shows the performance index (PI) for each alternative when varying the weight given
to the cost along its range. Given a certain cost weight, note that the alternative with the highest PI is
the best among its group. The graph illustrates the sensitivity of the ranking to the variation of the
cost weight: A7 remains the best alternative when the weight of the cost criterion is lower than 0.56.
Figure 6.
Estimated annual pumping costs by alternative.
Water 2019, 11, x FOR PEER REVIEW
16 of 23
Figure 6. Estimated annual pumping costs by alternative.
Figure 7. Estimated annual treatment costs by alternative.
Table 4. Costs summary by alternatives.
Alternatives
PVC of
Treatment (US$)
PVC of Pumping
(US$)
PVC of Variable
Costs (US$)
Construction Costs
(US$)
Total Costs
(US$)
A1
321,827,094
323,299,388
645,126,482
47,440,763
692,567,245
A2
359,423,907
86,292,406
445,716,313
43,313,450
489,029,763
A3
363,610,315
51,672,610
415,282,925
44,998,266
460,281,191
A4
608,286,307
114,545,941
722,832,247
67,357,810
790,190,057
A5
770,633,787
26,119,599
796,753,386
70,747,453
867,500,839
A6
379,643,598
251,435,120
631,078,718
52,857,836
683,936,554
A7
424,633,418
174,198,263
598,831,681
38,782,207
637,613,888
*PVC: present value of the cost.
4.6. Global Evaluation
Figure 8 shows the performance index (PI) for each alternative when varying the weight given
to the cost along its range. Given a certain cost weight, note that the alternative with the highest PI is
the best among its group. The graph illustrates the sensitivity of the ranking to the variation of the
cost weight: A7 remains the best alternative when the weight of the cost criterion is lower than 0.56.
Figure 7.
Estimated annual treatment costs by alternative.
Table 4.
Costs summary by alternatives.
Alternatives
PVC of
Treatment (US$)
PVC of
Pumping (US$)
PVC of Variable
Costs (US$)
Construction
Costs (US$)
Total Costs
(US$)
A1
321,827,094
323,299,388
645,126,482
47,440,763
692,567,245
A2
359,423,907
86,292,406
445,716,313
43,313,450
489,029,763
A3
363,610,315
51,672,610
415,282,925
44,998,266
460,281,191
A4
608,286,307
114,545,941
722,832,247
67,357,810
790,190,057
A5
770,633,787
26,119,599
796,753,386
70,747,453
867,500,839
A6
379,643,598
251,435,120
631,078,718
52,857,836
683,936,554
A7
424,633,418
174,198,263
598,831,681
38,782,207
637,613,888
PVC: present value of the cost.
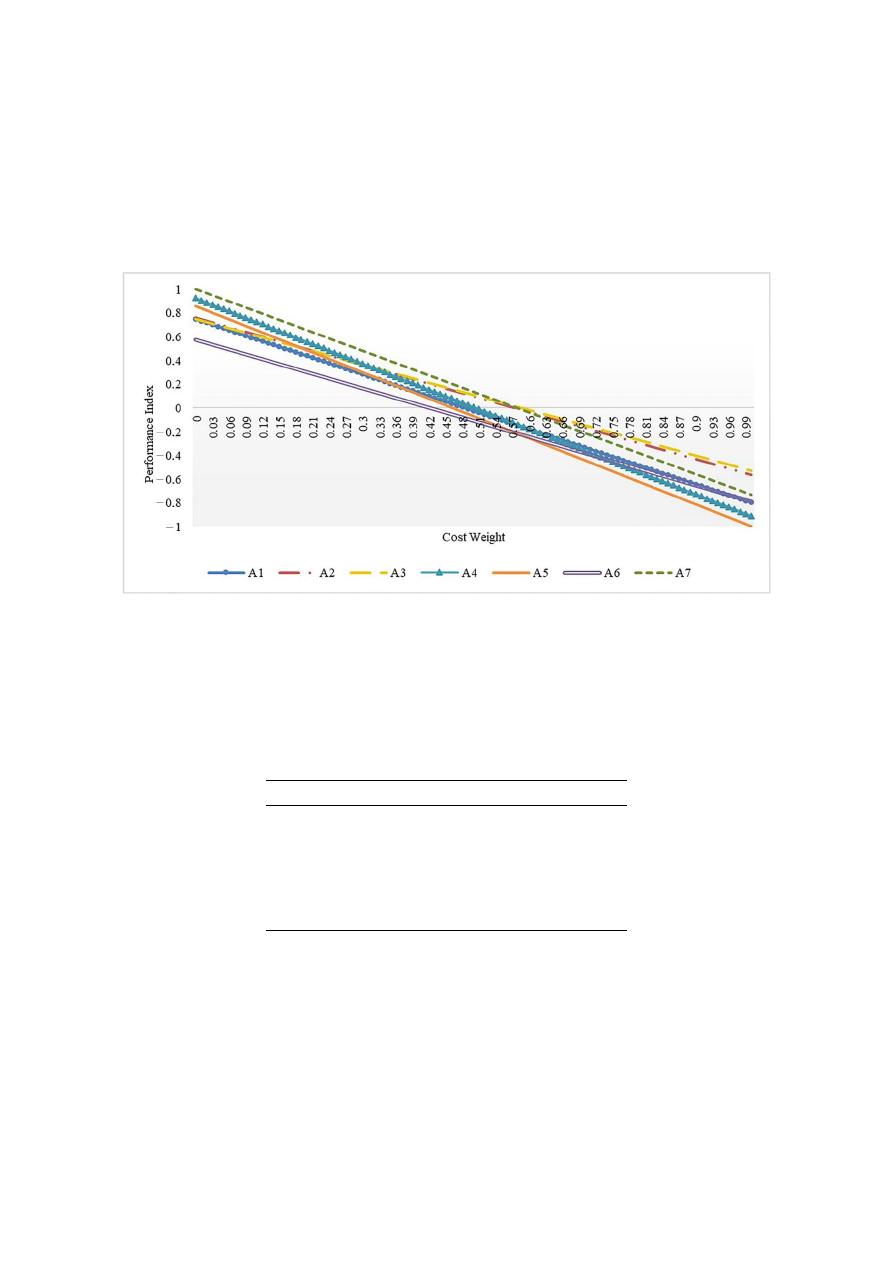
4.6. Global Evaluation
Figure
8
shows the performance index (PI) for each alternative when varying the weight given to
the cost along its range. Given a certain cost weight, note that the alternative with the highest PI is
the best among its group. The graph illustrates the sensitivity of the ranking to the variation of the
Water 2019, 11, 805
15 of 23
cost weight: A7 remains the best alternative when the weight of the cost criterion is lower than 0.56.
However, when the weight exceeds 0.56, A3 and A2 are superior,r due to their lower cost. A4 and A5
rank second and third on the benefits scale but are the most expensive; thus, when the weight given to
the cost criterion exceeds 0.32 and 0.19, respectively, they are exceeded by A3 and A2, which are equal.
A1 and A6, which have poor performance in benefits, improve in the ranking only because they are
less expensive than A3 and A2.
Water 2019, 11, x FOR PEER REVIEW
17 of 23
However, when the weight exceeds 0.56, A3 and A2 are superior,r due to their lower cost. A4 and A5
rank second and third on the benefits scale but are the most expensive; thus, when the weight given
to the cost criterion exceeds 0.32 and 0.19, respectively, they are exceeded by A3 and A2, which are
equal. A1 and A6, which have poor performance in benefits, improve in the ranking only because
they are less expensive than A3 and A2.
Figure 8. Performance index (PI) variation as a function of the cost weight.
Once the weight of the cost criterion is selected, the PI will establish a new ranking of alternatives
that considers both non-economic criteria and economic criteria. In their study, Saldarriaga [58]
determined that the weight of the total costs for this project is 0.22. The ranking is shown in Table 5.
Alternative 7 is at the top of the ranking, followed by A4; A2, A3, and A5 performed similarly in the
intermediate positions; and at the end of the rank, A6 and A1 have the lowest scores.
Table 5. AHP performance index score and rank when the cost weight is 0.22.
Rank Alternative
AHP Performance
Index Score
1
A7
0.618
2
A4
0.519
3
A2
0.466
4
A3
0.465
5
A5
0.448
6
A1
0.406
7
A6
0.272
5. Comparison with Previous Studies
Given the critical situation of Santa Marta’s water supply, Universidad de los Andes, Findeter,
and Metroagua S.A E.S.P collaborated to develop studies with the purpose of strengthening the city’s
water infrastructure for the next 50 years. The product of this research was subsequently published
by Saldarriaga et al. [58] in a report that includes demographic and water demand forecasts, an
anthropologic study, a characterization of surface and underground sources of water, a water
network optimization, and an alternatives evaluation. This study seeks to complement this previous
study and strengthen the tools that support the decision-making process of water resources
management for the city.
Figure 8.
Performance index (PI) variation as a function of the cost weight.
Once the weight of the cost criterion is selected, the PI will establish a new ranking of alternatives
that considers both non-economic criteria and economic criteria. In their study, Saldarriaga [
58
]
determined that the weight of the total costs for this project is 0.22. The ranking is shown in Table
5
.
Alternative 7 is at the top of the ranking, followed by A4; A2, A3, and A5 performed similarly in the
intermediate positions; and at the end of the rank, A6 and A1 have the lowest scores.
Table 5.
AHP performance index score and rank when the cost weight is 0.22.
Rank
Alternative
AHP Performance Index Score
1
A7
0.618
2
A4
0.519
3
A2
0.466
4
A3
0.465
5
A5
0.448
6
A1
0.406
7
A6
0.272
5. Comparison with Previous Studies
Given the critical situation of Santa Marta’s water supply, Universidad de los Andes, Findeter,
and Metroagua S.A E.S.P collaborated to develop studies with the purpose of strengthening the city’s
water infrastructure for the next 50 years. The product of this research was subsequently published by
Saldarriaga et al. [
58
] in a report that includes demographic and water demand forecasts, an anthropologic
study, a characterization of surface and underground sources of water, a water network optimization,
and an alternatives evaluation. This study seeks to complement this previous study and strengthen the
tools that support the decision-making process of water resources management for the city.
A comparison of the results of this case study with the previous analysis for this decision-making
problem is desired. Saldarriaga et al. [
58
] implemented a multiattribute utility theory (MAUT) model to
Water 2019, 11, 805
16 of 23
determine the ranking of the seven alternatives of this project. MAUT is based on ordinal comparison
of each alternatives using a multiattribute utility function. The most common approach of MAUT for
evaluating multiattribute alternatives is to use an additive representation [
35
]:
U
(
A
i
) =
X
∇ j
w
j
v
j
(
A
i
)
(2)
where U is an additive multiattribute utility function, A
i
is the alternative i, w
j
is the weight of j
criterion or attribute, and v
j
is an utility function associated to j. The authors weighted all criteria
(including the costs) and determined a unique performance score.
Figure
9
provides a comparison of the alternatives scores relative to the implemented methodology,
namely, the AHP (performance index) and MAUT models. In general, the AHP score is lower than the
score calculated by MAUT; however, similarities exist in the ranking obtained by both models. Table
6
shows the rankings obtained with the AHP and MAUT methods, where A7 is the best alternative,
A2 ranks third, and A6 ranks last.
Water 2019, 11, x FOR PEER REVIEW
18 of 23
A comparison of the results of this case study with the previous analysis for this decision-making
problem is desired. Saldarriaga et al. [58] implemented a multiattribute utility theory (MAUT) model
to determine the ranking of the seven alternatives of this project. MAUT is based on ordinal
comparison of each alternatives using a multiattribute utility function. The most common approach
of MAUT for evaluating multiattribute alternatives is to use an additive representation [35]:
𝑈(𝐴
𝑖
) = ∑ 𝑤
𝑗
𝑣
𝑗
(𝐴
𝑖
)
∇𝑗
(2)
where 𝑈 is an additive multiattribute utility function, 𝐴
𝑖
is the alternative 𝑖, 𝑤
𝑗
is the weight of 𝑗
criterion or attribute, and 𝑣
𝑗
is an utility function associated to 𝑗. The authors weighted all criteria
(including the costs) and determined a unique performance score.
Figure 9 provides a comparison of the alternatives scores relative to the implemented
methodology, namely, the AHP (performance index) and MAUT models. In general, the AHP score
is lower than the score calculated by MAUT; however, similarities exist in the ranking obtained by
both models. Table 6 shows the rankings obtained with the AHP and MAUT methods, where A7 is
the best alternative, A2 ranks third, and A6 ranks last.
Figure 9. Alternatives’ scores by methodology (AHP and MAUT).
Table 6. Alternatives’ rankings by methodology (AHP and MAUT).
Rank AHP MAUT
1
A7
A7
2
A4
A5
3
A2
A2
4
A3
A1
5
A5
A3
6
A1
A4
7
A6
A6
Additionally, Figure 10 shows a dispersion plot that compares the normalized scores for both
methodologies. If the two models were consistent, a linear relation would be expected. In this case,
the obtained coefficient of correlation (ρ) between the alternative’s score using AHP and MAUT was
0.876. However, is noteworthy that A4 and A5 diverge as a function of the method. MAUT penalizes
A4, whereas the AHP promotes A4; the inverse case occurs with A5. This change can be attributed to
Figure 9.
Alternatives’ scores by methodology (AHP and MAUT).
Table 6.
Alternatives’ rankings by methodology (AHP and MAUT).
Rank
AHP
MAUT
1
A7
A7
2
A4
A5
3
A2
A2
4
A3
A1
5
A5
A3
6
A1
A4
7
A6
A6
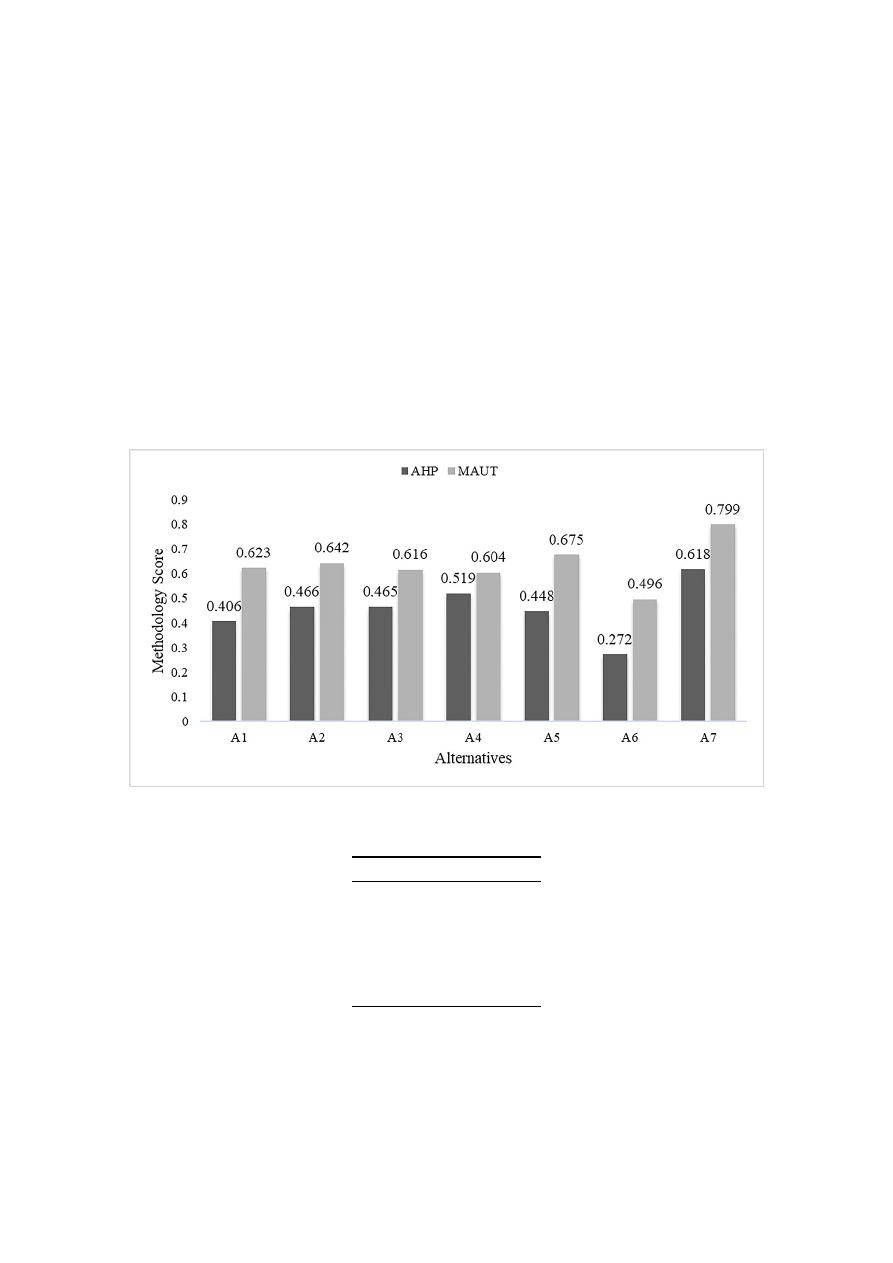
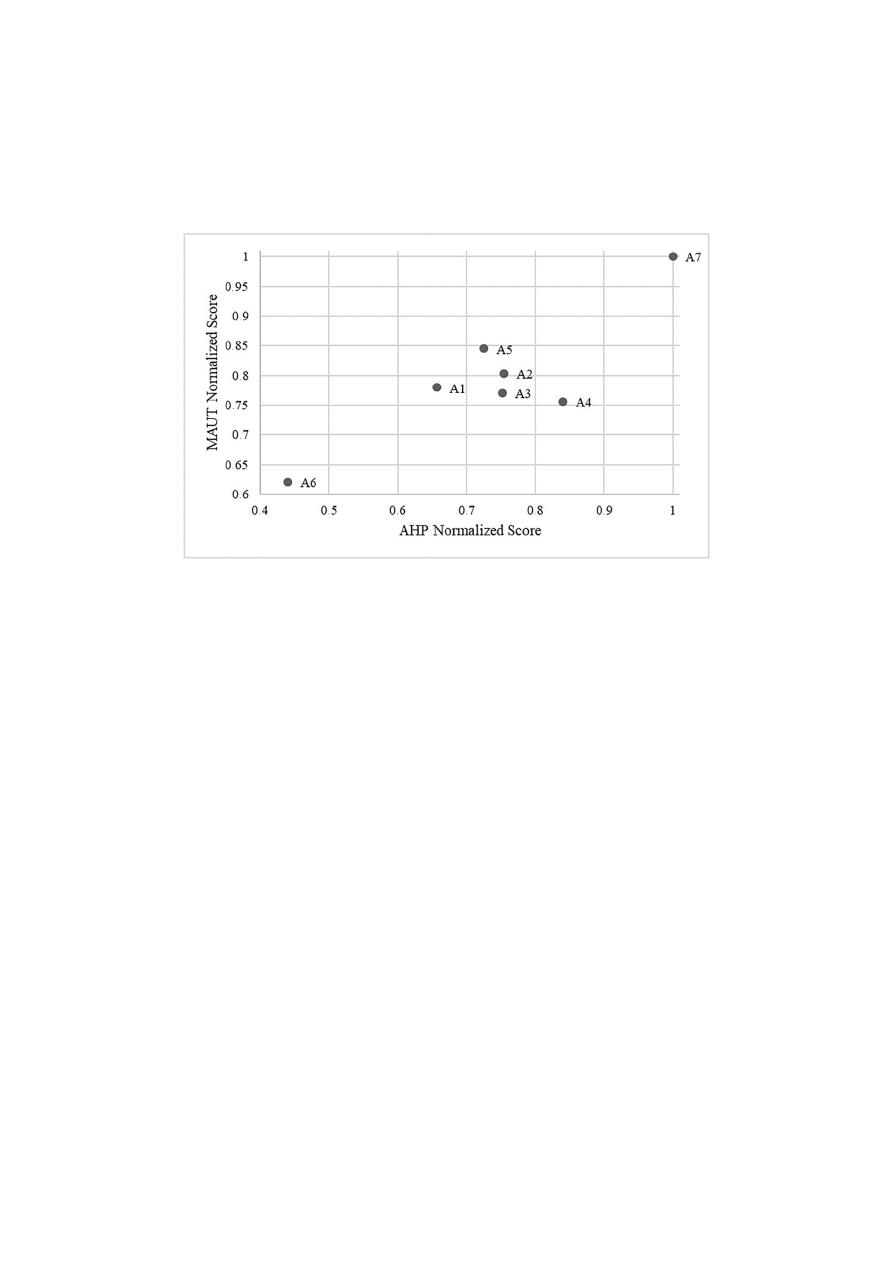
Additionally, Figure
10
shows a dispersion plot that compares the normalized scores for both
methodologies. If the two models were consistent, a linear relation would be expected. In this case,
the obtained coe
fficient of correlation (ρ) between the alternative’s score using AHP and MAUT was
0.876. However, is noteworthy that A4 and A5 diverge as a function of the method. MAUT penalizes
A4, whereas the AHP promotes A4; the inverse case occurs with A5. This change can be attributed
to the method by which the preference of the stakeholders was measured. Note that the remaining
Water 2019, 11, 805
17 of 23
alternatives and their scores are consistent, and the scores given to A2, A3, A4, and A5 are similar
using both methodologies. Considering the ranking obtained by the MAUT and AHP models, we
obtained the best option (A7), followed by a group of average alternatives (A2, A3, A4, A5) and a
group of alternatives with poor performance (A1 and A6).
Water 2019, 11, x FOR PEER REVIEW
19 of 23
the method by which the preference of the stakeholders was measured. Note that the remaining
alternatives and their scores are consistent, and the scores given to A2, A3, A4, and A5 are similar
using both methodologies. Considering the ranking obtained by the MAUT and AHP models, we
obtained the best option (A7), followed by a group of average alternatives (A2, A3, A4, A5) and a
group of alternatives with poor performance (A1 and A6).
Figure 10. Normalized scores comparison for both methodologies.
Characterization of the performance of each alternative is useful as a tool to support decision-
making related to the described problem. If only non-economic criteria are considered, A7, A4, and
A5 systematically perform best even with strong weight variation. Conversely, when non-economic
and economic criteria are simultaneously considered, A2 substitutes A5 in the ranking because A2 is
less expensive. However, A7 remains at the top of the ranking. Note that the ranking is highly
sensitive to variations in the weight of the economic criterion. As we compare the results of AHP
with those of MAUT, a fair match is obtained with the best option and worst option (A7 and A6,
respectively), and a group of intermediate alternatives is also obtained. These mid-ranking
alternatives are very similar, especially with the MAUT results.
These results support the implementation of A7, given its outstanding performance when
assessed against the selected criteria when corroborated with sensitivity analyses and compared with
other methodologies. If A7 is implemented as planned, Toribio PWTP will treat water from the
Magdalena, Toribio, and Córdoba rivers (Figure 11). To complement the analysis of the A7 features,
Figure 12 shows the treatment capacity, water demand, and system losses throughout the lifecycle of
the project. The first stage of the new plant should commence operations two years after the
beginning of construction, and, within three years, the city is expected to eliminate their water supply
deficit. In addition to addressing the water shortage, the total water demand for subsequent years
will be broadly satisfied, including the domestic, commercial, industrial, and increasing tourist
demand for the city. Water supply management also includes the project’s implementation of a long-
term plan of continuous technical losses and PWTP water requirement reduction implemented by
the local water utility (i.e., initial system losses represent approximately 43%, and reductions of 17%
are expected by 2035). A7 is a roadmap for providing safe water to Santa Mater City over the next 50
years.
Figure 10.
Normalized scores comparison for both methodologies.
Characterization of the performance of each alternative is useful as a tool to support
decision-making related to the described problem. If only non-economic criteria are considered, A7, A4,
and A5 systematically perform best even with strong weight variation. Conversely, when non-economic
and economic criteria are simultaneously considered, A2 substitutes A5 in the ranking because A2 is
less expensive. However, A7 remains at the top of the ranking. Note that the ranking is highly sensitive
to variations in the weight of the economic criterion. As we compare the results of AHP with those of
MAUT, a fair match is obtained with the best option and worst option (A7 and A6, respectively), and a
group of intermediate alternatives is also obtained. These mid-ranking alternatives are very similar,
especially with the MAUT results.
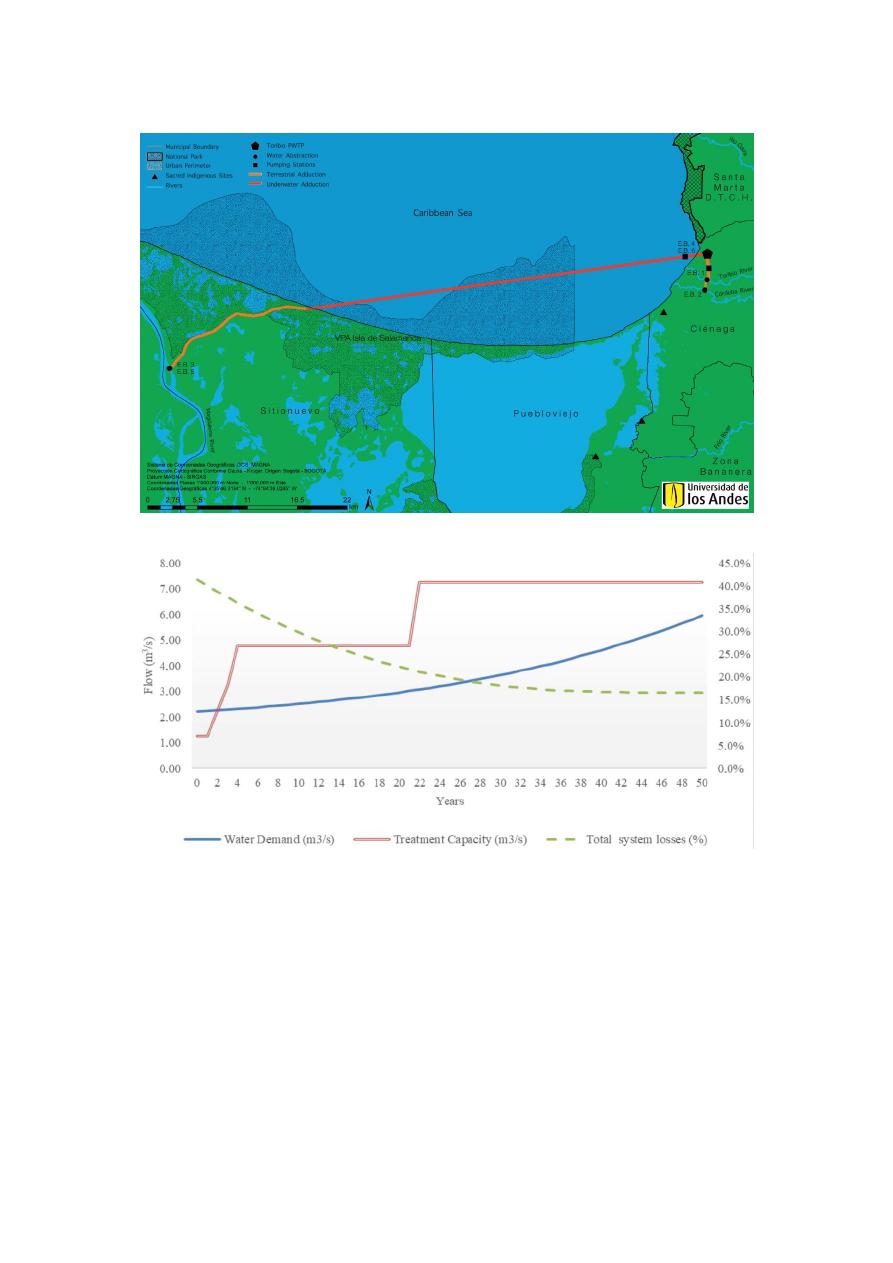
These results support the implementation of A7, given its outstanding performance when assessed
against the selected criteria when corroborated with sensitivity analyses and compared with other
methodologies. If A7 is implemented as planned, Toribio PWTP will treat water from the Magdalena,
Toribio, and Córdoba rivers (Figure
11
). To complement the analysis of the A7 features, Figure
12
shows
the treatment capacity, water demand, and system losses throughout the lifecycle of the project. The first
stage of the new plant should commence operations two years after the beginning of construction,
and, within three years, the city is expected to eliminate their water supply deficit. In addition to
addressing the water shortage, the total water demand for subsequent years will be broadly satisfied,
including the domestic, commercial, industrial, and increasing tourist demand for the city. Water
supply management also includes the project’s implementation of a long-term plan of continuous
technical losses and PWTP water requirement reduction implemented by the local water utility (i.e.,
initial system losses represent approximately 43%, and reductions of 17% are expected by 2035). A7 is
a roadmap for providing safe water to Santa Mater City over the next 50 years.
Water 2019, 11, 805
18 of 23
Water 2019, 11, x FOR PEER REVIEW
20 of 23
Figure 11. Selected alternative characteristics and geographical location, Adapted from [58].
Figure 12. Alternative 7: water demand, treatment capacity and system losses.
6. Limitations and Future Research
Throughout this paper, we have presented a MCDA methodology and a case study for water
infrastructure planning using a supply-based approach. This approach has important limitations,
such as the supply uncertainty in a climate change scenario and the non-inclusion of the resilience
criterion, which describes how quickly a system is likely to recover after the occurrence of a failure
[49,59]. For this reason, the implementation of water demand management strategies to complement
supply-oriented efforts is essential. As an illustration, one limitation of this case study was to assume
a static per capita water demand during the lifecycle of the project, which was performed given legal
requirements for new water supply infrastructure projects in Colombia. However, managing and
reducing the per capita water demand represents several economical and sustainability benefits and
important challenges for water planners [60–63]. For example, Cooley and Parishamban [64] discovered
that urban water conservation and efficiency measures are the most cost-effective measures for
Figure 11.
Selected alternative characteristics and geographical location, Adapted from [
58
].
Water 2019, 11, x FOR PEER REVIEW
20 of 23
Figure 11. Selected alternative characteristics and geographical location, Adapted from [58].
Figure 12. Alternative 7: water demand, treatment capacity and system losses.
6. Limitations and Future Research
Throughout this paper, we have presented a MCDA methodology and a case study for water
infrastructure planning using a supply-based approach. This approach has important limitations,
such as the supply uncertainty in a climate change scenario and the non-inclusion of the resilience
criterion, which describes how quickly a system is likely to recover after the occurrence of a failure
[49,59]. For this reason, the implementation of water demand management strategies to complement
supply-oriented efforts is essential. As an illustration, one limitation of this case study was to assume
a static per capita water demand during the lifecycle of the project, which was performed given legal
requirements for new water supply infrastructure projects in Colombia. However, managing and
reducing the per capita water demand represents several economical and sustainability benefits and
important challenges for water planners [60–63]. For example, Cooley and Parishamban [64] discovered
that urban water conservation and efficiency measures are the most cost-effective measures for
Figure 12.
Alternative 7: water demand, treatment capacity and system losses.
6. Limitations and Future Research
Throughout this paper, we have presented a MCDA methodology and a case study for water
infrastructure planning using a supply-based approach. This approach has important limitations, such
as the supply uncertainty in a climate change scenario and the non-inclusion of the resilience criterion,
which describes how quickly a system is likely to recover after the occurrence of a failure [
49
,
59
]. For this
reason, the implementation of water demand management strategies to complement supply-oriented
e
fforts is essential. As an illustration, one limitation of this case study was to assume a static per capita
water demand during the lifecycle of the project, which was performed given legal requirements for
new water supply infrastructure projects in Colombia. However, managing and reducing the per capita
water demand represents several economical and sustainability benefits and important challenges
for water planners [
60
–
63
]. For example, Cooley and Parishamban [
64
] discovered that urban water
conservation and e
fficiency measures are the most cost-effective measures for satisfying current and
future water needs in California. Additionally, the UK Environmental Agency [
65
] presented the

Water 2019, 11, 805
19 of 23
economic, social, and environmental benefits of achieving water neutrality (i.e., total water consumed
after development is equal to or less than total water use prior to development) for the Thames Gateway,
which is the largest regeneration area in the UK.
Benefits of water demand management (WDM) can also impact the management of the new
water supply system in Santa Marta. If demand reduction is incentivized, several benefits, such as
the previously mentioned benefits and the deferment of PWTP expansions, are expected over time.
Thus, future studies should articulate e
fforts of various stakeholders to evaluate which structural and
non-structural measures or combination of measures will be more e
fficient to reduce the per capita
demand in the city. Demand reduction is a continuous water management issue throughout the project
lifecycle; however, a fixed demand value was required for the initial planning stage in Santa Marta City.
Further research should also be focused on the following planning stages of the Santa Marta’s water
supply system (WSS). According to highly developed countries’ best water management practices,
one of the main future considerations is to design a water safety plan (WSP) for the city, in order to
assess and manage the water supply risk from the source to the final user [
16
]. A WSP is necessary
to facilitate the decision-making process to properly manage the WSS under di
fferent scenarios (e.g.,
emergency situations, climate change, variability of water sources’ quantity
/quality, etc.).
Moreover, the use of MCDA techniques, such as the AHP, has intrinsic limitations. The AHP
is one of the most popular MCDA techniques, although, it has been criticized for the issue of rank
reversal (i.e., the relative rankings of the alternatives would change if an alternative were added or
deleted) [
66
,
67
]. However, Wang and Luo [
68
] have shown that the rank reversal phenomenon occurs
not only in the AHP, but also in many other MCDA approaches. Practitioners and researchers need
to be aware of this limitation for MCDA techniques, particularly when selecting a group of feasible
alternatives to consider in the decision-making process.
7. Conclusions
MCDA methods are powerful decision-making support tools for water infrastructure supply
planning [
31
,
32
,
37
]. A MCDA methodology that treats economic criteria separately from non-economic
criteria is proposed to address the water supply infrastructure planning problem. This structured
methodology represents a new approach to address this type of decision-making problem. The use
of four main non-economic criteria, which are adaptable to other possible applications, is proposed:
operational time, infrastructure setup, operational risk, and socio-environmental. The selected economic
criterion was the present value (PV) of the costs. A global evaluation that combines non-economic
assessments and economic assessments was developed to analyze the tradeo
ff between benefits and
net present of the costs.
This decision-making methodology enables stakeholders to evaluate the alternatives of the
complex water supply problem in a systemic manner. The separation between economic criteria
and non-economic criteria may increase the understanding of qualitative benefits and the financial
performance of each alternative. Given a budget, decision makers can easily establish the economic
importance relative to benefits to determine the best alternative. The selected alternative will represent
the best tradeo
ff between benefits and costs by considering the preference of several stakeholders,
given a budget. This tradeo
ff can produce a structural, rigorous, transparent, and auditable approach
to easily understand and communicate the decision-making process for complex water related projects.
A common concern during the decision-making process is the selection of an adequate method
for measuring and compiling the preferences of all stakeholders and decision makers. In this case
study, we highlighted the important di
fferences between the AHP and MAUT during the preference
elicitation process. The AHP requires the estimation of the eigenvalues of several matrices and the
weighted sum calculation by the hierarchical structure, whereas MAUT requires a weighted sum
of utility functions. The convenience of the methods varies with the complexity of the problem
and the number of criteria. For example, using MAUT in complex multi-criteria problems, such as
water-related issues, becomes wasteful, as the utility functions and weights exponentially increase when

Water 2019, 11, 805
20 of 23
the decision-making structure expands. This finding creates the need to simplify the decision-making
problem [
38
,
58
]. Using a pairwise comparison method, such as the AHP, ensures accuracy during the
relative judgement of elements and enables the stakeholders to develop a structured perspective of
the problem throughout all decision processes, which simplifies the preference elicitation process [
55
].
Additionally, the available software facilitates the calculations, and the weights estimation e
ffort is
feasible even in complex problems with several stakeholders. Is necessary to consider the computation
processes and tradeo
ffs of different MCDA techniques, such as the AHP and MAUT, to perform a
non-economic evaluation.
The developed MCDA methodology was applied to Santa Marta, Colombia, which has a current
water shortage and urgently needs a new water supply infrastructure. An AHP model was employed
to determine the preferences of various stakeholders regarding non-economic criteria for water supply
infrastructure alternatives, and to enable the ranking of alternatives to provide water in the city. After
variations in the weights of the economic criteria, the top-ranked alternative remained. The proposed
methodology supported the decision-making process that achieved the selection of the alternative
that will address the water supply problem in Santa Marta. The recommended alternative has been
implemented in Santa Marta since 2018.
Finally, our developed MCDA methodology could be applied to any city that urgently needs to
expand its capacity to satisfy the increasing water demand. Our framework is designed to support
this decision based on economic and non-economic criteria, such as operational time, infrastructure
setup, operational risk, and socio-environmental considerations. The separation of economic and
non-economic criteria might increase the understanding of qualitative benefits and the financial
performance of each alternative. The global evaluation index represents the best tradeo
ff between
benefits and cost, considering the preference of several stakeholders.
Author Contributions:
Conceptualization, J.S.; Methodology, S.C.; Software, H.A.-D.; Validation H.A.-D.; Formal
Analysis, R.S.; Investigation, H.A.-D.; Writing-Original Draft Preparation H.A.-D. & S.C.; Writing-Review &
Editing, J.S. & R.S.; Supervision, J.S.
Funding:
This research received no external funding.
Acknowledgments:
We appreciate and thank the anonymous reviewers for helpful comments that led to an
overall improvement of the manuscript.
Conflicts of Interest:
The authors declare no conflict of interest.
References
1.
United Nations Development Programme. Human Development Report 2006. Beyond Scarcity: Power, Poverty
and the Global Water Crisis; United Nations Development Programme: New York, NY, USA, 2006.
2.
United Nations 64
/292. The Human Right to Water and Sanitation. Available online:
http:
//www.un.org/es/
comun
/docs/?symbol=A/RES/64/292&lang=E
(accessed on 18 August 2016).
3.
UNICEF; World Health Organization. Progress on Sanitation and Drinking Water–2015 Update and MDG
Assessment; WHO Press: New York, NY, USA, 2015; ISBN 978-92-4-150914-5.
4.
Montgomery, M.A.; Elimelech, M. Water and sanitation in developing countries: Including health in the
equation. Environ. Sci. Technol. 2007, 41, 17–24. [
CrossRef
]
5.
Service, R.F. Desalination Freshens Up. Science (80) 2006, 313, 1088–1090. [
CrossRef
] [
PubMed
]
6.
Santos-Pereira, L.; Cordery, I.; Iacovides, I. Coping with Water Scarcity: Adressing the Challenges; Springer
Science & Business Media: Paris, France, 2009; ISBN 9788578110796.
7.
WWAP. The United Nations World Water Development Report 2016: Water and Jobs; UNESCO: Paris, France,
2016; ISBN 9789231001468.
8.
Elimelech, M.; Phillip, W.A. The Future of Seawater and the Environment: Energy, Technology, and the
Environment. Science (80) 2011, 333, 712–718. [
CrossRef
] [
PubMed
]
9.
Food and Agriculture Organization of the United Nations. Coping with Water Scarcity: An Action Framework
for Agriculture and Food Security; FAO Publications: Rome, Italy, 2012; ISBN 9789251073049.

Water 2019, 11, 805
21 of 23
10.
Watson, D.; Arrowsmith, C.; Goudey, R. Water availability: A regional water quality problem. Int. J. River
Basin Manag. 2003, 1, 321–330. [
CrossRef
]
11.
Dearmont, D.; McCarl, D.; Tolman, A. Costs of water treatment due to diminished water quality: A case
study in Texas. Water Resour. Res. 1998, 34, 849–853. [
CrossRef
]
12.
Liu, J.; Liu, Q.; Yang, H. Assessing water scarcity by simultaneously considering environmental flow
requirements, water quantity, and water quality. Ecol. Indic. 2016, 60, 434–441. [
CrossRef
]
13.
United Nations Department of Economic and Social A
ffairs. World Urbanization Prospects: The 2014 Revision;
United Nations Department of Economic and Social A
ffairs: New York, NY, USA, 2015.
14.
OECD. OECD Environmental Outook to 2050: The Consequences of Inaction; OECD: Paris, France, 2012.
15.
Pietrucha-Urbanik, K.; ˙Zelazko, A. Approaches to assess water distribution failure. Period. Polytech. Civ. Eng.
2017
, 61, 632–639. [
CrossRef
]
16.
Pietrucha-Urbanik, K.; Tchórzewska-Cie´slak, B. Approaches to failure risk analysis of the water distribution
network with regard to the safety of consumers. Water 2018, 10, 1679. [
CrossRef
]
17.
Bartram, J.; Corrales, L.; Davison, A.; Deere, D.; Drury, D.; Gordon, B.; Howard, G.; Rinehold, A.; Stevens, M.
Water Safety Plan Manual (WSP Manual): Step-by-Step Risk Management for Drinking-Water Suppliers; World
Health Organization, International Water Association, Eds.; World Health Organization: Geneva, Switzerland,
2009; ISBN 978-92-4-156263-8.
18.
Pietrucha-Urbanik, K.; Tchórzewska-Cie´slak, B. Water Supply System operation regarding consumer
safety using Kohonen neural network.
In Safety, Reliability And Risk Analysis: Beyond The Horizon;
Steenbergen, R.D.J.M., van Gelder, P.H.A.J.M., Miraglia, S., Vrouwenvelder, A.C.W.M., Eds.; Taylor &
Francis Group: London, UK, 2014; pp. 1115–1120. ISBN 9781138001237.
19.
Shannon, M.A.; Bohn, P.W.; Elimelech, M.; Georgiadis, J.G.; Marinas, B.J.; Mayes, A.M. Science and technology
for water purification in the coming decades. Nature 2008, 452, 301–310. [
CrossRef
]
20.
Eggimann, S.; Mutzner, L.; Wani, O.; Schneider, M.Y.; Spuhler, D.; Moy de Vitry, M.; Philipp, B.; Maurer, M.
The potential of knowing more—A review of data-driven urban water management. Environ. Sci. Technol.
2017
, 51, 2538–2553. [
CrossRef
]
21.
Lienert, J.; Scholten, L.; Ehher, C.; Maurer, M. Structured decision-making for sustainable water infrastructure
planning and four future scenarios. EURO J. Decis. Process. 2015, 242, 107–140. [
CrossRef
]
22.
Kang, M.-G.; Lee, G.-M. Multicriteria Evaluation of Water Resources Sustainability in the Context of
Watershed Management1. JAWRA J. Am. Water Resour. Assoc. 2011, 47, 813–827. [
CrossRef
]
23.
Chung, E.S.; Lee, K.S. Prioritization of water management for sustainability using hydrologic simulation
model and multicriteria decision making techniques. J. Environ. Manag. 2009, 90, 1502–1511. [
CrossRef
]
24.
Al-Zu’ bi, Y.; Shatanawi, M.; Al-Jayoussi, O.; Al-Kharabsheh, A. Application of Decision Support System
for Sustainable Management of Water Resources in the Azraq Basin—Jordan. Water Int. 2002, 27, 532–541.
[
CrossRef
]
25.
Ennaouri, I.; Fuamba, M. New Integrated Condition-Assessment Model for Combined Storm-Sewer Systems.
J. Water Resour. Plan. Manag. 2013, 139, 53–64. [
CrossRef
]
26.
Ahammed, F.; Alankarage-Hewa, G.; Argue, J.R. Applying multi-criteria decision analysis to select WSUD
and LID technologies. Water Sci. Technol. Water Supply 2012, 12, 844–853. [
CrossRef
]
27.
Martin, C.; Ruperd, Y.; Legret, M. Urban stormwater drainage management: The development of a multicriteria
decision aid approach for best management practices. Eur. J. Oper. Res. 2007, 181, 338–349. [
CrossRef
]
28.
Benzerra, A.; Cherrared, M.; Chocat, B.; Cherqui, F.; Zekiouk, T. Decision support for sustainable urban
drainage system management: A case study of Jijel, Algeria. J. Environ. Manag. 2012, 101, 46–53. [
CrossRef
]
29.
Kim, Y.; Chung, E.-S.; Jun, S.-M.; Kim, S.U. Prioritizing the best sites for treated wastewater instream use in
an urban watershed using fuzzy TOPSIS. Resour. Conserv. Recycl. 2013, 73, 23–32. [
CrossRef
]
30.
Zheng, J.; Egger, C.; Lienert, J. A scenario-based MCDA framework for wastewater infrastructure planning
under uncertainty. J. Environ. Manag. 2016, 183, 895–908. [
CrossRef
]
31.
Hajkowicz, S.; Collins, K. A review of multiple criteria analysis for water resource planning and management.
Water Resour. Manag. 2007, 21, 1553–1566. [
CrossRef
]
32.
Lai, E.; Lundie, S.; Ashbolt, N.J. Review of multi-criteria decision aid for integrated sustainability assessment
of urban water systems. Urban Water J. 2008, 5, 315–327. [
CrossRef
]
33.
Castillo, M. Toma de Decisiones en las Empresas: Entre el arte y la Técnica; Ediciones Uniandes: Bogotá, Colombia, 2006.

Water 2019, 11, 805
22 of 23
34.
Roy, B. Paradigms and challenges. In Multiple Criteria Decision Analysis: State of the Art Surveys; Figueira, J.,
Greco, S., Ehrgott, M., Eds.; Springer Science
+ Business Media, Inc.: Boston, MA, USA, 2005; pp. 19–39.
ISBN 978-0-387-23067-2.
35.
Figueira, J.; Greco, S.; Ehrgott, M. (Eds.) Multiple Criteria Decision Analysis: State of Art Surveys; Springer
Science
+ Business Media, Inc.: Boston, MA, USA, 2005; ISBN 9788578110796.
36.
Hajkowicz, S.; Higgins, A. A comparison of multiple criteria analysis techniques for water resource
management. Eur. J. Oper. Res. 2008, 184, 255–265. [
CrossRef
]
37.
Kabir, G.; Sadiq, R.; Tesfamariam, S. A review of multi-criteria decision-making methods for infrastructure
management. Struct. Infrastruct. Eng. 2014, 10, 1176–1210. [
CrossRef
]
38.
Scholten, L.; Schuwirth, N.; Reichert, P.; Lienert, J. Tackling uncertainty in multi-criteria decision analysis—An
application to water supply infrastructure planning. Eur. J. Oper. Res. 2015, 242, 243–260. [
CrossRef
]
39.
Okeola, O.G.; Sule, B.F. Evaluation of management alternatives for urban water supply system using
Multicriteria Decision Analysis. J. King Saud Univ. Eng. Sci. 2012, 24, 19–24. [
CrossRef
]
40.
Jaber, J.; Mohsen, M. Evaluation of non-conventional water resources supply in Jordan. Desalination 2001,
136, 83–92. [
CrossRef
]
41.
Abrishamchi, A.; Ebrahimian, A.; Tajrishi, M.; Mariño, M. A Case study: Application of multicriteria decision
making to urban water supply. J. Water Resour. Plan. Manag. 2005, 131, 326. [
CrossRef
]
42.
Kodikara, P.N.; Perera, B.J.C.; Kularathna, M.D.U.P. Stakeholder preference elicitation and modelling in
multi-criteria decision analysis—A case study on urban water supply. Eur. J. Oper. Res. 2010, 206, 209–220.
[
CrossRef
]
43.
Clemen, R.; Reilly, T. Making Hard Decisions with Decision Tools, 2nd ed.; Brooks
/Cole: Belmont, CA, USA, 2001.
44.
Zarghami, M.; Szidarovszky, F. Multicriteria Analysis: Applications to Water and Environment Management;
Springer-Verlag: Berlin, Germany, 2011; ISBN 3642179371.
45.
Lü, Y.P.; Yang, K.; Che, Y.; Shang, Z.Y.; Zhu, H.F.; Jian, Y.; Lu, Y.P. Cost-efectiveness-based multicriteria
optimization for sustainable rainwater utilization: A case study in Shanghai. Urban Water J. 2013, 10, 127–143.
[
CrossRef
]
46.
Saaty, T.L. Mathematical Principles of Decision Making (Principia Mathematica Decernendi); RWS Publications:
Pittsburgh, PA, USA, 2010.
47.
Edwards, W.; Miles, R.F., Jr.; Von Winterfeldt, D. (Eds.) Advances in Decision Analysis: From Foundations to
Applications; Cambridge University Press: Cambridge, UK, 2007.
48.
Cruz, M.G. Modeling, Measuring and Hedging Operational Risk; John Wiley & Sons: New York, NY, USA, 2002.
49.
Zhang, C.; Xu, B.; Li, Y.; Fu, G. Exploring the relationships among reliability, resilience, and vulnerability of
water supply using many-objective analysis. J. Water Resour. Plan. Manag. 2017, 143. [
CrossRef
]
50.
UN-HABITAT. Meeting Development Goals in Small Urban Centres: Water and Sanitation in the World’s Citites;
Earthscan: Nairobi, Kenya, 2006; ISBN 9781844073054.
51.
Talavera, D.L.; Nofuentes, G.; Aguilera, J.; Fuentes, M. Tables for the estimation of the internal rate of return
of photovoltaic grid-connected systems. Renew. Sustain. Energy Rev. 2007, 11, 447–466. [
CrossRef
]
52.
Guerrero, T.A.; Furlong, K.; Arias, J. Complicating neoliberalization and decentralization: The non-linear
experience of Colombian water supply, 1909–2012. Int. J. Water Resour. Dev. 2016, 32, 172–188. [
CrossRef
]
53.
Gregory, R.; Failing, L.; Harstone, M.; Long, G.; McDaniels, D.; Ohlson, D. Structured Decision Making: A
Practical Guide to Environmental Management Choices; Wiley-Blackwell: New York, NY, USA, 2012.
54.
Marttunen, M.; Lienert, J.; Belton, V. Structuring problems for Multi-Criteria Decision Analysis in Practice: A
Literature Review of Method Combinations. Eur. J. Oper. Res. 2017, 263, 1–17. [
CrossRef
]
55.
Saaty, T.L. The analytic hierarchy and analytic network processes for the measurement of intangible criteria
and for decision-making. In Multicriteria Decision Analysis: State of the Art Surveys; Figueira, J., Greco, S.,
Ehrgott, M., Eds.; Springer Science
+ Business Media, Inc.: Boston, MA, USA, 2005; pp. 363–419. ISBN
978-0-387-23081-8.
56.
Saaty, R.W. The analytic hierarchy process-what it is and how it is used. Math. Model. 1987, 9, 161–176.
[
CrossRef
]
57.
Saldarriaga, J. SOS: Agua para Santa Marta. Contacto 2015, 10, 5–12.
58.
Saldarriaga, J.; Siabatto, L.; Cotes, L.; Duque, N.; Cifuentes, G.; Madrid, N. Resultados de los Estudios
de Abastecimiento de Agua para Santa Marta; Financiera de Desarrollo Territorial S.A. FINDETER: Bogotá,
Colombia, 2015.

Water 2019, 11, 805
23 of 23
59.
Giurco, D.P.; Turner, A.; Fane, S.; White, S.B. Desalination for Urban Water: Changing Perceptions and Future
Scenarios in Australia. Chem. Eng. Trans. 2014, 42, 13–18.
60.
Giacomoni, M.H.; Berglund, E.Z. Complex Adaptive Modeling Framework for Evaluating Adaptive Demand
Management for Urban Water Resources Sustainability. J. Water Resour. Plan. Manag. 2015, 141, 04015024.
[
CrossRef
]
61.
Xiao, Y.; Fang, L.; Hipel, K.W.; Wre, H.D.; Asce, F. Agent-Based Modeling Approach to Investigating the
Impact of Water Demand Management. J. Water Resour. Plan. Manag. 2018, 144, 1–12. [
CrossRef
]
62.
Fielding, K.S.; Spinks, A.; Russell, S.; McCrea, R.; Stewart, R.; Gardner, J. An experimental test of voluntary
strategies to promote urban water demand management. J. Environ. Manag. 2013, 114, 343–351. [
CrossRef
]
63.
Beal, C.D.; Gurung, T.R.; Stewart, R.A. Demand-side management for supply-side efficiency: Modeling tailored
strategies for reducing peak residential water demand. Sustain. Prod. Consum. 2016, 6, 1–11. [
CrossRef
]
64.
Cooley, H.; Phurisamban, R. The Cost of Alternative Water Supply and E
fficiency Options in California; Pacific
Institute: Oakland, CA, USA, 2016.
65.
Environment Agency (EA). Water Neutrality: An Economic Assessment for the Thames Gateway Development;
Environment Agency: Bristol, UK, 2009.
66.
Ho, W.; Ma, X. The state-of-the-art integrations and applications of the analytic hierarchy process. Eur. J.
Oper. Res. 2018, 267, 399–414. [
CrossRef
]
67.
Maleki, H.; Zahir, S. A Comprehensive Literature Review of the Rank Reversal Phenomenon in the Analytical
Hierarchy Process. J. Multi-Criteria Decis. Anal. 2013, 20, 141–155. [
CrossRef
]
68.
Wang, Y.M.; Luo, Y. On rank reversal in decision analysis. Math. Comput. Model. 2009, 49, 1221–1229.
[
CrossRef
]
© 2019 by the authors. Licensee MDPI, Basel, Switzerland. This article is an open access
article distributed under the terms and conditions of the Creative Commons Attribution
(CC BY) license (http:
//creativecommons.org/licenses/by/4.0/).
